The 1 reading that separates a wobble from a crisis did not print, and 81% of Friday has no cause
⚓ Weathervane. The wind is coming from the long end. The policy rate has been frozen for most of the year whilst the term premium does the tightening, and the price of long money is set by deficits, issuance supply and a synchronised global duration bid rather than by the committee. Higher-for-longer stopped being a Fed decision and became a bond-market fact. The cruise ship is holding this heading.
 Ahoy there, Trader! ⚓️
It’s Phil…
The weathervane spun hard on Friday and the sea stayed flat.
What is a 21% jump in volatility actually worth, if nothing else on the board will confirm it?
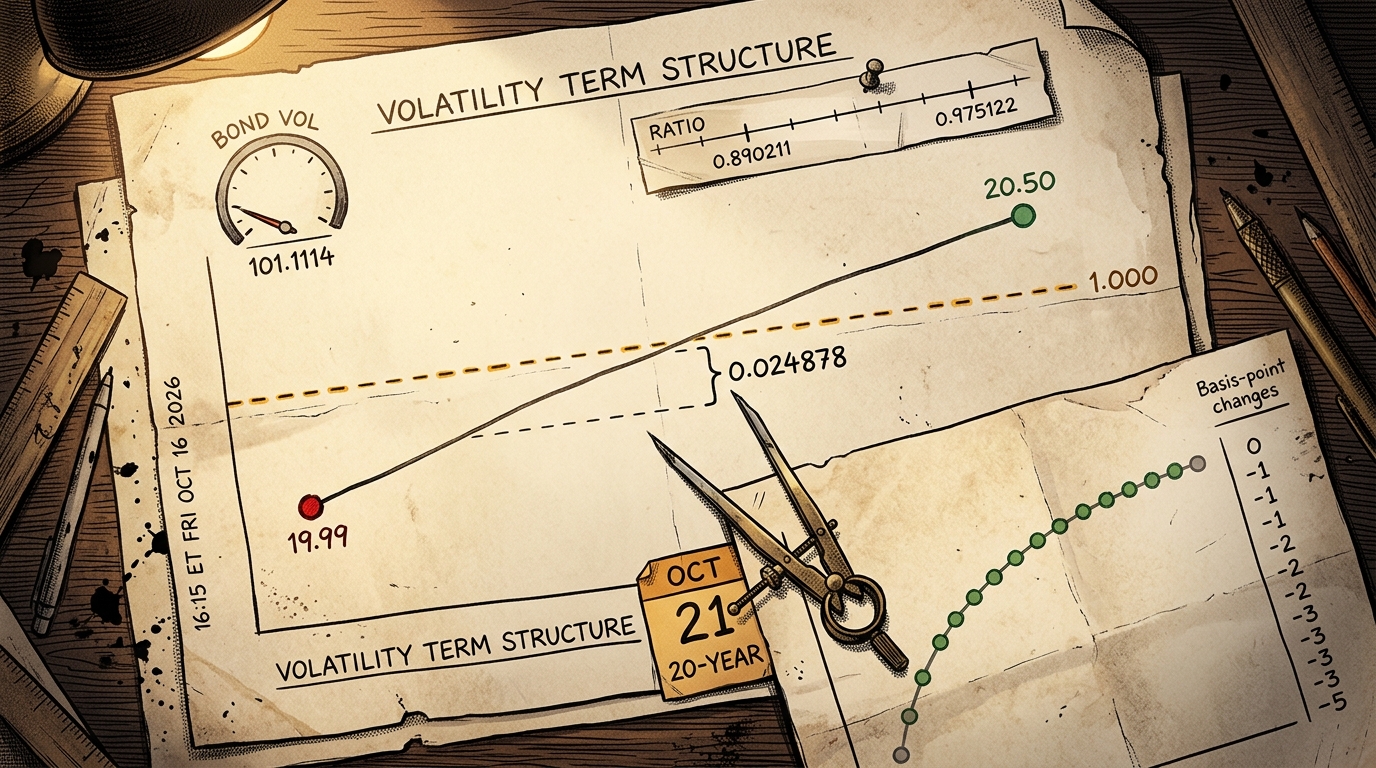
Spot volatility closed 19.99 from 16.46, up 21.44593%. Three-month volatility closed 20.50. The ratio went from 0.890211 to 0.975122 and stayed in contango, spot 0.51 points below the three-month. The second number is the one doing the work.
Now the rest of the board. Bond volatility fell 1.351941%. The yen moved 0.000633%. All fourteen Treasury tenors moved between zero and minus five basis points, the 30-year unchanged. Energy led every sector at 2.524038%.
The textbook here is unusually clear. A violent repricing of equity risk should invert the volatility curve, lift rate volatility, gap credit and collapse breadth. Two of those four did not happen and two half-happened. The curve compressed and declined to invert; rate volatility went the other way. Credit did widen, roughly 13.77 basis points at high yield on a duration-adjusted read, and that sign is indicative rather than established: the curve barely moved at the tenor where that instrument lives. Breadth split: NYSE new highs beat new lows 58 to 38 whilst Nasdaq new lows beat new highs 119 to 33.
So we have the shape rather than the cause. What did not happen is a change in the price of money. What the tape is consistent with is selling confined to one complex, an inference and not a finding: this book holds no positioning or flow data for Friday. The only releases carrying a tier-one timestamp landed before the bell, which buys the opening gap: 18.514637% of the Nasdaq-100’s fall. 81.485363% of the move has no named cause in this book. Nor do we have one for crude, up over 2.6% on both benchmarks. Three desks have an explanation. Two are stamped after Friday closed; the third predates it by two sessions and is a regime label with no clock.
Which leaves the thing to watch. The ratio sits 0.024878 below 1.000, and spot above three-month is where this desk draws the line between crowded selling and a funding market in difficulty. In fairness, we hold two observations of it and no base rate: 0.890211 on Thursday, 0.975122 on Friday. That is the whole history. If it prints at or above 1.000 this week, the heading changes. If not, we still have no cause for Friday, only the knowledge that the instrument that would have escalated it declined to.
Phil’s Musing
Six weeks of complaining that volatility would not move, and I got what I asked for. The not-moving taught me more. What changed is which instrument I reach for first: not the gauge’s level, but its gap to its own three-month leg. The level tells you how loudly people are shouting. The gap tells you whether anyone with a balance sheet is listening.
Happy trading,
Phil
Less Brain, More Gain
…and may your trades be smoother than a cashmere codpiece
P.S. – Phils Footnote I nearly wrote on Friday evening that the vol spike confirmed the duration thesis, which would have been three kinds of wrong in one sentence. The curve richened at thirteen of fourteen tenors, the thirty-year printed nothing at all, and the twenty-year’s clearance over it actually narrowed. The lesson I keep relearning is that a number arriving loudly is not the same as a number arriving with company, and I am still not good at telling the difference in the moment.
🗂 Desk Notes – Part 231 | 19 Oct 2026
Raw briefing. Observations only. No trades are named anywhere in this file.
Session read (§8.4)
SESSION BRIDGE: prior session (Fri) full reaction December ES -1.113464%, December NQ -2.495542%, December YM -0.411978%, December RTY -1.66439%, cash VIX 19.99 up 21.44593%; live premarket ES +0.736606% / NQ +1.373696%, VIX 19.99 carried as Friday’s official cash close because no premarket volatility print exists on this stack; threshold: soft.
Why soft rather than HARD or none. §8.4.1 is specced on S&P futures and December ES returned -1.113464%, which sits in the 1.0% to under 2.0% investigate band. That is a soft trigger and it earns a carry-over because a clear catalyst question exists. The premarket leg fires soft independently: December ES at +0.736606% is outside the roughly 0.6% normal premarket envelope. The volatility leg also fires on its own terms, a ±8% single-session VIX move being the threshold and the print being 21.44593%. The commodity leg does not fire: December WTI moved 2.611399% against a ±4% threshold.
§8.4.2, the cash-magnitude trigger (Open Rulings item O). Two of three conditions trip. The best-to-worst sector spread was 5.547454 percentage points against a 4.0 point threshold, and a named constituent moved more than 10%, CoreWeave at -11.909887%. The third condition, a headline index posting its largest or second-largest daily move of the held window, is NOT ESTABLISHABLE: this run holds only five dated sessions of index closes and a daily-change ranking needs a window of daily changes. The §8.3 board and the item P decomposition are therefore MANDATORY this edition and both were run.
Close-to-open window. Friday cash close 20:00 UTC to this morning’s 06:30 UTC capture bar, a gap of 58.5 hours including a full weekend. Capture read twice, several minutes apart, byte-identical open, high, low, close and volume on all four dated contracts, with the then-forming 07:20 UTC bar mutating on all four between the reads as the control. That is the first clean four-contract confirmation in three editions and it restores the run Part 229 broke.
Contract-roll warning (§2.5). Not a quarterly roll date. Equity index futures remain December. WTI rolled to December on 15 October and the roll went decisive on 16 October at a volume ratio of 3.384469, November’s volume having fallen 55.5% session on session whilst December’s rose. NYMEX:CLX2026 last trades about 20 October, so no multi-session WTI front-month superlative is publishable without a splice and none is published. Brent’s front stays December. Both products are now front-December and the long-standing “the two products run opposite ways” note has lapsed; it must not reach copy.
Mechanism read (full)
The front end. The 2-year closed 4.74% from 4.77%, three basis points richer. The 1-year, 2-year, 3-year and 4-month tenors each printed exactly -3bp, recomputed in code over all fourteen tenors.
The long end. The 10-year closed 5.09%, one basis point richer. The 20-year closed 5.47%, one richer. The 30-year printed 0bp and closed unchanged at 5.43%.
| Tenor | 16 Oct | 15 Oct | bp |
|---|---|---|---|
| 1 Mo | 4.12 | 4.17 | -5 |
| 1.5 Month | 4.14 | 4.15 | -1 |
| 2 Mo | 4.17 | 4.19 | -2 |
| 3 Mo | 4.26 | 4.28 | -2 |
| 4 Mo | 4.32 | 4.35 | -3 |
| 6 Mo | 4.34 | 4.35 | -1 |
| 1 Yr | 4.46 | 4.49 | -3 |
| 2 Yr | 4.74 | 4.77 | -3 |
| 3 Yr | 4.82 | 4.85 | -3 |
| 5 Yr | 4.89 | 4.91 | -2 |
| 7 Yr | 4.98 | 5.00 | -2 |
| 10 Yr | 5.09 | 5.10 | -1 |
| 20 Yr | 5.47 | 5.48 | -1 |
| 30 Yr | 5.43 | 5.43 | 0 |
Read by two cache-busted fetches of the Treasury CSV returning an identical top row dated 16 October, with the header asserted by name before parsing and all six carried 15 October values reproducing exactly. The whole curve moved between 0 and -5bp, a full-curve range of 5bp, with thirteen of fourteen tenors richening and the 30-year unchanged, on a morning import prices printed 8.1% on the year. H.15 could not cross-validate 16 October: the release dated that day carries columns only through 15 October, a one-session lag confirmed before any comparison was attempted. Where overlap existed, 44 of 44 cells matched exactly and the duplicate-and-relabel bug was explicitly checked for and not found.
Spreads: 2s10s 35bp from 33, steeper by 2. 2s30s 69bp from 66, steeper by 3. 20s30s -4bp from -5, still inverted, narrowed by 1. The 20-year holds the strict highest level of all fourteen published tenors at 5.47% and clears the 30-year by 4.0bp, narrowed from 5.0bp. Fourteen consecutive published sessions of that clearance were retrieved and verified this run, every one positive; the carried count of twenty-five to twenty-six rests on sessions before 28 September that this run did not retrieve, so no count beyond the fourteen verified sessions is published anywhere.
The dollar. 101.779 from 102.004, down 0.22058% and 0.225 index points. The six-leg rebuild is on an every-third-edition schedule and was skipped, so the figure is single-route and uncorroborated. The yen closed 157.976 from 157.977, down 0.000633%.
Volatility. Spot 19.99 from 16.46, up 21.44593%, intraday 15.72 to 22.31. Three-month 20.50 from 18.49, up 10.870741%. Ratio 0.975122 from 0.890211, a rise of 0.084911. Spread -0.51. Contango throughout. It did not invert. Bond volatility 101.1114 from 102.4971, down 1.351941%, intraday low 97.5903, open 99.3123. No intraday high is held, so the close is not characterised against one.
The one artery. Equity volatility repriced violently and nothing else repriced with it. Rates vol fell, the yen was inert, the whole Treasury curve richened modestly, credit widened only marginally on a duration-adjusted read, and six of eleven sectors rose. What did NOT happen is a change in the price of money: rate volatility fell, the yen was inert and thirteen of fourteen tenors richened. What the tape is CONSISTENT WITH is a reduction confined to one complex, and that is an inference rather than a finding, because this book holds no positioning, flow or open-interest data for Friday. The vol term structure is the instrument that rules out a funding event being evidenced, and it needs no duration figure to do that. It does not identify what was sold.
What the clock permits, and the item P decomposition
The only tier-1 timestamped releases of the session were import and export prices at 12:30 UTC and industrial production at 13:15 UTC. Both precede the 13:30 UTC cash open.
Nasdaq-100: opening gap 18.514637% of the total close-to-close move, intraday leg 81.485363%, the two summing to 100 within 1e-6 and recomputed from the locked figures. A release stamped before the open can buy the gap and nothing beyond it.
81.485363% of the move has no named cause in this book. lock_part231.json is filed with named_cause: null and majority_unexplained: true, the licensed admission under Open Rulings item Q, and the validator passes it clean at 249 figures with zero failures and zero warnings. 🔴 IT WAS NOT, AND THE ARGUMENT PASS CAUGHT IT. In the first cut AntiVestor Edge carried the sentence only in its dek, its WordPress excerpt, a discarded headline alternate and a TL;DR bullet, whilst this file and the lock both certified that it reached the letter body. A self-certification is not evidence, and that is the Part 229 defect recurring in a second shape. It is now carried in AntiVestor Edge’s cold-open prose and in Macro Edge’s body, and the scope was widened at the same time: the admission now also covers the crude move, which four files published and none admitted. 🔴 Residual scope gap, stated rather than certified away: no admission is carried for the volatility spike itself, the credit widening, the benchmark gap reversal or the semiconductor proxy divergence.
The Dow decomposition is reported but not publishable in the usual form: it gapped UP 130.59 points and reversed, so the gap and the total carry opposite signs and the shares read -74.503651% and 174.503651%. Those are arithmetically correct and editorially useless, and a share exceeding 100 must never be presented as a proportion of a move. The Russell’s intraday range is not published at all: TVC:RUT carries the prior-close-plus-0.0001 artefact. No decomposition exists for the volatility spine, CMT and the volatility indices having no publishable intraday series on this stack.
§8.3 candidate cause board (Open Rulings items N and R)
Column one, effects without causes.
| Candidate | Class | Timestamp | Precedes the majority? | Large enough? |
|---|---|---|---|---|
| Import and export prices | 1 scheduled release | 12:30 UTC, pre-open | NO. Buys 18.514637% only | A 1.1% monthly print is not sized to a 2.5% index fall |
| Industrial production | 1 scheduled release | 13:15 UTC, pre-open | NO. Same gap, same ceiling | No |
| AI financing repricing | 3 headline | Earliest attachable intraday stamp 19 Oct 03:11 ET | NO. Stamped AFTER the session it explains | Unknown. CoreWeave is testable in principle and was not tested |
| Rotation into energy | 3 headline | Oil-specific version 19 Oct 03:11 ET | NO | Contradicted in its own source: the Dow was 16 down and 14 up |
| Hike repricing and the stagflation label | 3 headline | 14 Oct 20:34 UTC, two sessions before | YES, and it is the only one that does | Weakest on testability. A regime label has no clock and no price path can falsify it |
Verdict: NO CAUSE IS CROWNED. Three desks supplied an explanation and two of the three are stamped after Friday closed. The coincidence form approved under item R applies and is published in Macro Edge: a correlation presented as a correlation is not the weaker story.
Column two, causes without effects. This column is where the full-strength claims live and it is not optional.
- Bond volatility fell 1.351941% on the session equity volatility rose 21.44593%. No mechanism, no duration figure and no positioning data is required to publish that. It is two closes.
- The yen moved 0.000633%. With equity vol up a fifth, a carry unwind would show here and there is no yen evidence for one. Any such narrative in this edition would be manufactured.
- Mastercard held equities rank 10 of 25 and all-asset rank 11 of 25 at an externally bracketed 07:23:39 to 07:23:55 UTC capture, with a board change of -0.002% and a board day volume of 3,428,557, the smallest in the equities top twelve. Attention ranked, price inert. Tier 3, attention finding only, never price causation.
- Nvidia is absent from all three boards at that capture whilst carrying 672,144 watchers, with
get_symbol_pulsereturning no trending block at all, which is the expected shape for a symbol outside every board and therefore positive corroboration of the absence rather than a route gap. Canonical sentiment NEUTRAL at 49; one-month message volume normalised 35, LOW. The wires were loud on Nvidia and the attention data was not.
Item Y check, run at pre-flight. No divergence flag has appeared in three consecutive ledgers that is not already a mandatory candidate here. The AI-complex flag is carried and is on the board above as class 3.
Null rate, for the item S calibration record. This edition returns a NULL on the crowning question. That is the correct outcome when no candidate passes the clock, and a board that finds a sufficient cause every session is miscalibrated rather than observant.
Overnight Excitement (§8.5)
FIRES. December Nasdaq futures at +1.373696% clear the 1.0% trigger by 0.373696 percentage points and fall 0.126304 short of the 1.5% threshold that would make it lead the section. December S&P futures at +0.736606%, December Dow at +0.436664%, December Russell at +0.731128%. Premarket dispersion between Nasdaq and S&P futures is 0.63709 percentage points, in the same ordering as Friday’s fall: the complex that lost the most is bouncing the most.
Foreign markets are colour and not trigger. Japan and China both traded on Monday, each demonstrated by a successful constituent pull carrying a 19 October bar. No level for any non-US cash index is published, because no tier-1 route to one exists on this stack. No direction is attributed either, none having been retrieved with attribution.
The credit leg, and the refusal that is published rather than buried
High yield closed 76.86, down 0.350058%. Investment grade closed 103.40, down 0.096618%. Long Treasury rose 0.100038%.
Against held effective durations of 3.25, 7.54 and 14.76 years, as at 14 October: high yield’s excess over a duration-matched 3bp move at the 3-year tenor reads roughly 13.77 basis points of widening; investment grade’s over a 2bp move at the 7-year reads roughly 3.28. The long proxy’s implied yield change of -0.68bp sits between the 30-year at 0bp and the 20-year at -1bp, agreement inside one basis point.
Three caveats. The second reached all three outward letters and the third reached AntiVestor Edge; 🔴 the first reached none of them in the first cut and was inserted into AntiVestor Edge and Inside Edge at verification. First, the long-proxy reconciliation tests only the long end and is not a validation of the single-factor assumption anywhere else; saying otherwise is circular and was cut from this file’s first draft last edition for exactly that reason. Second, the curve fell a near-uniform 3bp across the whole 1-to-3-year segment this session, so the usual tenor-mapping ambiguity at the high-yield proxy’s 3.25 years bites unusually lightly, but the sign remains indicative rather than established. Third, the held durations are a session stale and one source page is serving June data: the product pages now show 7.59 years and 14.85 years as at 15 October, and the high-yield page returns 2.99 years and an option-adjusted spread of 241.47 basis points stamped 18 June 2026, which cannot be reconciled with the held 3.25 and 296.82. The 2.99 was not adopted. A sensitivity on the newly shown figures moves every implied spread change by under one basis point, so the conclusions are robust to the revision.
The held option-adjusted spreads are as at 14 October and the implied changes are for the 15 to 16 October window. Base date and move window do not match, so the changes must never be added to the held spreads to manufacture a 16 October level. Spread figures are quoted to two decimal places because the inputs are ETF closes quoted to two.
Forward catalyst slate
Today, Monday 19 October. NAHB housing market index 10:00 ET. Two bills price at 11:30 ET: 13-week at 95 billion, CUSIP 912797TM9, and 26-week at 82 billion, CUSIP 912797WV5.
Tuesday 20 October. Housing starts and building permits 08:30 ET, the two highest-importance rows of the week on the route that carries an importance field. State employment and unemployment for September at 10:00 ET, confirmed on the BLS primary and absent from the TradingView calendar entirely. Pending home sales 10:00 ET. 6-week bill, 95 billion, CUSIP 912797VA2.
Wednesday 21 October. Usual weekly earnings for Q3 at 10:00 ET, on the BLS primary and absent from both calendar routes. EIA petroleum status 10:30 ET. 17-week bill 11:30 ET. The 20-year reopening prices at 13:00 ET: 13 billion, CUSIP 912810UX4, term string 19-Year 10-Month.
Thursday 22 October. Initial claims 08:30 ET. Kansas City Fed indices 11:00 ET. The 5-year prices at 13:00 ET: fiscaldata returns one record, a nominal 5-Year NOTE at 26 billion, CUSIP 91282CRR4. One calendar route labels the same slot a 5-year TIPS auction with a previous of 1.955, which traces to a real 18 June TIPS reopening on the 4-Year 10-Month string. Publish the nominal note; a 5-year TIPS auction is NOT confirmed and is not published.
Friday 23 October. Flash PMIs 09:45 ET. Michigan final 10:00 ET.
What is NOT this week. No FOMC. The committee meets 27 and 28 October, two days, statement 14:00 ET on the 28th, press conference 14:30, and no projection round, all three confirmed from the Fed’s own October page. No CPI and no PPI inside any ten-session window from here, which is the gap that killed a shot candidate two editions running.
The auction run, and the trap inside it. The 20-year is auctioned monthly but the fiscal data API splits it across three term strings, 20-Year, 19-Year 11-Month and 19-Year 10-Month. Querying any one returns a quarterly series and silently understates the run. Blended chronologically, the most recent completed 20-year auction of any kind is 15 September at a 5.42 stop on a 2.57 cover, not July’s 5.163. A draft reading Wednesday’s reopening against the July 5.163 mis-states the comparison by 25.7bp. The 16 October 20-year CMT mark of 5.47% sits 5.0bp above September’s stop. On the 19-Year 10-Month string alone, seven observations give a mean cover of 2.726 in a 2.63 to 2.86 range, a mean dealer share of 11.25% and a mean indirect share of 67.50%, all derived against the competitive accepted base rather than the API’s own total, whose inflation ran a variable 0.92% to 13.07% across those seven.
No tail is obtainable on this route and none is published. The two CMT-versus-prior-stop figures, 20-year +5.0bp and 5-year -14.3bp, are not tails and must not be converted into tails.
The 5-year run is thinner and is declared as such: two covers in hand, 2.37 in August and 2.21 in September on a stop that rose 64.0bp between them. Per Lesson 38 that is not enough to characterise Thursday’s auction on its own run, and it is not characterised.
Divergence flags
- Equity volatility and rates volatility went opposite ways by 22.8 percentage points of change. The largest single divergence on the board and the reason no funding story is told.
- Hot import and export prices against a curve that richened at every tenor. Twenty-first consecutive instalment of the policy-transmission thread.
- Gold spot fell 0.069524% whilst December gold futures rose 0.263783%. The two legs went opposite ways, so the instrument label decides the direction of the sentence and not merely its magnitude. Any “bitcoin fell alongside gold” construction is true against spot and false against December futures.
- The two crude benchmarks stopped disagreeing and reversed. Friday’s December-to-December gap is -1.10839 percentage points with Brent ahead, against +3.160711 the session before on a November-WTI-to-December-Brent basis. On 16 October both legs rose, so last edition’s share-of-signed-move decomposition form is not defined and the only coherent form is share of combined absolute movement, and the basis must be named with it: on DOLLAR settlement changes, December Brent against the EXPIRING NOVEMBER WTI contract, 53.387534% and 46.612466%. On a December-to-December dollar basis the same shares are 60.990712% and 39.009288%. 🔴 Two front months in one sentence is how the Part 230 decomposition error would recur, so the basis is named or the figure is not published. It must never be written as “of the widening”.
- Nasdaq new lows beat new highs 119 to 33 whilst NYSE new highs beat new lows 58 to 38. The two exchanges disagreed on the sign of their own highs-and-lows measure whilst agreeing on the sign of advance-decline. This is the Part 225 thesis appearing on a measure that shot’s falsifier does not use.
- The semiconductor proxies diverged 0.733291 percentage points, the widest of four held observations against 0.311266, 0.525448 and 0.137948. Two proxies confirm direction and magnitude and never each other’s figure.
- Credit widened on a duration-adjusted read whilst every nominal price fell only marginally. Sign indicative, not established, for the reasons given above.
Carry-over note (§10.6)
Fires. The noteworthy thing is not that volatility rose. It is that volatility rose a fifth and could not persuade a single other instrument to agree with it. The gauge got to within half a point of the reading that distinguishes a solvency event from an expensive Friday afternoon, and then its own three-month leg declined to confirm. Markets were set up to deliver a funding scare and did not evidence one, with energy leading every sector and a majority of them higher. The tell was not the 22.31 intraday print. The tell was the 20.50 beside it.
Regime and sensitivity read (§17.3)
Weathervane: carried unchanged. §17.2 requires a pre-stated condition for a rewrite and none has been met. 🔴 The substance is now awkward for it a FOURTH consecutive session. Parts 228, 229 and 230 recorded the long end richening 5bp, then 3 to 4bp on hot CPI, then 9bp on hot PPI. This session the whole curve richened again on hot import and export prices, and the 20-year’s clearance over the 30-year narrowed from 5bp to 4bp whilst the 30-year itself printed 0bp. A thesis line asserting that the wind comes from the long end sits awkwardly beside a session in which the long end was the quietest part of the curve and the entire story was in equity volatility. That is a rewrite question and §17.2 makes the answer Phil’s.
Turn condition, unchanged: two sessions in which a dated Federal Reserve communication moves the 2-year by 10bp or more whilst the 30-year moves by less than half. Progress 0 of 2. Twenty-first consecutive non-advance, and inapplicable on the antecedent limb for a third consecutive edition: no Board governor prepared speech text exists for 16 October at all, established on two cache-busted reads of the authoritative path. The 2-year moved 3bp against a requirement of 10.
Regime flag: not tripped.
- Dollar non-response. NOT SCORED, nineteenth consecutive edition. The dollar fell 0.22058% on a session the 2-year moved 3bp, which the candidate as written cannot address. Its full condition text is still not carried in the live file.
- Rates-versus-energy inertia. RETIRED at Part 208. Eighteenth consecutive session of fresh evidence: crude added over 2.6% on both benchmarks whilst the whole curve richened on hot import prices.
- Volatility suppression. RETIRED at Part 207. Replacement two-sided leg now TWENTY-SIX editions overdue. 🔴 Vindicated a twenty-first time and this is the single clearest instance the file has ever produced: equity volatility rose 21.44593% whilst bond volatility FELL 1.351941%, and the volatility term structure compressed 0.084911 without inverting. A one-sided leg built for suppression sees none of that, and the suppression it was built to detect ended on Friday.
- Front end’s selective deafness. RETIRED at Part 207. Inapplicable rather than vindicated: the front end moved 3bp on the data, which is what the candidate’s absence would predict.
- Official demand fails at the long end. Counter 3, UNCHANGED. 🔴 The Part 209 ruling is now fourteen days past its deadline and twelve auctions have gone unscored. It matters in two days: the 20-year reopening prices Wednesday directly onto the tenor this thread tracks. Forward evidence is attached in the slate above.
- Term premium without a policy move. Counter 0. Applicable for a fourth consecutive edition and still unscoreable, no numeric threshold being carried in the live file.
- Proposed seventh candidate, from Part 230: an identical basis-point change at three or more consecutive tenors whilst the bill sector moves the opposite way. 🟢 Scored this edition and it did NOT fire, which is the useful result. The first limb is met, four tenors printing exactly -3bp with 1-year, 2-year and 3-year consecutive. The second limb fails: every bill tenor also richened, so the sectors moved the same way. A candidate that does not fire on a session built to look like the one that inspired it is a candidate with a real threshold, and that is more than two of the existing six can say.
Sensitivity read: running LOOSE, forty-second consecutive edition, stated openly rather than presented as neutral. The diagnosis remains specification rather than tuning.
🔴 And this edition sharpens it in an eighth consecutive way, with a genuinely new shape: the spine is a VOLATILITY TERM-STRUCTURE RELATIONSHIP and not one of the six candidates is pointed at the vol curve at all. Five of the six are rates or dollar candidates and the sixth is retired.
🔴 PROPOSED EIGHTH CANDIDATE, with a numeric threshold attached at proposal: the spot-to-three-month volatility ratio rising more than 0.070 in a single session without closing at or above 1.000. It would have fired on Friday at 0.084911 and fires nothing today. It needs two symbols, no duration figure, no positioning data and no flow series, which is the test the other six keep failing. The credit-versus-equity candidate proposed at Part 229 remains scoreable now the duration figures exist.
Specification lessons drafted this edition (§18)
Lesson 124: a decomposition whose legs carry opposite signs is arithmetically valid and editorially void, and the gate cannot tell the difference. The item P share figures must sum to 100 within 1e-6 and the Dow’s do, at -74.503651% and 174.503651%, because it gapped up 130.59 points and reversed. A share exceeding 100% is not a proportion of anything and a negative share is not a contribution. Rule: compute the decomposition on every index, and publish it only where the gap and the total share a sign. Where they do not, say the index gapped against its own close and give the two legs in points.
Lesson 125: a shot’s thesis can be confirmed on a measure its own falsifier does not use, and that is a specification failure rather than a lucky escape. Part 225 claims the two US exchanges are reading different tapes and scores it on advance-decline ratios straddling 1.000. On 16 October both ratios sat below 1.000, so the falsifier scored a non-event, whilst NYSE new highs beat new lows 58 to 38 and Nasdaq new lows beat new highs 119 to 33 at the same close. The thesis was vindicated on the highs-and-lows measure and invisible to the test. Rule: at filing, name every measure on which the thesis would show, and state which one the falsifier reads and why the others were rejected.
Lesson 126: the run must take the premarket capture before it dispatches anything, and “before the research agents” is not the same instruction. Part 229 recorded the fix as taking the capture directly and first. This run read the pre-flight, dispatched two lanes, and then waited forty-eight minutes on them before the capture was taken at 07:20 UTC against a 06:50 maturity point. No data was lost, a matured bar being settled history, and the two-read protocol passed on all four contracts. But the capture was late for the second consecutive edition and the cause was the same both times: the main thread had nothing to do whilst the lanes ran, and did nothing. Rule: the capture bar matures roughly twenty minutes after its open stamp, so the main thread’s first action after pre-flight is a timed wait to that point and the capture, and only then the dispatch.
Drift gate (§11.9.1), both limbs
Limb one, price distance. Six keys re-quoted immediately before delivery at 07:55 UTC. Largest move minus 0.25% on December NQ. ZERO keys over the 2% refresh threshold. The spine is a settled prior-session official close and cannot drift.
Limb two, distance to a specification threshold. The house practice adopted at Part 229 and still not written into the spec. December Nasdaq futures sit 0.373696 percentage points clear of the §8.5 1.0% trigger and 0.126304 short of the 1.5% lead threshold. 🔴 AND IT FIRED THIS EDITION, WHICH IS THE PART 219 FINDING ARRIVING IN PRACTICE RATHER THAN IN PRINCIPLE. Between the 06:30 UTC capture and the 07:55 UTC re-quote December NQ drifted only -0.257728 percentage points on price, comfortably inside the 2% gate, whilst its clearance of the §8.5 1.0% trigger NARROWED from 0.373696 to 0.115969 percentage points and its shortfall to the 1.5% lead threshold WIDENED from 0.126304 to 0.384031. A further 0.116 point move deletes the Overnight Excitement section and the price gate cannot see it. December ES fell from 0.736606% to 0.554889% and has crossed INSIDE the roughly 0.6% normal premarket envelope, so its own soft-trigger leg has lapsed; the prior-session leg at -1.113464% is unchanged and the soft threshold stands on that leg alone. Handling, per the Part 219 precedent: the section is KEPT and the copy in AntiVestor Edge, Inside Edge and this file is requalified with the re-quote rather than left to imply the gap persists. Separately, the volatility ratio sits 0.024878 below the 1.000 inversion reading, which is the most consequential threshold distance in the edition because the whole argument turns on it, and it cannot drift: both legs are settled closes.