Why Premium Poppers Print: The Math Nobody Teaches Retail
 Ahoy there, Trader! ⚓️
It’s Phil…
Walk into any trading forum, scroll any finance Twitter feed, flick on one of those breathless morning shows where glossy-haired nobs in ties shout over each other between advert breaks, and you’ll find the same job being done badly by thousands of people at once. They’re trying to pick the winner. They want to know whether SPX goes up or down tomorrow. They want the right indicator, the right setup, the right guru wearing the right waistcoat. They want the little buzz of calling the move before it happens so they can tell someone about it on Monday.
This is why most of them lose money.
The people who actually make a living from markets are not tipsters. They are bookmakers. A bookmaker doesn’t pick the winner of the race. He doesn’t care who wins. His job is to balance a book across the entire field so that whatever horse comes in first, the total he pays out is less than the total he takes in. The overround. The vig. The margin baked into the odds. That is his edge. The winner is irrelevant.
I don’t need my horse to win the race. I just need to not lose.
That one sentence, if you let it properly sink in, tells you more about professional trading than most retail traders will pick up in five years of watching the talking-head circus. Everything else in this piece is the maths that makes it work, and why the people peddling predictions on your screen every morning are selling you the wrong product entirely. If you already suspected that, good. You’re halfway there. If you didn’t, read on. We’ll sort you out.
Get The Complete Premium Popper System – Automation Included
Your entry ticket to consistent SPX income. Inside: the exact setup, rules, and checklists I trade daily – for less than the cost of lunch. Easily actionable.
Get The Premium Popper System – Click Here

The Prediction Trap
Here’s the lie that nobody selling you a newsletter, a course, or a moody YouTube thumbnail with a red arrow and a three-exclamation-mark headline wants you to think about too hard.
Prediction is not a product that makes money. It’s a product that sells.
Those are two very different things. A good prediction is exciting. It’s shareable. It makes for a satisfying tweet when it comes in, and a quiet deletion when it doesn’t. It gives the predictor a story to tell and the follower a reason to keep watching. The entire ecosystem of trading media, from the morning shouters to the chart-line-drawing oracles on YouTube to the LinkedIn lads with the brushed-cotton polos and the “I called this two weeks ago” screenshot, exists because prediction scratches an itch that has absolutely nothing to do with your P&L. It scratches the ego.
The itch is this. Being right feels good. Being right in public feels even better. Being right in public while everyone else was wrong feels like a drug, and there is an entire industry willing to sell you the needle as long as you keep the subscription renewing.
Now look at the maths of what prediction actually requires. To make money by predicting SPX, you have to be right about three things at the same time. You have to call the direction. You have to call the timing. You have to call the magnitude. Miss any one and the trade loses, even if you were broadly right about the other two. Call it up, it goes up, but it goes up next Tuesday instead of today, and you’re toast. Call it up, it goes up today, but half as much as you needed, and you’re toast. Three independent judgements, all of which have to land, on an instrument priced by a market full of people smarter, faster and better capitalised than you are.
And you’re planning to do that how often? Reliably? For years? Against algorithms that pick off your orders before you’ve finished refilling the kettle?
Come on.
The honest answer, the one the talking heads will never admit because it would put them out of a job, is that nobody does this consistently. Not them. Not you. Not the bloke with the fedora and the nine-screen setup in his bedroom. The people who sound the most certain are usually the ones with the most need to sound certain, because certainty is what their business model sells. The actual professionals, the ones managing real capital with real consequences, would rather eat their own hat than make a public prediction on tomorrow’s close. They know the game isn’t prediction. The game is price.
Which brings us neatly to what the bookmaker is doing while the punters are busy arguing about the winner.
What the Bookmaker Actually Does
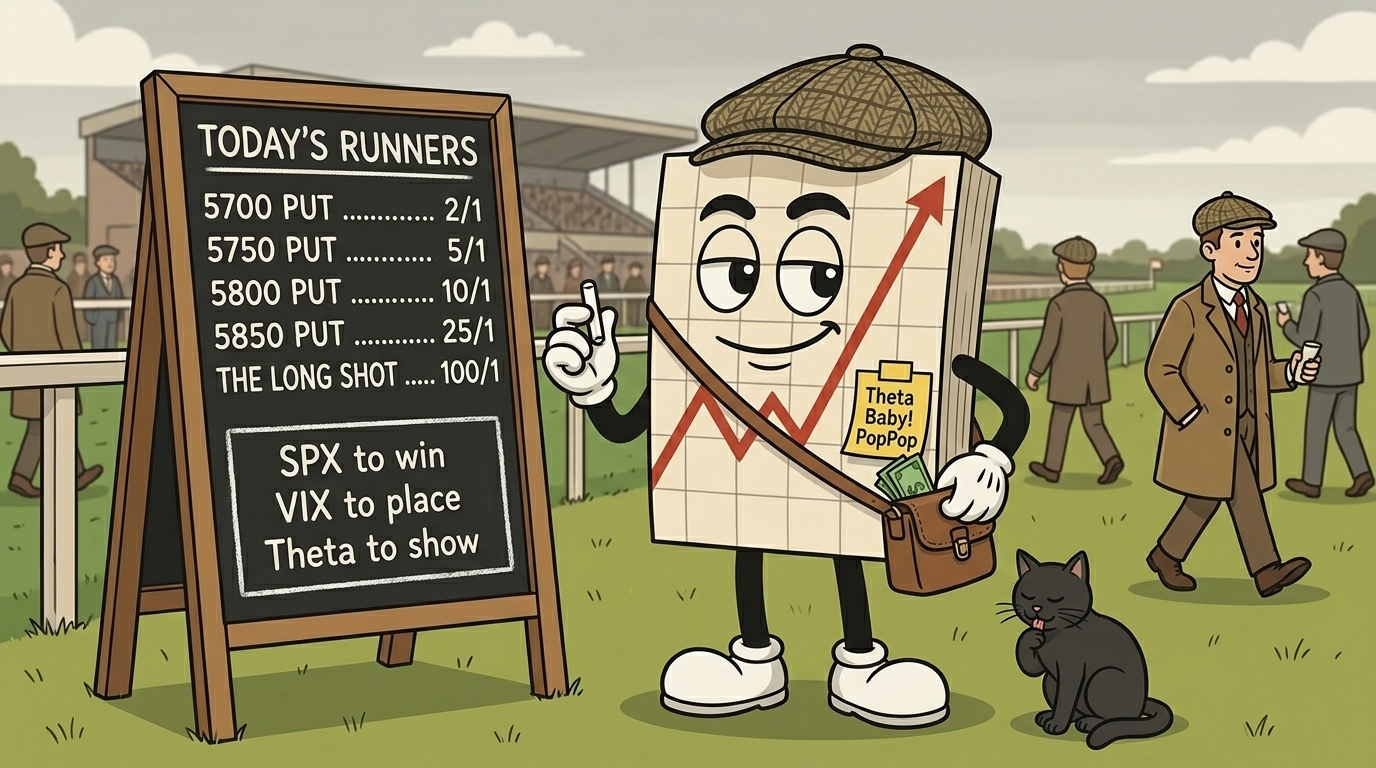
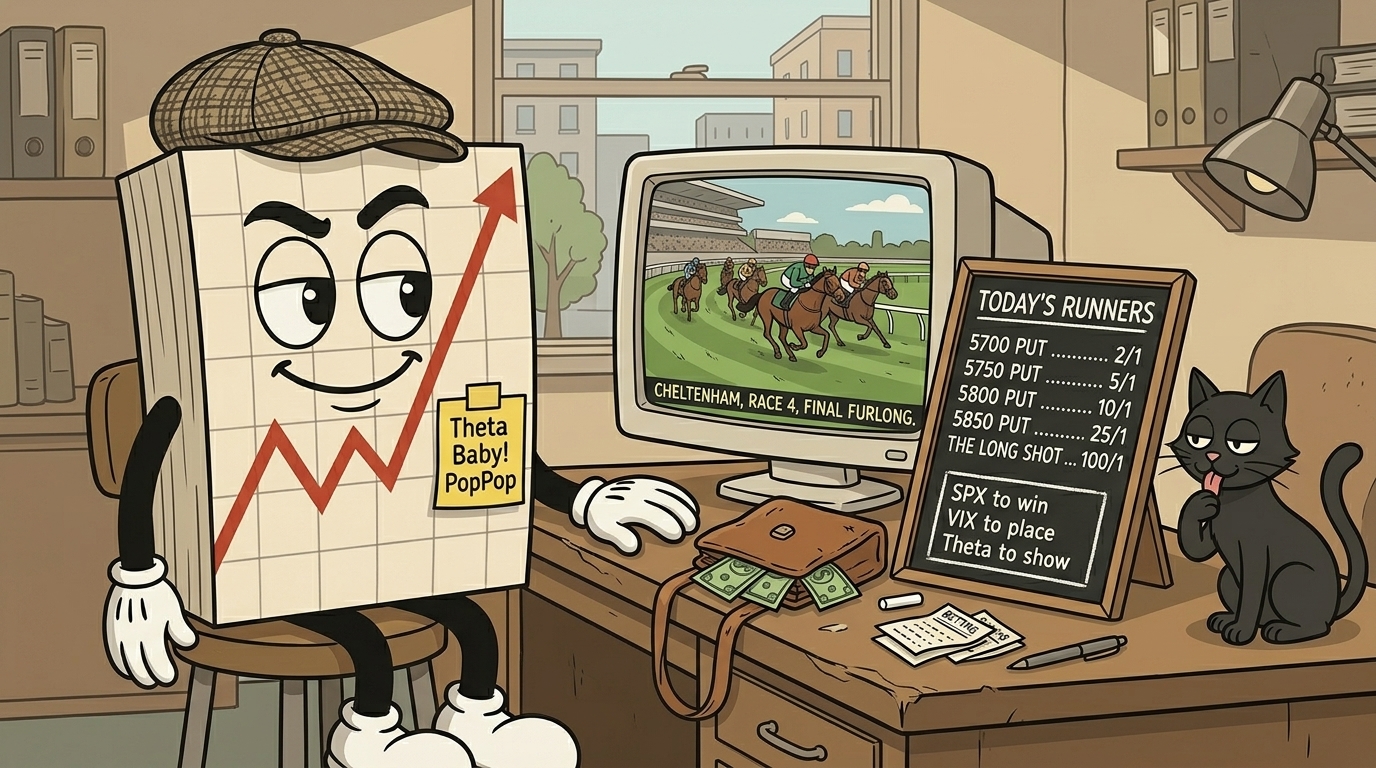
Picture a Saturday afternoon, Cheltenham, eight horses in the field, a bookmaker stood behind his board with a chalk stub and a satchel full of other people’s money.
He is not picking the winner. He is not studying form. He has a view, sure, somewhere in the back of his head, but it’s not the view that pays his mortgage. What pays his mortgage is the book.
Here’s how it works, stripped back to the bone.
For every horse in the race, the bookmaker quotes odds. Those odds imply a probability of winning. Add up the implied probabilities across all eight horses and you’d expect them to sum to one hundred percent, because one horse has to win. But they don’t. They sum to something like one hundred and fifteen percent. That extra fifteen points is the overround. The vig. The margin. The bit that makes the whole operation profitable regardless of which horse comes in first, provided the book is balanced properly across the field.
Balanced how? By how much money he takes on each horse, at what odds. If too much money piles onto the favourite, he shortens the odds on the favourite and lengthens the odds on the rest to pull punters elsewhere and spread his liability. He’s not guessing. He’s managing a distribution of outcomes so that when the race is run, whatever happens, the payout he owes is less than the stakes he collected.
Read that again. Whatever happens.
The bookmaker does not care which horse wins. He cares that his book is priced with a margin and balanced across the field. He cares that he’s taken enough bets that the law of averages does its job. He cares that no single race can wipe him out, which is why he lays off the really lopsided exposures to other bookmakers rather than carry them himself.
That is the entire business. Overround. Balance. Volume. Survive.
Now, three things are worth noticing before we move on, because they’re the exact three things the SPX premium seller is doing, just with different props.
- The bookmaker’s edge is mathematical and baked into the price before any horse runs. He doesn’t earn it by being clever on race day. He earns it by pricing the odds correctly on Friday night.
- He profits across many races, not one. A single race is a coin flip for him if the book isn’t balanced. A thousand races is a business.
- He caps his downside. No bookmaker worth the name lets a single punter walk in with a bet that could break him. Position limits, lay-offs, staking plans. Survival is the first rule. Profit is the reward for surviving long enough.
Hold those three points in your head. Overround, volume, survival. Because we’re about to walk them straight across to SPX, and you’re going to see that the game you thought was about predicting the market is actually a game that already has a professional version sitting right there in plain sight, waiting for you to stop trying to pick horses and start taking bets instead.
The SPX Seller Is a Bookmaker
Strip the horses out. Strip the chalk board out. Keep the maths.
The SPX options market is a book. Every strike price is a horse. Every premium quoted is an odd. The punters piling in are the option buyers, each one convinced their horse is going to come steaming down the finishing straight with lottery money strapped to its back. On the other side of the window, taking the bets, writing the tickets, sleeping soundly at night, is the premium seller.
That’s you. Or at least, that’s what you’re going to be by the end of this piece.
Let’s map the three points across properly, because this is where the penny either drops or it doesn’t.
Overround becomes the volatility premium.
The bookmaker’s edge is baked into the odds before the race runs. The SPX seller’s edge is baked into the option price before the market opens. It’s called the volatility risk premium, and it’s one of the most stubbornly persistent anomalies in modern finance. Implied volatility, the volatility priced into SPX options, runs systematically higher than the volatility the market actually delivers. Year after year. Decade after decade. The spread between what buyers pay for protection and excitement, and what the market eventually serves up, is the overround. It’s the vig. It’s the margin the house collects for standing behind the window and taking the bets.
Why does it persist? Because people pay a premium for insurance and lottery tickets. Always have, always will. Fund managers buy puts for downside protection the way homeowners buy flood cover. Retail punters buy calls because turning fifty quid into five thousand is a better story than turning fifty quid into fifty-five. Neither of them is shopping on price. Both of them are paying the overround, and the seller on the other side collects it.
Balance becomes spread construction.
A bookmaker who takes one enormous bet on one horse is not a bookmaker. He’s a gambler with a chalk board. He balances exposure across the field.
The SPX seller does the same job with defined-risk spreads. You don’t sell a naked option and hope. You sell a vertical, a condor, a structured position where the maximum loss is known, capped, and paid for on day one by the premium you collected. You’ve balanced the book. Whatever SPX does, whatever horse comes in, the worst case is bounded. You sized the bet to fit the book, not the dream.
This is the bit that separates the professional from the gambler, and it’s the bit that Shmuts-style pieces on probability trading tend to skate past, because unbounded downside is the single biggest objection retail has to premium selling. Defined-risk structures put that objection in the ground. If your maximum loss is the width of the spread minus the credit received, and you’ve sized the position so a max loss on a single trade is a rounding error, you have already out-thought ninety percent of the people currently losing money trying to pick direction.
Volume becomes sample size.
A bookmaker doesn’t care about one race. A bookmaker cares about a thousand races. The edge is tiny on any individual bet. It’s the repetition that turns the edge into a business.
The SPX seller lives by exactly the same rule. One credit spread is a coin flip with better-than-fair odds. A hundred credit spreads, taken systematically, correctly sized, with the overround on your side, is a P&L curve that looks like a staircase with the occasional tumble. Three hundred of them and the maths has properly done its work. More on that when we get to the Law of Large Numbers, because it’s the single most misunderstood idea in retail trading and it deserves its own section.
Survival becomes position sizing.
No bookmaker worth the name lets a single race break him. No SPX seller worth the name lets a single spread break them either. The whole game is built on being there for the next trade, and the one after that, and the thousand after those. Everything we cover in the risk-of-ruin section later exists to answer one question. How do you make sure you are still in business next year?
Because the maths, as we’re about to see, is ruthlessly clear on this point. The edge is real. The overround is real. The volatility risk premium is real and it’s been paying people who know how to collect it for decades.
But none of that matters if you get taken out in month three.
The bookmaker knows this in his bones. By the end of this piece, so will you.
Expected Value: The Only Number That Matters
If you take one thing from this piece and chuck the rest in the bin, take this.
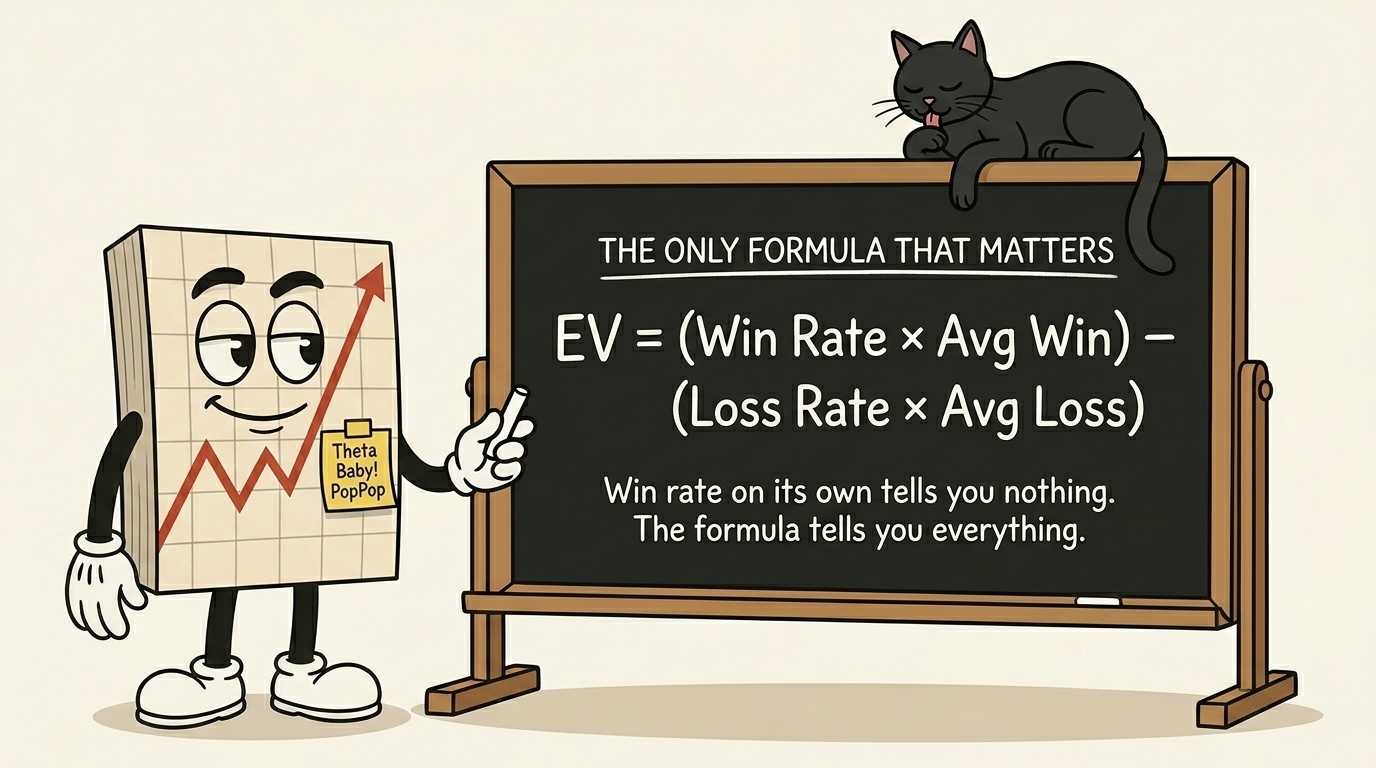
Expected Value = (Win Rate × Average Win) − (Loss Rate × Average Loss)
That’s it. That’s the formula. Five variables, one subtraction, and everything in professional trading either bends the knee to it or quietly starves to death. Scalpers with a ninety percent hit rate ignore it and blow up. Options sellers who respect it make a living for decades. The formula doesn’t care about your waistcoat, your setup’s name, or how confident you sounded on the podcast last week. It just does the sum.
Let’s walk it through with a proper SPX credit spread, not a hand-wavy generic example, because you deserve to see the numbers you’ll actually be looking at.
The setup
You sell an SPX put credit spread. You short a put ten points out of the money and buy a put twenty points out of the money as your protection. The width of the spread is ten points. On SPX, ten points is ten times a hundred dollars, so your maximum loss before the credit is one thousand dollars. You collect a credit of three hundred dollars for taking the bet.
Your numbers look like this.
- Maximum profit per trade: $300 (the credit)
- Maximum loss per trade: $1,000 − $300 = $700 (the width minus the credit)
- Win rate you’ve observed over three hundred trades: 75%
- Loss rate: 25%
Plug it in.
- EV = (0.75 × $300) − (0.25 × $700)
- EV = $225 − $175 = $50 per trade
Fifty quid, give or take, per spread. Doesn’t sound like much. It isn’t, on a single trade. It’s a rounding error. A tip. A coffee and a croissant if you’re feeling fancy.
Now do what the bookmaker does. Multiply by volume.
Two spreads a week, fifty weeks a year, is a hundred trades. A hundred trades at fifty dollars expected value is five thousand dollars. Four spreads a week is ten thousand. Sustained over a decade, properly sized, properly risk-managed, that is the boring little engine that funds retirements.
Not the home run. Not the moonshot. The engine.
The thing most retail traders get catastrophically wrong
Look at the numbers again. Win rate seventy-five percent. Average win three hundred dollars. Average loss seven hundred dollars. The losses are more than twice the size of the wins.
A retail trader sees that and panics. Seven hundred! Twice the win! This is insane, I’d lose my shirt!
No, you wouldn’t. Because you’re winning three times as often as you’re losing. The maths of the distribution does the work. The bookmaker doesn’t care that one horse pays out big if eight others don’t pay out at all. The net result across the whole book is what matters.
The mirror-image mistake is even more common, and it’s the one that destroys scalpers. They brag about a ninety percent win rate. They post the screenshots. What they don’t post is the average loss to average win ratio. If you win nine times at twenty quid a go, and lose once at three hundred quid, you’ve netted negative one-twenty across ten trades, congratulations, your ninety percent win rate is a loss-making business. I have watched this exact mistake blow up more accounts than I can count, and every single one of those traders was genuinely convinced they had an edge because the win column was green most of the time.
Win rate on its own tells you nothing. The formula tells you everything.
The three levers
There are precisely three things that determine whether your SPX selling business is profitable.
One. The win rate, which is set by how far out of the money you sell your spreads and how you manage them.
Two. The average win, which is set by the credit you collect, which is set by the volatility environment and your strike selection.
Three. The average loss, which is set by your stop-loss discipline, your spread width, and your willingness to close a trade when the maths has stopped working.
Pull those three levers well, and EV goes up. Pull them badly, and it goes down. That’s it. That’s the whole game. Everything else (the indicators, the fancy charts, the Discord chat rooms full of emojis, the vibes) is noise layered on top of these three numbers.
If you’re not tracking your win rate, your average win, and your average loss across every setup you trade, you don’t have a trading business. You have a hobby with a brokerage account. And hobbies, as any accountant will cheerfully tell you, are a cost centre, not a revenue line.
Law of Large Numbers: Why One Hundred Trades Tells You Nothing
Flip a coin ten times. Count the heads.
You might get five. You might get seven. Once in a while you’ll get nine, and if you’re the sort of person who believes in signs, you’ll tell your mates down the pub that you’ve got a lucky hand with coins.
You haven’t. The coin is fine. You’ve just run a sample size too small to mean anything.
Now flip the same coin a thousand times. Count the heads. You’ll get something very close to five hundred. Not exactly five hundred. Maybe five-oh-six, maybe four-ninety-two. But close enough that you can say, with proper statistical confidence, that this coin is fair and the universe is behaving itself.
That, in one paragraph, is the Law of Large Numbers. The bigger the sample, the more your actual results converge on the true probability. It’s not a trading concept. It’s not even a finance concept. It’s a mathematical law, proven and re-proven for three hundred years, and it is the single most ignored idea in retail trading.
Here’s why it matters to you.
Your edge doesn’t exist until the sample size proves it does
You’ve built an SPX credit spread setup. You’ve back-tested it over thirty trades. Twenty-two winners, eight losers. Looks brilliant. You go live, take twelve more trades, end up nine-and-three. Now you’ve got a thirty-four-and-eleven record across forty-five trades. Seventy-five percent win rate. You tell your mates down the pub that you’ve cracked it.
You haven’t. You might have. But you haven’t proved it yet. Forty-five trades is nowhere near enough data to distinguish a real edge from a lucky streak. Forty-five coin flips could land thirty-four heads on a fair coin and nobody in statistics would blink. The Law of Large Numbers says your true probabilities only emerge over a proper sample, and the maths of a ninety-five percent confidence interval on a sixty-to-seventy-five percent win-rate setup puts that number somewhere between three hundred and four hundred trades.
Three hundred. Minimum. Before you can look at your win rate and trust it.
Which means one of two things
Either your setup triggers often enough to clock three hundred trades in a reasonable time frame, say a year or two of consistent trading, or it doesn’t, and you’re flying on vibes for the best part of a decade before the maths has any chance of catching up with you.
This is the quiet reason why premium selling on SPX beats most retail strategies before the bell even rings. A setup that triggers two or three times a week crosses three hundred trades in under a year. By the time you’ve been at it eighteen months, the maths has properly spoken. You know whether your edge is real or whether you’ve been kidding yourself. Compare that with some beautiful, elegant swing-trade setup that fires four times a year. Three hundred trades at four per year is seventy-five years of patient waiting. Seventy-five years. By the time you’ve validated it, you’re dead, your kids are middle-aged, and the market has mutated into something your setup was never designed for.
Frequency is not glamorous. But frequency is how the maths earns its keep. The boring, repeatable, high-frequency setup beats the rare, exciting, low-frequency one every single time, because only one of them lets the Law of Large Numbers do its job inside a human lifespan.
The variance trap
Here’s where it gets properly dangerous.
Somewhere in the middle of your sample size, between trade fifty and trade two hundred, you are going to hit a losing streak that feels like the end of the world. Five losers in a row. Maybe seven. Maybe the whole of March looks like a bloodbath on your equity curve. You will sit there with a cup of tea going cold beside the keyboard, staring at the screen, and a voice in your head will say the thing the voice always says.
It’s broken. The setup doesn’t work. The market has changed. Stop.
That voice is wrong. It is almost always wrong. A setup with genuine positive expected value will, across its lifetime, throw up losing streaks that look identical to a broken setup. You cannot tell the difference by looking at them. The maths is clear on this. Variance, which we’ll get to properly in its own section, produces streaks that feel catastrophic inside a small sample and are statistically routine inside a large one.
The trader who listens to the voice, abandons the setup, switches to a new one, and starts the sample size counter back at zero is the trader who never, ever gets to three hundred. They spend their entire career in the first fifty trades of setup after setup, never staying long enough for any of the maths to speak. They are, functionally, running a permanent beta test on themselves, and the product never ships.
The consistency rule that nobody wants to hear
Every time you take a trade that breaks your rules, you contaminate your sample. Every time you size up because you’re “feeling it,” you contaminate your sample. Every time you skip a valid setup because you’re nursing yesterday’s loss, you contaminate your sample.
The scientist running an experiment doesn’t get to change the variables halfway through and still claim the result is valid. Nor do you. The data you collect only means something if you collected it under the same rules, trade after trade, week after week, through the wins and the losses and the days when you really, really don’t feel like taking the trade.
This is why algorithmic trading ate institutional finance in twenty years flat. Not because the algos are cleverer than the humans. The algos are often quite stupid, frankly. They ate the lunch because they never break the rules. They never skip a trade because they’re hungover. They never double up because Uncle Bob said the Fed’s about to cut rates. They take the trade, every time the setup triggers, exactly the way it was designed, and they let the sample size do the work.
You are not an algorithm. But you can borrow the discipline. And if you can, you will get to three hundred trades with a clean data set, and at trade three hundred and one you’ll know, for the first time in your trading life, whether the thing you’re doing actually works.
Most retail traders never get there. Not because the maths is hard. Because the patience is.
The Gambler’s Fallacy: The Market Does Not Owe You
Five losers in a row. You’re sat there, account bruised, ego bruisier, and a very particular thought arrives uninvited.
I’m due a winner.
No. You aren’t. The market doesn’t owe you anything. It doesn’t know you exist. The spread you’re about to place has no memory of the five that came before it. Each trade is an independent event with the same expected value it always had, and the universe is not keeping a tally of your suffering with a view to making it up to you on the next one.
This is the Gambler’s Fallacy, and it’s the single most expensive cognitive bug in retail trading.
It looks innocent. It sounds almost reasonable. After all, if a coin lands heads five times in a row, tails “feels” more likely next, doesn’t it? No. The coin has no clue. The probability of tails on flip six is exactly fifty percent, same as it was on flip one, same as it will be on flip ten thousand. The previous flips are information about the coin’s fairness, not predictors of the next outcome.
Where it gets properly dangerous is the behaviour it produces. The trader who believes they are “due” does three things, in order, and all of them are catastrophic.
First, they size up. If you’re due a winner, why not press a bit harder on this one? Recover the losses faster. Double up. Make the maths work in one go instead of dragging through another week of small spreads. This is the moment the risk-of-ruin calculations we’re about to walk through stop being academic and start being a eulogy.
Second, they loosen the rules. The setup doesn’t quite trigger cleanly, but it’s close, and after five losers you need a winner, so close is close enough. Now you’re not running your setup anymore. You’re running your mood.
Third, they chase. A trade that doesn’t come to them fast enough, they go and find one. A setup that’s sat on the bench for two days looking fine, they skip it in favour of something more exciting, because patience is for people who aren’t due a winner. Every one of these behaviours sounds, in the moment, like recovery. Every one of them is actually escalation dressed up as recovery.
Now hold that thought next to the Law of Large Numbers from the last section, because this is the knife-edge the whole piece turns on.
The Law of Large Numbers tells you your edge will emerge over a sufficient sample. It is a statement about the long run, with the quiet caveat that you have to be in the long run to benefit from it. The Gambler’s Fallacy is the exact opposite. It tells you the next trade is special, that recent history has tilted the odds, that now is the moment to press. Believe the first and you get rich slowly. Believe the second and you get poor quickly, and you do it while feeling, right up until the account hits zero, like you’re being clever.
The bookmaker does not believe he is due. The bookmaker had a bad Saturday at Cheltenham, shrugs, pours a brandy, and opens the book again on Sunday with the exact same margins priced in. He doesn’t press. He doesn’t chase. He doesn’t size up because last week was rough. He keeps taking bets at the right odds, in the right volume, with the right margin, and he lets the maths come to him.
That is the whole discipline. In one paragraph. Tattoo it somewhere you’ll see it.
Risk of Ruin: The Maths of Not Blowing Up
Here’s a thing most retail traders never compute, because the answer tends to ruin their day.
What is the mathematical probability that you lose your entire account before your edge has a chance to work?
Not “do badly for a quarter.” Not “hit a rough patch.” Actually, properly, account-at-zero, broker-closing-the-relationship, tell-your-spouse-about-it-over-the-weekend lose the whole lot. That probability has a name. It’s called Risk of Ruin, and it is the single most sobering number in trading mathematics once you sit down and actually work it out.
Every trading setup with a positive expected value still has a non-zero Risk of Ruin. Always. The maths guarantees it. You can have the best edge in the game, bookmaker-grade vig on every trade you take, and if you size the bets badly enough, variance will find a way to take you out before the edge has a chance to compound. The professionals know this in their bones. The retail trader almost never does.
Let’s make it concrete.
The setup we’re testing
Take a solid SPX credit spread strategy. Fifty-five percent win rate, one-point-five-to-one average reward-to-risk ratio, ten-thousand-dollar account. This is a genuinely profitable setup with positive expected value. The maths is working for you.
Now let’s see what happens to your chances of survival at different position sizes.
- Risk one percent per trade ($100 risk)
Risk of Ruin comes out at something so small the calculator starts rounding it away. Near-zero. You could trade this setup for a thousand years and the maths says you would not blow up. This is the professional zone. This is where the grown-ups live.
- Risk five percent per trade ($500 risk)
Risk of Ruin is around three-thousandths of a percent. Still very low, but notice what just happened. You multiplied the position size by five and the Risk of Ruin went up by several orders of magnitude. The relationship is not linear. It is brutally exponential. Every extra point of risk-per-trade you take on compounds the survival penalty at a rate most traders fundamentally don’t understand until it’s too late.
- Risk ten percent per trade ($1,000 risk)
Risk of Ruin climbs to about zero-point-zero-three percent. Reads low. Sounds manageable. It isn’t. And here’s where the maths and the real world start to part ways, because the formula assumes your win rate holds exactly, your reward-to-risk stays exactly one-point-five, and nothing about the market regime ever changes. None of those assumptions survive contact with a real trading year. In reality, at ten percent risk, a run of ten losers (which variance will cheerfully deliver to you at some point) takes you from ten grand to under three-and-a-half. The account isn’t technically ruined. It’s just wounded so badly that the compounding maths we’ll cover next section says you now need a hundred-and-eighty percent gain to get back to where you started. Functionally ruined. Practically ruined. Ruined in every way that matters except the one the formula bothers to measure.
- Risk twenty percent per trade ($2,000 risk)
Risk of Ruin is now nearly six percent. Six. Percent. Read that again. If a hundred traders ran this setup at this position size, six of them would be broke within the lifespan of the sample. And that’s the optimistic reading, because the formula doesn’t account for model errors, regime shifts, or the trader doing something stupid under pressure. The real number is worse.
What the table tells you
Four-tiered risk progression, one percent to twenty percent, and the Risk of Ruin moves from effectively zero to actively dangerous. Same setup. Same edge. Same win rate. The only thing that changed was the size of the bet, and the size of the bet was the thing that decided whether you had a career or a cautionary tale.
The bookmaker knows this by instinct. He doesn’t need the formula. He has centuries of industry wisdom baked into the staking plans at the betting window, and every one of those plans exists to make sure that no single punter, no single race, no single bad Saturday can take him out. The size of any individual bet is always small relative to the book. Always. It’s not a preference. It’s the entire business model.
The Kelly Criterion, and why full Kelly will eat you alive
There is a formula, developed at Bell Labs in the fifties by a bloke called John Kelly, that tells you the mathematically optimal fraction of your capital to risk on each bet to maximise long-run growth. It’s genuinely beautiful maths. Economists love it. Probability theorists have written entire books about it. And if you run your real trading account at full Kelly, you will almost certainly blow it up inside two years.
The problem isn’t the formula. The formula is correct. The problem is that the formula assumes you know your true win rate and true reward-to-risk ratio with perfect precision, and you don’t. Nobody does. You have an estimate, and your estimate is almost certainly optimistic, because humans over-remember their winners and under-weight their losers. Full Kelly on an overestimated edge is a wood-chipper.
Which is why serious practitioners use what’s called Half Kelly or Quarter Kelly, a conservative fraction of the calculated amount, or more commonly just a flat one-to-two percent per trade regardless of what the formula spits out. Not because the maths is wrong. Because the inputs to the maths are human, and humans are optimists.
If you remember nothing else from this section, remember this. One to two percent of account risk per trade, maximum. Every experienced trader I’ve ever spoken to, the kind of people with fifteen-plus-year track records and actual money under management, sizes somewhere in this range. The ones who don’t, aren’t around anymore to tell you about it.
The survival rule, plain as it gets
Amateurs think about how much they can make. Professionals think about how much they can lose.
That’s the entire shift between the two, compressed into a sentence. The bookmaker thinks in terms of exposure, not upside. The premium seller who lasts is the one who asks, of every position, “if this goes maximally wrong, can I still be here on Monday?” If the answer is no, the position is too big. If the answer is barely, the position is too big. If the answer is easily, you’re in the right zone.
Because the maths of the edge is ruthlessly clear, as we’ve seen. The volatility risk premium is real. The overround on SPX options is real. The Expected Value calculation on a well-constructed credit spread is positive, persistent, and payable for anyone patient enough to collect it.
But none of that helps you if you’ve already handed your account back to the market because you wanted to get rich this quarter instead of rich this decade.
Survival first. Profit is the reward for surviving long enough.
Variance: Why Your Equity Curve Lies to You
Here’s a truth that every professional trader has learned, usually the hard way.
Your equity curve will lie to you.
Not deliberately. Not maliciously. But it will, at some point in every honest career, tell you your setup is broken when it isn’t. It will tell you you’re on fire when you’re not. It will present a stretch of randomness as if it were a signal, and most traders, being human, will read the signal and act on it.
The thing dragging the curve around on any given week is rarely the edge. It’s variance.
What variance actually is
Variance is the noise in the data. It’s the dispersion of your individual trade results around your average. A setup with a fifty-dollar expected value per trade does not deliver fifty dollars, trade after trade after trade. It delivers plus two hundred, minus one-twenty, plus three-fifty, minus eighty, minus minus two-fifty, plus one-ten, and when you add it all up over a sufficient sample it averages to about fifty dollars per trade.
The per-trade result is the noise. The average is the signal. And the human brain, which evolved to spot predators in long grass rather than probability distributions on spreadsheets, is catastrophically bad at telling them apart.
Standard deviation is the number that measures how spread out that noise is. A setup with a low standard deviation feels smooth. The equity curve looks like a gentle staircase. A setup with a high standard deviation feels like a rollercoaster even if the expected value is identical. Same edge. Same destination. Very different emotional experience getting there.
The range you should be expecting
The statistics on this are tidy enough to be useful.
For any setup with a given average and standard deviation, you can expect results to fall within one standard deviation of the average about sixty-eight percent of the time. Within two standard deviations, about ninety-five percent. Within three, about ninety-nine-point-seven.
In plain English. If your setup typically makes two percent a month with a standard deviation of four percent, you should mentally prepare for the following. Most months will land between minus two percent and plus six percent. That’s your normal. One month in twenty, the result will be worse than minus six percent, or better than plus ten percent. That’s still inside the range of “completely expected.” And roughly once every several years, you will have a month so catastrophic or so glorious that it falls outside three standard deviations, and even that is not evidence of anything being broken. It’s evidence of you having sufficient sample size to finally see the tails of the distribution.
Read that paragraph twice. It will save you from quitting a profitable setup.
The quitting point
Most retail traders abandon a good setup somewhere between the second and fourth month of a losing stretch. This is not a coincidence. It’s the shape of variance itself.
Inside the first hundred trades of a setup, a string of six, seven, eight losses in a row is not merely possible. It’s expected. A setup with a seventy-five percent win rate will, across its lifetime, produce a losing streak of five-plus roughly one time in every hundred-ish trades. Not rare. Routine. And every single time it happens, the trader’s brain does the same thing.
This time it’s different. This time the setup is actually broken. The market has changed. My edge is gone.
Sometimes that voice is right. Markets do change. Edges do decay. Regimes do shift. But the voice is right maybe one time in twenty. The other nineteen times, it’s just the human brain trying to find a pattern in noise and then persuading you to act on the pattern. And the trader who listens, who quits, who rotates to the next shiny setup, resets the sample size counter to zero and never, ever accumulates enough data to distinguish the real signals from the fake ones.
The bookmaker does not quit the book after a bad Saturday. He expects bad Saturdays. They’re built into the pricing. He keeps the book open, keeps the margins honest, and waits for the next Saturday, which might be a good one, might be another bad one, but across the season will average out to profitable.
What you actually do about it
Three things, in practice.
Track your standard deviation. If you know your setup’s typical dispersion, you can tell at a glance whether this week’s drawdown is normal or genuinely anomalous. A five percent drawdown when your standard deviation is four percent is statistically boring. A five percent drawdown when your standard deviation is one-and-a-half percent is a signal worth investigating.
Rolling windows beat lifetime averages. Calculate your standard deviation over the last thirty to fifty trades, not the last five hundred. Markets change slowly. Your recent behaviour tells you more about current conditions than the cumulative data does.
And when a drawdown hits, the question is never “should I quit the setup?” The question is “is the current drawdown inside my expected range, or outside it?” If it’s inside, keep trading, same size, same rules. If it’s outside, reduce size, investigate, and do not touch the rules until the investigation is done.
That is the whole discipline. Believe the maths, mistrust the feeling, and let the variance do what variance does.
The Compounding Asymmetry: Why a Ten Percent Loss Is Not a Ten Percent Problem
Most traders, when they hear “I lost ten percent this month,” assume they need to make ten percent next month to get back to where they started.
They don’t. They need more. And the bigger the loss, the worse the maths gets, in a way that is genuinely unfair and almost nobody properly internalises until they’ve had it happen to them.
Let’s do the sum.
You start the month with ten thousand pounds. You lose ten percent. You now have nine thousand pounds. To get back to ten thousand, you don’t need a ten percent gain on the nine you’ve got left. You need eleven-point-one percent, because eleven-point-one percent of nine thousand is one thousand, which gets you back to flat.
Sounds pedantic. It isn’t. It’s the hinge the whole compounding argument turns on.
Now scale it up.
- A twenty-five percent loss needs a thirty-three percent gain to recover. Ten grand drops to seven-and-a-half. A third of seven-and-a-half is twenty-five hundred. You need a thirty-three percent gain on the reduced base to climb back to your starting figure.
- A fifty percent loss needs a one hundred percent gain to recover. This is the one that stops people in their tracks. You’re down to five thousand. To get back to ten, you need to double the account. A hundred percent gain. On a ruined base. While trading the same market that just took half your money off you.
- A seventy-five percent loss needs a three hundred percent gain to recover. Ten grand down to two-and-a-half. To climb back, you have to quadruple the survivors. Most traders who get here do not, in fact, recover. They close the account and take up gardening, which, in fairness, is probably the right decision.
The maths is ruthlessly one-sided. Small losses are recoverable. Medium losses are expensive. Large losses are, in practical terms, career-ending, because the percentage gains required to climb back out are the kind of numbers that only show up in lottery tickets and cryptocurrency scams.
Why this destroys the average retail trader
Because the average retail trader treats losses and gains as symmetric. They risk more to recover faster. They double up after a drawdown because they “need” a big winner. They take larger trades when the account is smaller, which is precisely the wrong direction, because the maths of recovery demands that you preserve what you have left, not risk it.
The bookmaker would never do this. When a bookmaker has a bad Saturday, he doesn’t open Sunday’s book with bigger margins and more aggressive staking. He opens Sunday’s book with the exact same margins, the exact same staking, and lets the maths grind the deficit back over the following weeks. He knows, because his entire industry is built on the knowledge, that the only thing worse than a drawdown is a drawdown followed by the attempt to claw it back in one race.
What this means for your sizing
Every time you size a trade, you are making a decision about which recovery curve you’d rather climb.
Risk one percent per trade, and the worst losing streak of your career puts you on the gentle curve. You can recover inside weeks, possibly days, with normal trading. You don’t even feel the hole.
Risk five percent per trade, and a serious losing streak puts you thirty or forty percent in the hole. The recovery curve steepens. You’re now needing fifty to seventy percent gains to get back to flat, and you’re trying to generate those gains with a smaller account that can risk less per trade, which makes the recovery slower again.
Risk ten or fifteen percent per trade, and the hole becomes a crater. You’re looking at the fifty-percent-needs-a-hundred maths we walked through above, with all the psychological wreckage that comes with it, because by the time the account is halved the trader’s decision-making is almost always halved as well.
The professional version
Make small gains consistently. Protect the downside with ruthless sizing. Let compounding do the work over years, not weeks.
One percent per month, compounded, is twelve-point-seven percent a year. Two percent per month is just under twenty-seven percent a year. Three percent per month is forty-two-and-a-half percent a year. These are not glamorous numbers. They will not get you a YouTube thumbnail. They will, over a decade, make you properly wealthy, because the arithmetic of compounding without large drawdowns is one of the most quietly powerful forces in finance.
The goal was never to make a fortune in a month. The goal was to still be here next month, and next year, and the year after, taking the same small bets at the same honest margins, letting the maths do what the maths does when you don’t keep interfering with it.
Rich this decade, not rich this quarter. That is the whole deal.
The Boring Engine
If you’ve made it this far, you’ve earned the punchline.
Everything in this piece has been building toward one unglamorous truth. The way to make money in markets, consistently, for decades, is not to become a better predictor. It is to stop being a predictor at all.
Put down the crystal ball. Pick up the bookmaker’s satchel.
The professional options seller on SPX is not, in any meaningful sense, trading the market. He is running a small, disciplined insurance operation. He collects premium from people who want protection or excitement. He prices the risk using the overround the market hands him for free, because implied volatility has been priced above realised volatility for longer than most of us have been alive. He balances his book with defined-risk spreads so no single trade can break him. He takes enough bets that the Law of Large Numbers does its job. He sizes each position so conservatively that a run of ten losers in a row is an inconvenience, not a eulogy. And he does this, week after week, month after month, year after year, with the same boring mechanical discipline that a bookmaker brings to a Saturday at Cheltenham.
It isn’t exciting. That’s the point. Excitement is the enemy.
Premium Poppers
This is what the Premium Poppers community actually does. Not the glamorous version. The real version.
We sell SPX credit spreads with defined risk. We take the volatility risk premium off the table when the conditions are right. We track our win rate, our average win, our average loss, and our Expected Value for every setup we run. We size at one to two percent of account per trade, because the maths of Risk of Ruin is not a suggestion, it’s a physical law. We accept drawdowns inside two standard deviations as the cost of doing business. We do not size up after losers. We do not chase. We do not predict. We run a book.
The Wall of Wins posts you see week after week are not lucky trades. They’re the output of a process that has been designed, from the first principle up, to align with the maths this piece has spent the last five thousand words walking through. The process is the product. The maths is the moat. The discipline is the job.
That is why the daily SPX Briefing looks the way it does. Not flashy. Not loud. No red arrows, no three-exclamation-mark headlines, no hot takes on what the Fed is about to do. Just the level. The structure of the day. The read on where the volatility is and what the sensible bet looks like. Boring on purpose. Boring as a feature, not a bug. Because the bookmaker who looks boring at Cheltenham is the one still behind the board in March, and the one who looked exciting is driving a minicab.
If you take nothing else
Three things.
Expected Value tells you whether your setup has an edge. If you can’t write the formula down for your current setup with honest numbers, you don’t have a setup. You have a hobby.
Law of Large Numbers tells you to trust the edge only after sufficient sample size. Three hundred trades, minimum. Until then, you’re guessing. Even if you’re winning.
Risk of Ruin tells you to size for survival, not for upside. One to two percent of account per trade. Every professional with a long-term track record operates in this range. Every trader who operated outside it is either retired in luxury because they got lucky, or driving that minicab.
Everything else in trading is a footnote to these three ideas.
The close
The talking-head circus will keep running. The tipsters will keep tipping. The YouTube thumbnails will keep screaming. The LinkedIn lads will keep posting screenshots of the one trade they won and quietly deleting the eight they didn’t. None of it is going anywhere, because the market for excitement is permanent and the audience for bookmakers is small.
But the bookmakers are the ones who still own the board at the end of the season.
So the question, genuinely, is which business you want to be in. The prediction business, which sells well and earns badly. Or the probability business, which sells quietly and earns for a lifetime.
I know which one I’ve chosen. I know which one the Premium Poppers have chosen. And if you’ve read this far without throwing your laptop at the wall, I suspect you know which one you’re being pulled toward as well.
Rich this decade, not rich this quarter.
That is the whole deal.
PopPop.
Happy trading,
Phil
Less Brain, More Gain
…and may your trades be smoother than a cashmere codpiece
p.s. There are 3 ways I can help you…
- Option 1: The SPX Income System Book (Just $12)
A complete guide to the system.
Written to be clear, concise, and immediately actionable.
>> Get the Book Here
- Option 2: Full Course + Software Access – 50% off for Regular Readers – Save $998.50
Includes the video walkthroughs, tools for TradeStation & TradingView, and everything I use daily. Plus 7 additional strategies
>> Get DIY Training & Software
- Option 3: Join the Fast Forward Mentorship – 50% off for Regular Readers – Save $3,000
>> Join the Fast Forward Mentorship – trade live, twice a week, with me and the crew. PLUS Monthly on-demand 1-2-1’s
No fluff. Just profits, pulse bars, and patterns that actually work.