TLDR: A market that shrugs off bad news isn’t broken, it’s telling you who owns it and what they expect. Fast 10% corrections happen about one year in three, not every year. When the floor does give way, it rarely starts with a headline. It starts with every setup failing at once. Have a plan, not a prediction.
 Ahoy there, Trader! ⚓️
It’s Phil…
Two days that should have hurt more
On Wednesday 14 October, US inflation came in hotter than expected. Headline CPI was 3.7% against 3.6% forecast, and core was 2.6% against 2.5%. The Nasdaq 100 fell 2.02%. Tech dropped almost 3% and semiconductors nearly 4%.
On Thursday it got worse on paper. Producer prices jumped 1.3% in a month against 0.5% expected. That’s not a miss, that’s a different postcode.
And the market’s response? By Thursday’s close the equal-weight S&P 500 was 0.8% higher than before any of it started. The Dow was up nearly 1%. The 10-year yield actually fell, from about 5.19% to 5.08%.
That same Wednesday, Mike Novogratz summed up the mood on a podcast. With rates, oil and politics all piling on, he said: “You threw all that at the market and it can’t go down.”
He’s right. And it’s one of the most frustrating feelings in trading. You can see every reason for the market to fall, and it simply refuses.
So what the hell is going on? That’s what this piece is about.
Loud news that moves nothing
Here’s the first thing to get your head around. The headline index and “the market” were two different animals that week.
Tech and chips fell on Wednesday and kept falling on Thursday. Health care, staples, financials and the shopping stocks went the other way. The S&P 500 finished Thursday still 0.8% down, because it’s weighted towards the giants. The average stock finished up.
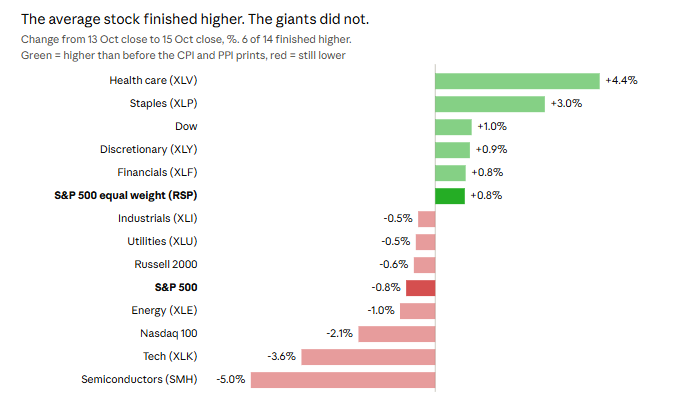
Now, it’s very tempting to call that “rotation”, as if someone pressed a button and moved the money. I can’t prove that, and neither can most people who say it. What I can show you is the price: tech fell whilst health care rose. Who sold what to whom is a guess.
The bigger lesson is about news itself. Back in 1989, three economists (Cutler, Poterba and Summers) studied the 50 biggest one-day moves in the S&P since 1946. Many of them happened on days with no major news at all. Overall, they found macro news explained somewhere between a fifth and a third of price movement.
Read that the other way round and it gets interesting. If big moves often come without news, then big news often comes without a move. Thursday’s producer price shock is a textbook case. The loudest number of the week, and the average stock went up.
That doesn’t mean news is irrelevant. It means price reacts to surprise, and to who owns the shares, far more than to how scary the headline sounds.
The correction that was never on a schedule
My own test for a proper corrective move is simple. A 10% drop from a closing high, inside 12 to 15 trading days. Size and speed. A slow 10% grind over three months is a different beast.
For years I carried an assumption with it: these fast drops happen roughly once a year. So when one hadn’t turned up, I’d start to feel the market owed me one.
In autumn 2019 I was exactly that trader. Seasonality was lining up, we hadn’t had a fast 10% move, and I was bearish all the way up. From January 2020 I was even more bearish, and I said so on my podcast at the time like a broken record. Then the catalyst arrived. Nobody I know was watching for a pandemic.
So for this article I tested my own assumption. I ran the S&P 500’s daily closes back to 1928 through my 10%-in-15-days rule. It didn’t survive.
- Since 1950, only about 37% of years had a fast 10% drop. That’s roughly one year in three, and that’s the generous count.
- The “once a year” feel comes almost entirely from the 1930s. That decade alone accounts for 49 of the 106 episodes since 1928.
- Long droughts are normal. From August 1990 to October 1997, more than seven years, there wasn’t a single one. The S&P gained 186% over that stretch.
- Today’s stretch is ordinary. The last fast drop ended in April 2025. Since then, 383 trading days without one ranks 20th out of 144 such stretches.
One thing my gut did get right is the timing. Since 1950 these fast drops have clustered in August to October, with October the most common month for the low. February and March show up too, just less often.
The point is this. The 10% drop isn’t overdue, because it was never due. A market that hasn’t corrected isn’t storing up a debt it has to pay back on a timetable. It’s just a market that hasn’t corrected yet, and “yet” can last seven years.
Five reasons the floor holds
I went through the research on why markets keep rising through bad news. Plenty of explanations get thrown around. These five have the most evidence behind them.
1. Profits kept growing. Over the long run, the index follows earnings. S&P 500 earnings grew 10.4% in 2024 and 13.6% in 2025 (FactSet), straight through the tariff and recession scares. Gloomy headlines don’t sink an index whose companies keep earning more. One honest caveat: 2023 rallied 24% while earnings were shrinking. Sometimes it’s pure optimism doing the lifting.
2. The market looks ahead, and most moves have no headline. Prices are bets on the future. Bad news that everyone already expected is old news to the tape. The S&P has historically bottomed months before a recession ends (Schroders), long before the headlines turn.
3. A few giants carry the index. The ten biggest companies made up a record 40.7% of the S&P 500 at the end of 2025 (RBC Wealth Management). In 2023, seven stocks delivered 62% of the index’s whole return (S&P DJI). So “the market” can look fine while the average stock struggles, or, as last week showed, the other way round.
4. The economy is not the market. The richest 10% of US households own about 88% of all stocks and fund shares. The bottom half owns 0.6% (Federal Reserve). About 62% of US adults own any stock at all (Gallup). Bad news about wages and jobs lands hardest on people who own very little of the market. Prices follow profits and the people who hold the shares.
5. Being early is expensive. In December 1996, Alan Greenspan warned about “irrational exuberance”. He was right, eventually. The S&P then rose another 105% before it peaked in March 2000. That’s what being right but early looks like on a chart.
The ones with weaker evidence. You’ll hear that buybacks, passive index funds or options dealers “prop up” the market. Buybacks are real money, a record $942.5bn in 2024 (S&P DJI), but they shrink exactly when markets wobble. The passive-flow research is hotly disputed. And the options research shows dealers shape how choppy the day is, not which way the market trends. All plausible. None of them proven.
When the floor finally gives way
None of this means markets never break. They do, and 2007 is the best example of how long bad news can sit in plain sight first.
| Date (2007) | What happened | S&P 500 |
|---|---|---|
| 28 Mar | Fed chair Ben Bernanke says subprime problems look “contained” | Rising |
| 17 Jul | Bear Stearns tells investors two hedge funds are close to worthless | |
| 19 Jul | Two days later | Record close, 1,553 |
| 9 Aug | BNP Paribas freezes three funds tied to US subprime | Falls 3% |
| 14 Sep | Bank of England steps in to support Northern Rock | 1,484 |
| 9 Oct | Weeks after the queues outside Northern Rock | All-time high, 1,565 |
The S&P made its all-time high after the credit crisis was front-page news on both sides of the Atlantic. The writing was on the wall for nearly two years before it was properly read.
In my own world back then, the warning didn’t come from the headlines. I was focused on the lower timeframes, not the big picture the way I am now. What I saw was price behaviour out of sync with normal moves. Patterns and setups that had always behaved well started breaking down.
One day a few weeks before the big 2008 drop, EURUSD made eight bullish breakout attempts from a range. Then it broke down twice, and the second break was the one that worked. I’m not ashamed to say I nearly cried that day. I took about ten days off. A few days after I came back, the markets broke. It went from “oh shit” to “holy shit”, the bad kind and then the good kind.
If you ask me what the signal was, I can’t point to one thing. It was watching a behaviour, seeing it again and again, and noticing how the market reacted each time. And the clearest version of it is this: every pattern and setup, whatever your preference, starts to fail all at once. When the tools that normally work stop working together, the floor is thinning.
There was a human version of it too. A friend of mine was buying houses he couldn’t afford last week because the lender said he could this week. Then he used the rise in one house’s value to buy the next. I warned him it was a recipe for disaster. In the end I said I’d done my job as a friend, and the rest was his choice. It’s always fun while it lasts. But a house of cards comes down hard.
So where are we now?
If you want my honest feel, today reminds me more of the dot-com years than 2007 or 2019. Back then you added “.com” to your name and your valuation went up. Now you add “AI”. The price behaviour has that same skittish quality you get ahead of a pop and drop.
The numbers back part of that up. The top ten stocks are around 41% of the S&P 500 today, against roughly 27% at the 2000 peak (RBC Wealth Management). Last week’s split, with chips falling and the average stock rising, is exactly what a top-heavy market looks like.
But it’s only fair to show the other side. Today’s giants make real money. The top ten earned about 32% of the index’s profits in 2025, against 41% of its weight. Plenty of dot-com darlings had no profits at all. That doesn’t make today safe. It does make it different.
And that’s the honest position. A feel is a feel. It’s useful for knowing what to watch, not for deciding what to do.
The plan beats the opinion
It’s fine to have opinions. I’ve got plenty. In the last several weeks alone, my bull and bear views have been spun round more times than I’d like to admit. Seasonality says one thing, the cycle says another, and the tape ignores both.
I’m not smarter than the data. Nobody is. That’s exactly why I trade from a concrete “if this, then that” plan, with mechanical rules and tools to back it up.
It’s also why I live by one simple line: the trade sets up, the trade goes on. It stops me second-guessing. I don’t need to know why the market refuses to fall today. I need to know what I do when it does, and what I do when it doesn’t.
A market that won’t fall isn’t wrong, and it doesn’t owe you a correction. It’s telling you who owns it and what they expect. Listen to the price, respect your rules, and let the headlines shout at someone else.
Views aside, profits abide.
Image prompts and sources
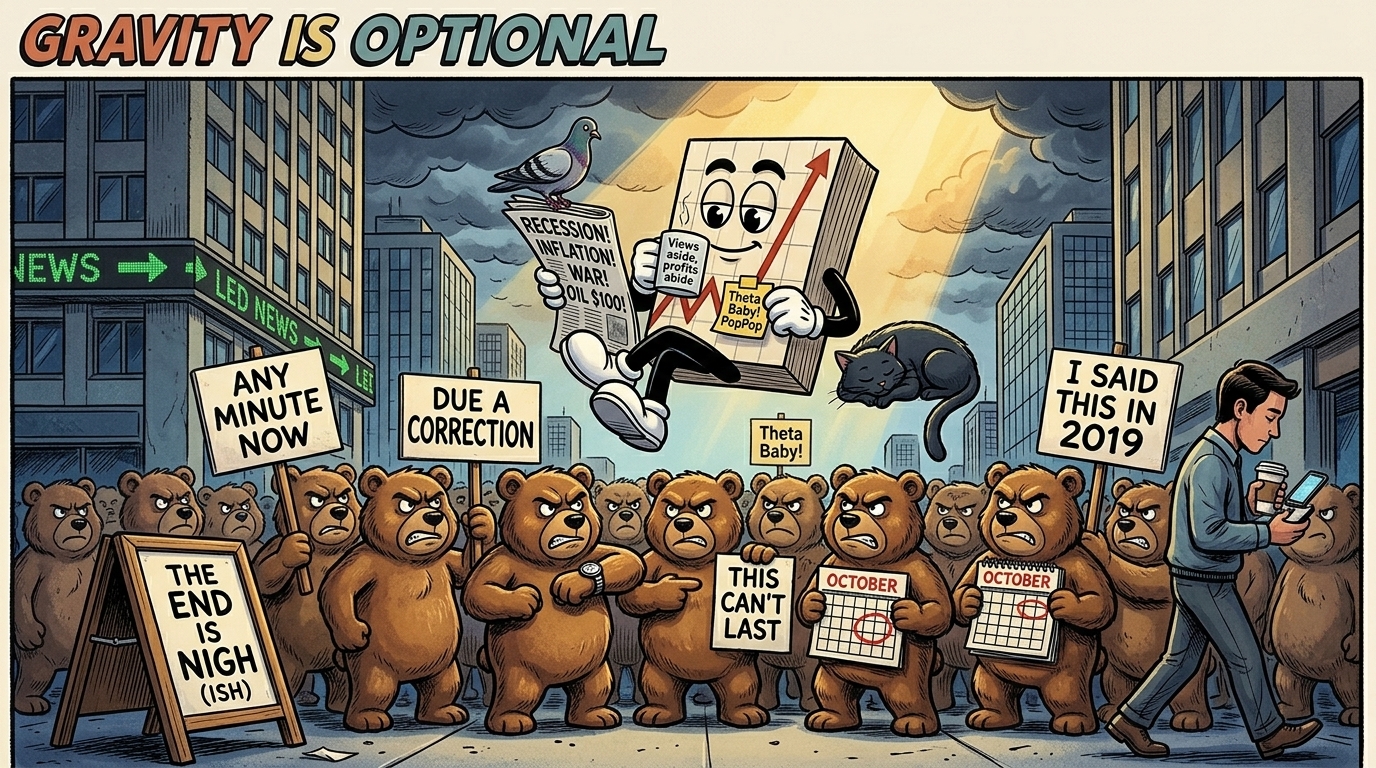
Hero option A: Gravity Is Optional. Alt text: Mr SPX floats calmly above a crowd of frustrated bears holding “any minute now” placards, reading a newspaper full of bad headlines while his coffee mug says “Views aside, profits abide”.
Hero option B: The Tower of Worry. Alt text: A wobbling tower of blocks labelled with market worries stays standing on a single “Earnings” block while onlookers brace for a collapse and Mr SPX sips coffee, unbothered.
Happy trading,
Phil
Less Brain, More Gain
…and may your trades be smoother than a cashmere codpiece
p.s. There are 3 ways I can help you…
- Option 1: Collect Morning Income
A complete guide to the Premium Popper system.
Written to be clear, concise, and immediately actionable.
>> Learn More Here
- Option 2: Collect Weekly Income
A complete guide to the Tag ‘n Turn system.
>> Learn More Here
- Option 3: Join the Fast Forward Mentorship
>> Join the Fast Forward Mentorship – trade live, twice a week, with me and the crew.
PLUS Monthly on-demand 1-2-1’s
No fluff. Just profits, Tag ‘n Turn Pulse bars, Poppers, and Patterns that actually work.
Sources
- Index, sector ETF, VIX and 10-year yield closes, 13 to 15 October 2026, and S&P 500 daily closes 1928 to 2026 for the correction study: TradingView
- CPI and PPI releases, 14 and 15 October 2026: Bureau of Labor Statistics, via the TradingView economic calendar
- Cutler, Poterba and Summers, “What Moves Stock Prices?” (1989)
- FactSet Earnings Insight, 27 Feb 2026
- Schroders: how US stocks perform during recessions
- RBC Wealth Management: the great narrowing
- S&P DJI: US equities market attributes, December 2023
- S&P DJI: 2024 buybacks
- Federal Reserve Distributional Financial Accounts (FRED)
- Gallup: share of Americans owning stock
- Federal Reserve: Bernanke testimony, 28 Mar 2007
- Bank of England: Northern Rock support, 14 Sep 2007
- Federal Reserve: Greenspan “irrational exuberance” speech, 5 Dec 1996
- Novogratz quote: All Things Markets with Anthony Scaramucci, recorded 14 Oct 2026