 Ahoy there Trader! ⚓️
It’s Phil…
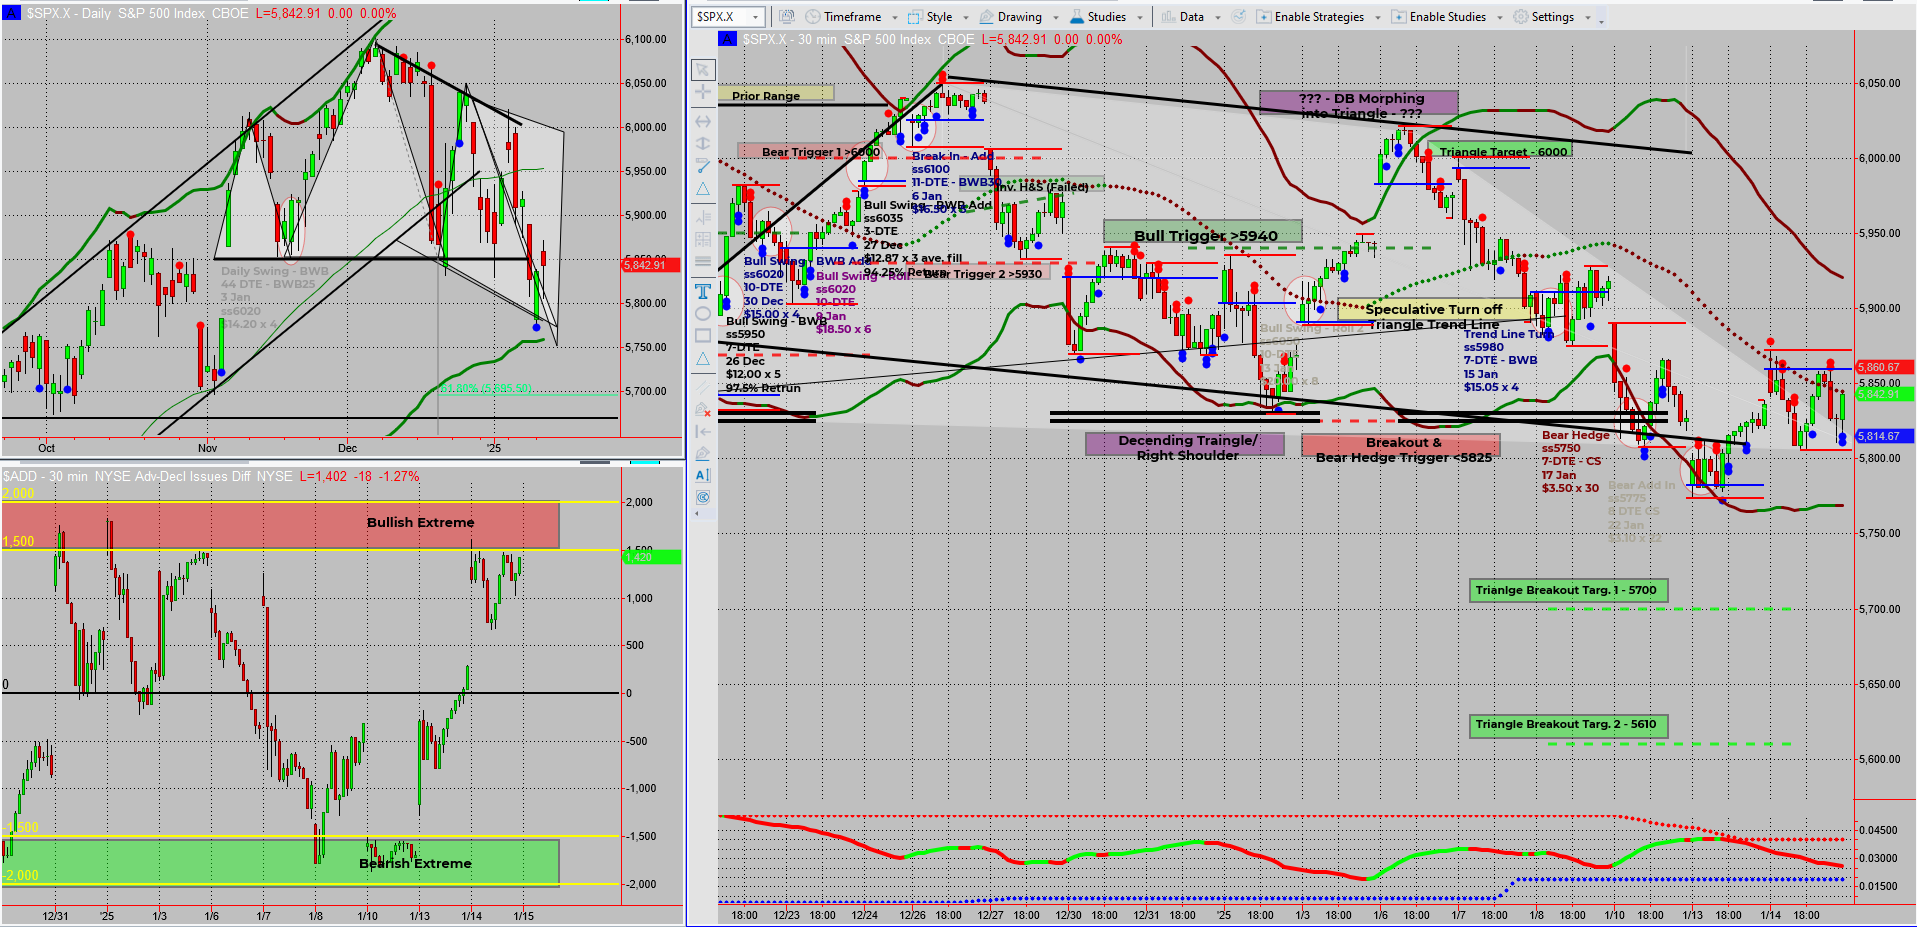
Forecasting price movements feels like flipping a coin some days. Yesterday’s patterns evolve into today’s new technical setups, keeping us guessing. Right now, SPX is retesting a critical daily head and shoulders pattern. Will the bears drive it to 5700, or will the bulls hold the line? Let’s dive into the charts and assess the battlefield.

Important Question: Are you ready to trade smarter?
When you’re ready – Dive Deeper Into a Profitable Rules Based Trading System
This Proven 3-Step “10 min/Day” 6-Figure Unconventional Recession Proof SPX Income System Unlocks $500-$5,000+ Days FAST! …
SPX Deeper Dive Analysis:
Predicting market moves is an art riddled with uncertainty – it’s always a 50/50 shot. That’s why focusing on the evolution of price action is essential. Yesterday’s charts told one story, but today’s developments could paint an entirely different picture. This is the nature of the markets: dynamic and ever-changing.
Current Observations:
- Daily Head and Shoulders Retest
SPX is revisiting the right shoulder of a head and shoulders (H&S) pattern. A break here could signal a significant bearish continuation. - Bearish Targets
If the retest confirms, SPX could head toward 5700 and, ultimately, 5610 – key levels identified for potential downside moves. - $ADD at Bullish Extreme
The $ADD is showing a bullish extreme, suggesting the market may be poised for a short-term pullback before continuing its downward trajectory.
Why Price Evolution Matters:
Yesterday, the charts may have shown a symmetrical triangle or consolidation. Today, it’s all about the H&S pattern breaking down. This fluidity is why reacting to new information is more important than rigidly sticking to old forecasts.
What’s Next?
- If SPX holds at current levels, the bulls might get a chance to rally.
- A break below the right shoulder of the H&S pattern opens the door to 5700 as the next logical target.
- It’s all about waiting for confirmation and keeping a level head amidst the noise.
The challenge isn’t just about being “right” – it’s about adapting to what the market gives us.
Fun Fact
The term “head and shoulders” for the popular chart pattern dates back to the 1930s. It was first coined by technical analysts studying stock market trends post-Great Depression. Even back then, traders loved spotting shoulders!
While it’s a staple of modern technical analysis, the head and shoulders pattern originated as part of early efforts to understand market psychology. The pattern symbolises shifts in buying and selling pressure, with the “head” representing the peak of optimism or pessimism. It’s fascinating how such a simple visual can reflect the collective emotions of traders.
Happy trading,
Phil
Less Brain More Gain
…and may your trades be smoother than a cashmere codpiece
