Where the dumb money always parks its stops…
 Ahoy there, Trader! ⚓️
It’s Phil…
The shenanigans continue and we see an attempted breakout of the range overnight, likely on the NVDA earnings excitement, but I think the reality is once the dust settles we can expect a return to whatever the fuck this new normal is.
Right then, let’s get into the charts.
Market Snapshot
An attempt at a breakout was made overnight. The market has since clarified that the attempt was exploratory, and no commitment should be inferred from it.
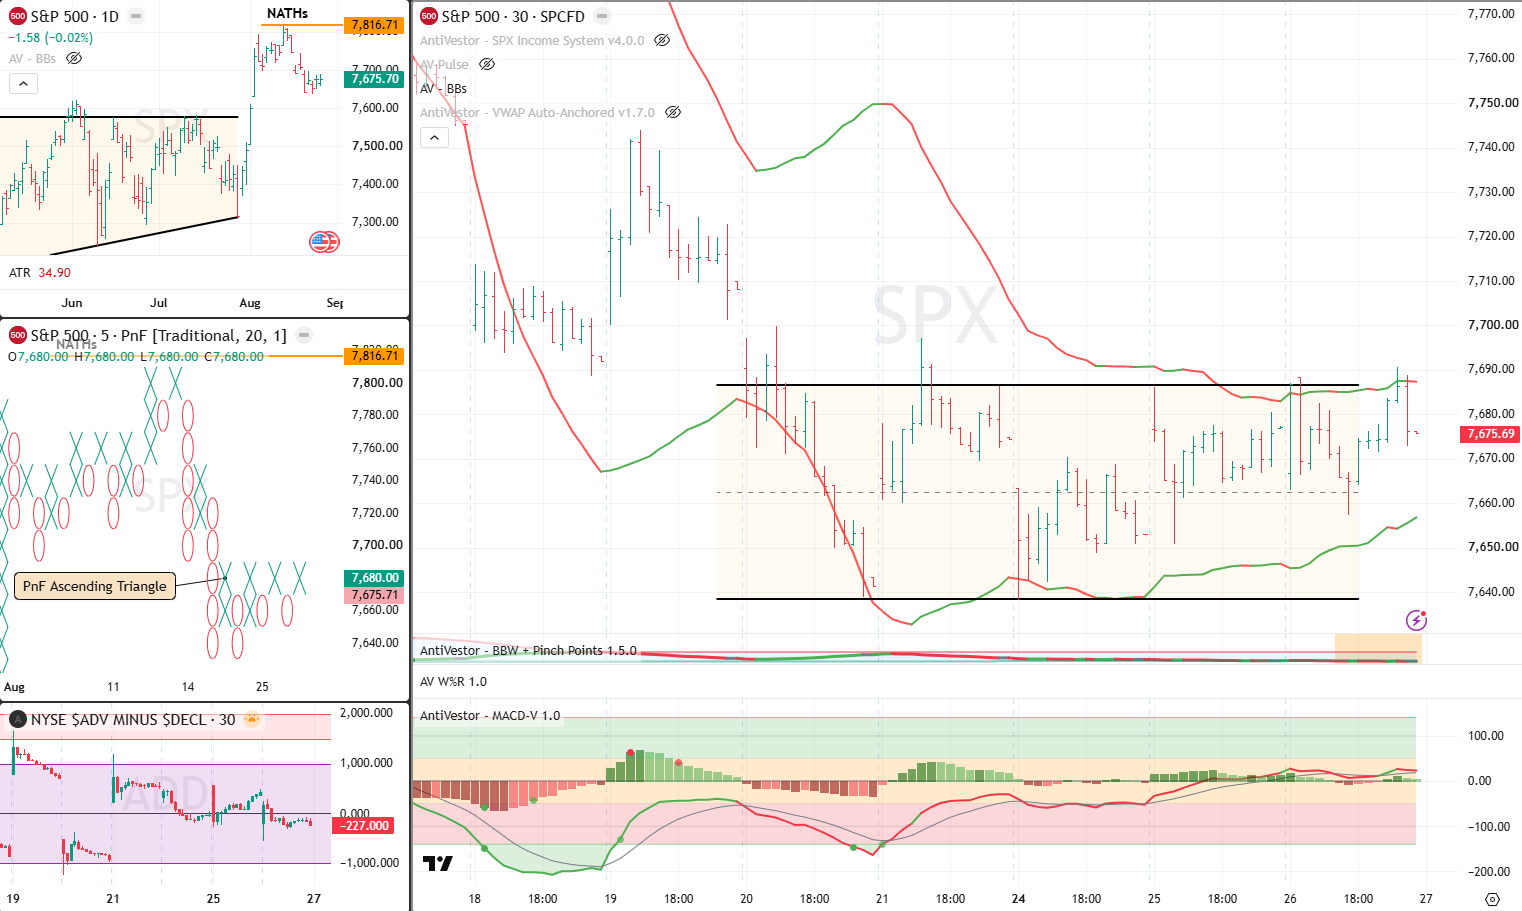
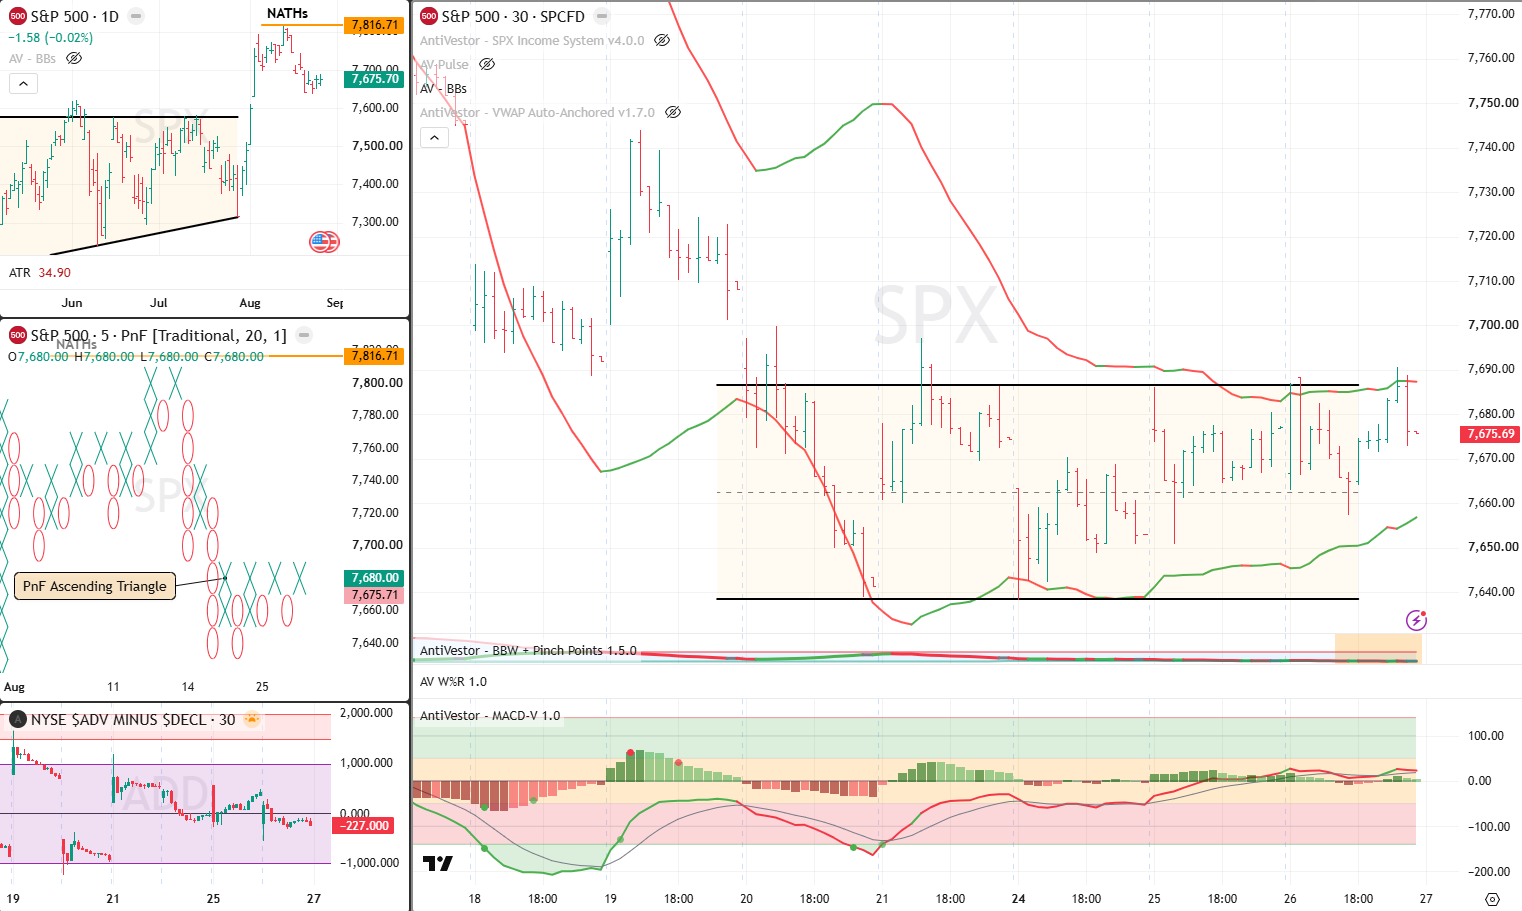
- SPX 7,675.70, down 1.58 (0.02%). Still in the range on cash. Full read below.
- ES 7,725.75, up 15.75 (0.20%). Bull breaks of the previously mentioned ranges are being attempted.
- NazQuack (NQ) 29,612.25, up 0.59%. Same story, the bull break is being attempted here too.
- Uncle Dow (YM) 53,506, down 221 (0.41%). Inside bar high breakout, and we know what that means. Overnight action took yesterday’s high out already and sold off, just like the inside bar setups we have been talking about all this week and last week.
- Uncle Russ (RTY) 3,011.7, down 1.7 (0.06%). Developing what I like to call a russian doll type pattern, an inside day inside an inside day which is inside an inside day. This is going to pop hard, well, usually it does.
- Gold 4,634.5, down 13.3 (0.29%). No read today.
- Crude (CL) 82.12, up 0.21 (0.26%). No read today.
- VIX 14.91, down 0.31 (2.04%). No read today.
- BTC 80,070.91. The long one. Full read below.
Collect Weekly Income
Learn More
SPX – Still in the range on cash, and the futures are pumping.
SPX cash is looking like it’s still in the range, but we know the futures pump means it’s likely to gap higher around 40 or so points at the open if it holds. Meta did the same thing on its news, interestingly gap higher trade lower.
Meta has already shown everyone how this goes. Act surprised.
It will be interesting to see if these overnight moves hold or fold. Breakout on the gap, pullback then continuation higher is the pattern, or a move lower and back inside the range.
I’m remaining cautious on my swings. 3 days to go and we are officially in bear season. Small hedge type of trades on still, just in case.
Although with the global trading hours I’d expect to be able to join the fun if there is an overnight move without having to bugger around with futures.
Anyway, that’s metaphorically next week’s problem.
Hold or fold. That is the whole question at the open.
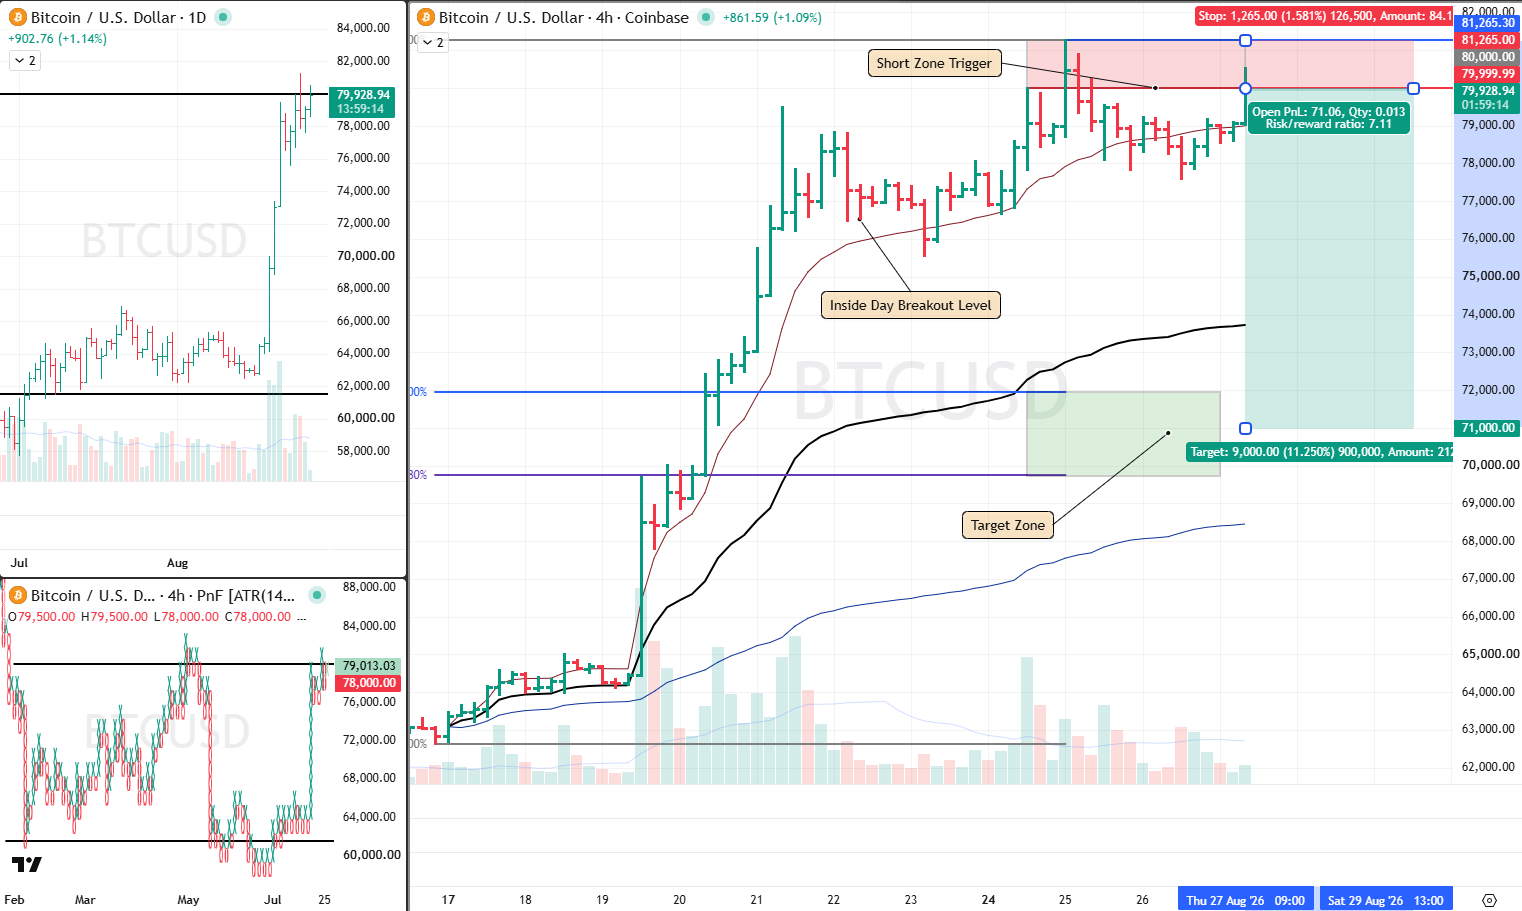
Crypto, BTC – Failure at the range high, and a short filled at 80000.
OK folks, strap in. We did a deeper dive on this inside my mentorship calls.
The layout post inside bar trade is that a new high was attempted and on the daily chart we can see a clear rejection bar or inverted hammer type of shape should you have the candlestick charts on. Now this in and of itself is not a reason to get excited, individually named candle patterns happen all the time and don’t mean anything without context, but it does make me sit up and pay a little more attention to that context and update the analysis.
This is when I move from my snap view to the dedicated workspace for that deeper assessment. Now as an aside, I am not spending hours doing this. At my stage of life it should take 5 to 10 mins and as always I’m using my 6 money making patterns as a framework to identify if and where there may be an opportunity.
Further investigation shows that the prior vertical move higher pulled back, developing the earlier inside bar setup for a quick bull scalp, that should potentially have led into the continuation higher, if a move higher was to be seen.
It didn’t, which is when the inverted hammer and potential Pinocchio bar pattern or pin bar setup was created. Another way of thinking about it is a failed continuation pattern, possible reversal pattern.
Zooming out
This is where the PnF charts really come into their own to be super helpful. We can see price is at a previous stopping point and interestingly when price produced the huge sell off prior to the same explosive move back higher, the same levels can be refined on the regular daily chart. So we have a possible new really large range. Is this the 3rd point of contact for the highs? We already have multiple points for the lows.
Context is starting to build and we now have price at or near a range high with the failure at this stage to continue to break up and out.
Where the dumb money is
A couple of potential scenarios start to now form. Other people far smarter than me have seen this range already, the dumb money has placed their breakout trades or attempted to get on the continuation train, so where are the stops going to be? The dumb money often places stops in really common areas, 50% of the range height, so if this is a stop run to whip the early breakout traders and the “I’m missing the rocket ship crowd”, as well as those that were indeed “on it” already, they will often cover 50% of the move to lock in some profits.
Lots of logical reasons to look at around the 70000 to 72000 level.
So, interesting location, failure to move higher, potential to move lower.
Let’s look at that Pin Bar pattern again…
The dumb money also trades this funny too, all because they don’t have sensible risk controls. They want the 2:1 reward to risk or better and they will often force it. Ranges are my usual example, height of the range is usually the target, so to get the 2:1 they will use half the range height as an artificial stop loss level. Nothing practical in it or about it at all, and the genuinely smart money know where levels like this are.
The Pin bar setups also have them. The dumb money will often have the fomo meter reading to maximum 100% of the time, so they will use the inverted hammer bar every time, the break of that low as soon as. The height of the pin bar, like a range, will be used to calculate a target, height of the pattern. Nothing wrong with this, often a very good way of working targets out, the height of the pattern. Stops equally should always go past the event or pattern that got you into the trade. But the dumb money wants that 2:1, so they use half the height of the pattern, or the bar height to the left of the Pinocchio bar, and call it the eye of Pinocchio.
That was Martin Pring, who named the Pinocchio bar in the first place and named its anatomy with it: the nose, and the bars either side of it, the left eye and the right eye.
So if that’s where the dumb money is, the smarter than the average bear money should attempt to enter there after the stop run. There will be of course some fucking retard shouting about FVG liquidity sweeps or some other made up bullshit to explain it as a magical occurrence, but actually knowing what is happening means you don’t need to buy into the social media gooroo who has never traded a day in their lives…. anyway…
The trade
That’s where we are at now. Price is in the bear zone, a super low risk location.
My bear entry was at 80000 on a limit order, with stops above the highs. It’s a live trade, and as it stands it’s a little over 7:1 reward to risk, assuming everything plays out.
Price may get to the 71000-ish zone, or we could see a range start to develop as it has done a few times at these extremes, so a conservative assessment zone around 75000 makes perfect sense to me.
There you have it.
Pattern + Context = Higher probability
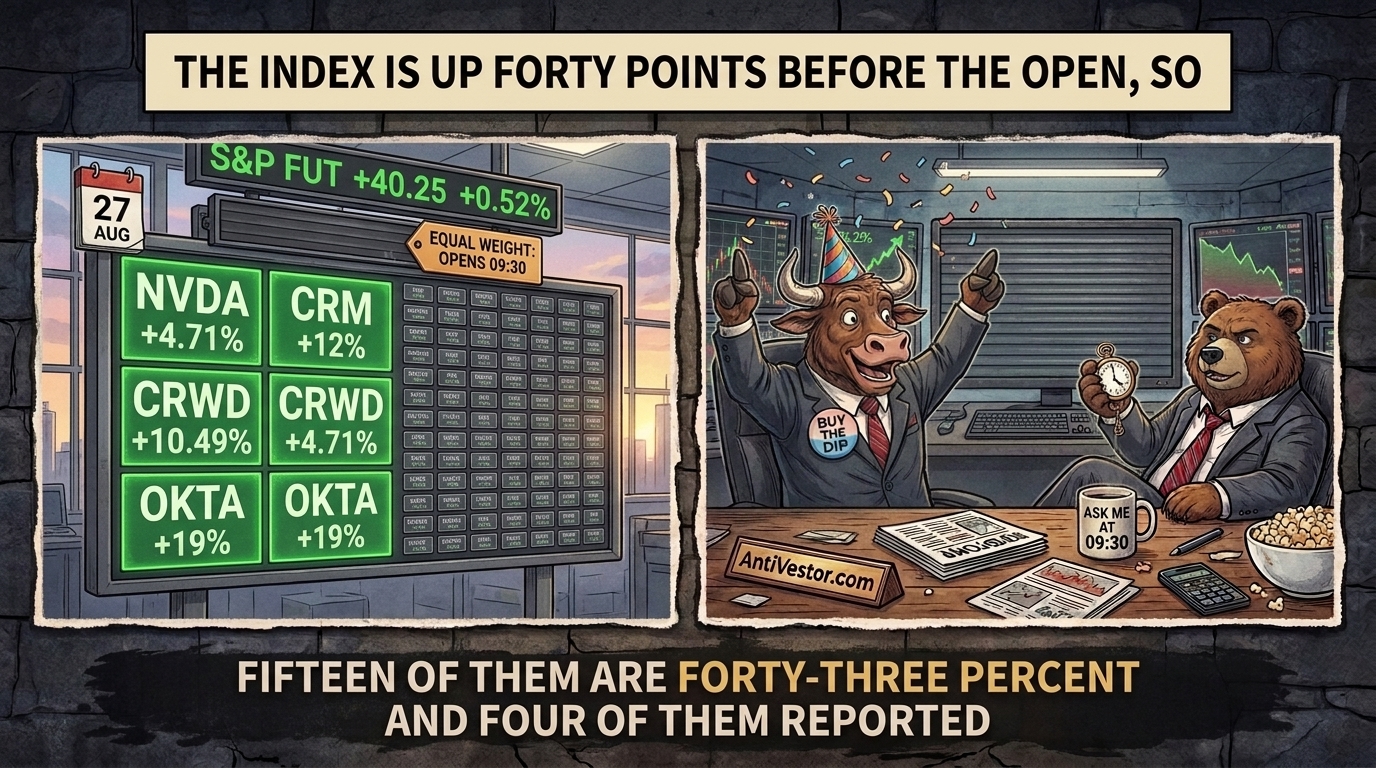
Meme of the Day:
Happy trading,
Phil
Less Brain, More Gain
…and may your trades be smoother than a cashmere codpiece
p.s. There are 3 ways I can help you…
- Option 1: Collect Morning Income (Just $12)
A complete guide to the Premium Popper system.
Written to be clear, concise, and immediately actionable.
>> Learn More Here
- Option 2: Collect Weekly Income (Just $12) –
A complete guide to the Tag ‘n Turn system.
>> Learn More Here
- Option 3: Join the Fast Forward Mentorship
>> Join the Fast Forward Mentorship – trade live, twice a week, with me and the crew.
PLUS Monthly on-demand 1-2-1’s
No fluff. Just profits, Tag ‘n Turn Pulse bars, Poppers, and Patterns that actually work.