17 releases moved the curve. 1 rebalancing hour moved the index further.
⚓ Weathervane. The wind is coming from the long end. The policy rate has been frozen for most of the year whilst the term premium does the tightening, and the price of long money is set by deficits, issuance supply and a synchronised global duration bid rather than by the committee. Higher-for-longer stopped being a Fed decision and became a bond-market fact. The cruise ship is holding this heading.
 Ahoy there, Trader! ⚓️
It’s Phil…
When a calendar moves a market more than a data set does, which one should we be reading?
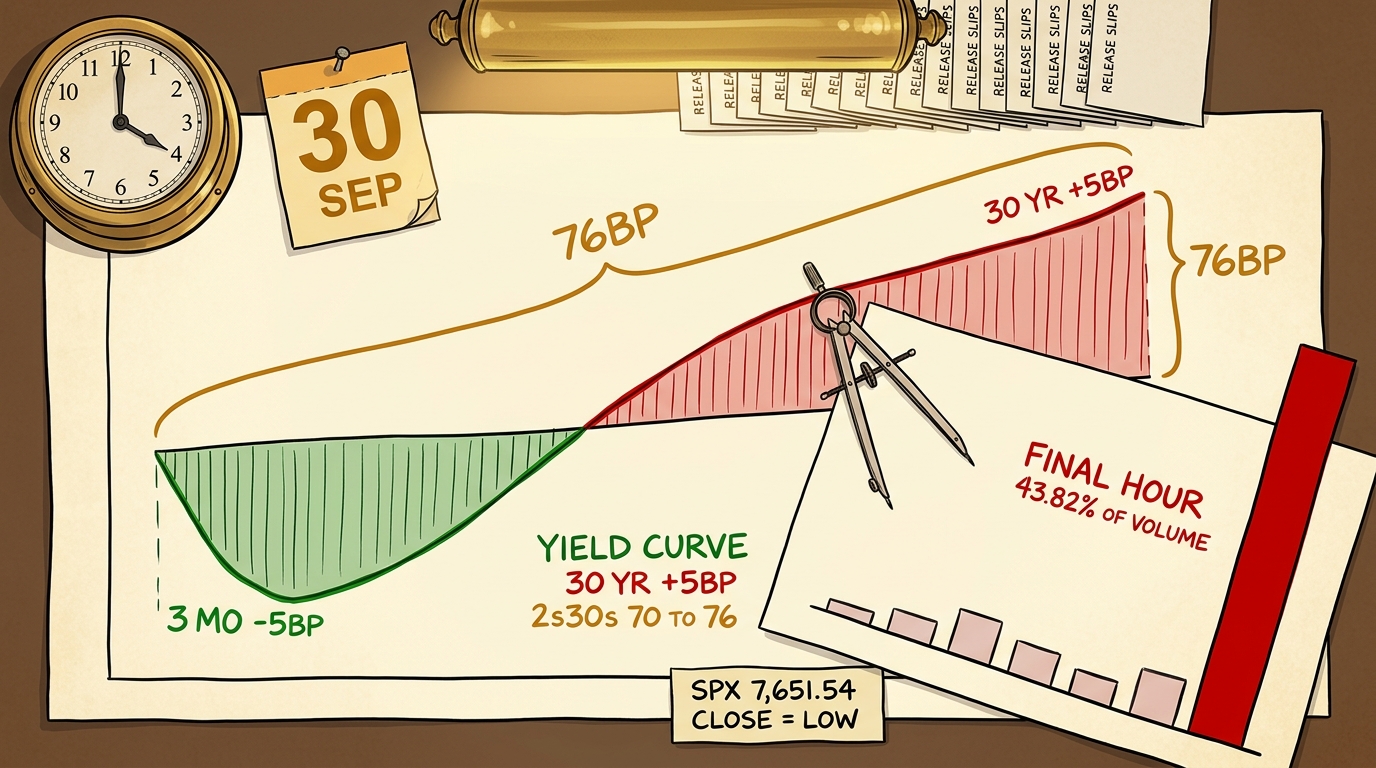
Wednesday handed us the cleanest natural experiment of the quarter. Seventeen releases at one timestamp, the inflation half soft and the activity half hot. The front end of the curve took the inflation and richened, five basis points at the 3-month. The long end took the growth and cheapened, five at the 30-year. Two-year to thirty-year widened from 70 to 76 basis points, the widest of the ten published sessions we hold. Equities read the same page and were up 0.6784% by the middle of the day.
Then the quarter ended. In the final hour the S&P 500 traded 43.82% of its entire session volume, 1.37 billion shares at 4.68 times the pace of the preceding six hours, and closed 41.20 points lower at its exact low. The Dow, the Russell and the Nasdaq Composite managed the same thing on the same print. All eleven sector proxies finished in the bottom 30% of their daily ranges.
The textbook position is that a price aggregates information, and on the evidence of the first six hours the textbook was doing perfectly well. The curve finished split, and sensibly. Equities moved the way a softer inflation print says they ought to. What the textbook has rather less to say about is the final hour, because a rebalancing deadline is not information about anything at all. An inventory adjustment with a date attached is the likeliest reading, and on that reading it set four closing prices and one of the quarter’s headline figures.
Most desks will mark the quarter at 7,651.54 and most of the commentary will reach for the inflation number to explain it. We would rather say plainly that the two have very little to do with one another. The speedboat did not turn. Somebody tidied the deck before the inspection.
Which leaves the awkward follow-on, and it is the part worth sitting with. If half a percent of index level can be set by housekeeping on a day when the deadline is visible, how much of what we read every evening is the same thing in smaller doses, on the days when nothing makes it obvious? We have no answer to that, and the 43.82% does not supply one. What it supplies is a reason to treat any single session’s close with rather less reverence than the tape invites.
Phil’s Musing
The part I keep circling is that the curve behaved impeccably and the index did not, on the same information, in the same session. If I had to pick which of the two I would trust to tell me what Wednesday actually meant, it is the 76 basis points between the two-year and the thirty-year, not the 7,651.54. The bond market had no deadline. The equity market did.
Happy trading,
Phil
Less Brain, More Gain
…and may your trades be smoother than a cashmere codpiece
P.S. – Phils Footnote I should own the assumption I walked in with. Seeing four indices close at their exact lows, my first instinct was that something had broken late in the day, and I went hunting for the headline that did it. There was not one. The lesson I am taking out of it is that the first question to ask about an unexplained close is not what happened, but what day it was.
🗂 Desk Notes – Part 219 | 1 Oct 2026
Raw briefing. Observations only. No trades named.
Session read (§8.4)
SESSION BRIDGE: prior session (Wed 30 Sep) full reaction SPX -0.2516% to 7,651.54 after a +0.6784% session high, closing at its exact low with 43.82% of session volume in the final hour; live premarket ES +0.5832% / NQ +1.3299%, VIX no premarket print available on this stack (30 Sep official close 16.34, carried as a prior-session figure); threshold: none.
Threshold reasoning, and the gate’s blind spot is the finding. §8.4.1 reads NONE on every leg. The equity leg is -0.2516% against a 1.0% soft trigger. The volatility leg is +1.87% on the day against a ±8% trigger. The commodity leg is +1.1636% on November WTI against ±4%. The premarket leg is +0.5832% on December ES, inside the ~0.3-0.6% normal band by 0.017 of a point.
So the gate is silent on a session whose entire story is intra-session volume distribution. A close-to-close percentage threshold cannot see a market-on-close imbalance, and this edition’s spine is invisible to every leg of §8.4.1. Recorded as a candidate spec proposal rather than acted on: §8.4.1 has no volume or range-position leg, and a session that closes at its exact low on 4.68 times average final-hour volume is noteworthy by any editorial standard whilst reading NONE mechanically. One instance is not a spec change (§14.4 discipline). Logged for a second occurrence.
Close-to-open window. Cash close 20:00 UTC Wed 30 Sep to capture 06:30 UTC Thu 1 Oct. Session boundary established deterministically from the CME maintenance gap, no bars 20:55 to 22:00 UTC on any of the four contracts. Overnight session opened 22:00 UTC.
Capture protocol. The 06:30:00 to 06:34:59 UTC five-minute bar was read at 06:50 to 06:52 UTC and re-read at 06:58 UTC. All four dated contracts returned byte-identical open, high, low, close and volume across both reads. The adjacent still-forming bar moved materially in the same two responses: YM’s close went 51,296 to 51,334, a 38 point move, and ES gained 3,316 contracts of volume between reads. Fifth consecutive confirmation that a 5-minute futures bar is unsafe until roughly 15 minutes after it closes, and that the retired ±0.25 point noise floor was wrong by a large multiple.
Contract roll. Not a quarterly roll date. But ICE Brent November 2026’s last trade date was 30 September, so Brent’s front month is now December (ICEEUR:BRNZ2026) whilst WTI’s remains November (CLX2026), established from the session’s own volumes at 266,024 against 157,519. The two products run opposite ways and the WTI finding must not be carried across.
The mechanism read (full)
CMT curve, 30 September against 29 September, basis points. Triple-fetched per protocol; the first fetch was presumed stale and two cache-busted fetches agreed character for character. Fourteen-column schema with the 1.5 Month tenor asserted before parsing. H.15 matched cell for cell on 29 September at all eleven shared tenors and carries no 30 September column, which is the documented one-session lag.
| Tenor | 29 Sep | 30 Sep | Change |
|---|---|---|---|
| 1 Mo | 4.04 | 4.02 | -2 |
| 1.5 Month | 4.14 | 4.13 | -1 |
| 2 Mo | 4.18 | 4.16 | -2 |
| 3 Mo | 4.25 | 4.20 | -5 |
| 4 Mo | 4.30 | 4.29 | -1 |
| 6 Mo | 4.36 | 4.33 | -3 |
| 1 Yr | 4.58 | 4.54 | -4 |
| 2 Yr | 4.89 | 4.88 | -1 |
| 3 Yr | 4.98 | 5.00 | +2 |
| 5 Yr | 5.06 | 5.09 | +3 |
| 7 Yr | 5.16 | 5.19 | +3 |
| 10 Yr | 5.26 | 5.29 | +3 |
| 20 Yr | 5.64 | 5.68 | +4 |
| 30 Yr | 5.59 | 5.64 | +5 |
2s10s 37 to 41. 2s30s 70 to 76, the widest of the ten published sessions from 17 to 30 September. 20y minus 30y 5 to 4. The 20-year is strictly the highest published yield on the curve at 5.68%, verified against the whole fourteen-tenor set, for an eighth consecutive session.
What moved, and the timestamps are not all the same one. Seventeen releases shared the 08:30 ET timestamp. Both inflation cuts that carry forecasts undershot: core PCE 0.2% against 0.3% expected and 3.0% annual against 3.3%. Headline PCE printed 3.4% annual and the Q2 GDP price index 6.1%, neither with a forecast held, so neither is scored. On the growth side the GDP Q2 third estimate overshot at 2.2% against 1.5% and personal spending printed 0.9% with no forecast held. ADP at 90,000 landed at 08:15 ET and Chicago PMI at 58.8 against 51.2 expected landed at 09:45 ET, so neither belongs in the 08:30 cluster and neither is counted in the seventeen.
What it implies, with causation and sequence separated. Causation is available for the 08:30 move and is stated as causation, because an intraday path exists: a pre-release level at 08:25 ET, a single-bar gap at the release minute on both ends of the curve, and a recovery path thereafter. The front end took the inflation; the long end took the growth. Sequence only for the reversal: the long end’s turn begins between 09:05 and 09:40 ET, before the 09:45 Chicago PMI print, so that release amplified the retracement and cannot be shown to have initiated it. The intraday path is from the TradingView yield series, which is a different measurement from CMT and is used here for shape only; its basis-point magnitudes are not mixed with the CMT table above.
The one artery, and it is not an economic one. The day’s dominant price formation was the final hour: 1.37 billion of 3.13 billion shares, 43.82% of session volume at 4.68 times the prior six-hour pace, 41.20 points, and four indices closing at their exact lows with all eleven sector proxies in the bottom 30% of range, the highest at 27.2%. That is the shape a quarter-end market-on-close imbalance leaves, and on that reading it carries no information about the economy at all. No imbalance figure was obtainable on this stack, so the mechanism is inferred from the volume distribution and the close positions rather than observed, and the copy is hedged accordingly. The index had been up 0.6784% at its 15:30 UTC hour high, so the inflation print was received correctly and then overwritten.
Cross-asset. Dollar +0.0838%, 71.5% of it the euro leg across a six-leg rebuild closing to a 0.9% residual, which is a notably thin dollar response to a 5 basis point move at the thirty-year. VIX 16.34, +0.30. December gold settled 4,186.7, +0.1675%, with the aligned carry, December settlement minus spot at the 13:00 ET hour close of 4,151.45, at 35.25 against a re-specified band of 25.43 to 39.49, comfortably inside. December silver -0.9599% and December copper +0.2726%, so the metals complex disagreed with itself and this was not a complex-wide move. November WTI +1.1636% to 90.42 whilst the same-date November-December backwardation narrowed to 2.00 dollars from 2.13: flat price up, prompt urgency down, which is a positioning signature rather than a supply scare.
Fed communication. Governor Cook spoke at a rural conference and repeated the unanimity disclosure verbatim two days after Oakland: “As you know, I voted along with the rest of the FOMC to raise rates 25 basis points at the recent September meeting.” Second independent primary instance for that claim, read from the speech text at federalreserve.gov. Flagged for Phil: a 25 basis point hike on 16 September sits awkwardly beside the Weathervane’s “frozen for most of the year” clause, which is carried unchanged this edition because §17.2 requires a pre-stated condition for a rewrite and none exists. Chicago’s president spoke at 17:10 ET, after the bond close, and the event page returns 404 so nothing is quoted. A calendar asserted a Richmond speech on 30 September and four Board governors today; the Board’s own speeches page, read twice with a cache-bust, carries no entry for either, and the Richmond bank’s own page carries nothing. Nothing is attributed to any of them. The correct characterisation for today’s names is that no primary source exists yet, not that the events are not happening.
Overnight Excitement (§8.5)
FIRED, and the decision is flagged because the two legs disagree. December NQ moved +1.3299% overnight, clearing the 1.0% trigger. December ES moved +0.5832%, inside the 0.3-0.6% silent band. §8.5’s trigger text reads “US equity futures move more than 1.0% overnight” without restricting the instrument to the S&P contract, so the reading taken is that NQ fires it. The ES-only specification sits in §8.4.1, which is the separate noteworthiness gate and reads NONE. Both readings are recorded; Phil’s call if he wants it narrowed.
🔴 AND THE §11.9.1 DRIFT GATE EXPOSED A GAP IN ITSELF, WHICH IS THIS EDITION’S CHEAPEST SPEC FINDING. Re-quoted at 07:55 UTC, December NQ reads +0.4471% against its prior close and December ES +0.0032%. So NQ has crossed from FIRES to SILENT and ES is now effectively flat. The price drift is only minus 0.8712% on NQ and minus 0.5766% on ES, both comfortably inside the 2% refresh threshold, so the drift gate passed all four live keys clean. §11.9.1 measures distance travelled by a PRICE; it cannot see a figure crossing a THRESHOLD. A 0.87% price move moved a section from fired to unfired. The section is kept because the overnight move and its dispersion genuinely occurred and the capture is stamped with its bar window, and the copy in AVE, Inside Edge and the Snippet is requalified with the 07:55 re-quote rather than left to imply the gap persisted. Proposed: §11.9.1 gains a second limb, that any locked figure compared against a specification threshold is re-checked against its distance to that threshold, not only against a 2% price move.
Catalyst: Micron reported its fiscal fourth quarter past the cash close at roughly 20:25 UTC. On syndication, Tokyo’s memory and semiconductor-equipment names did the lifting whilst Korea and Singapore opened lower and Hong Kong was closed for the National Day holiday; all three of those are attributed direction, not retrieved levels. No non-US cash index level is published and none was hunted (§8.5, and no tier-1 route to any non-US cash index exists on this stack; a syndicated Nikkei level was offered and declined). Direction is carried qualitatively with attribution, which §12.3 permits; levels are not. The dispersion is the content: a 0.75 point gap between two US index futures on one night is a sector bid, not an index bid, and NQ was the only one of the four contracts to trade below its prior close before reversing.
Closure tests, and these are closure tests only and not direction proxies. China: closure demonstrated. SSE:600519 returned bars through 30 September with 1 October absent, consistent with the National Day holiday. Japan: open. TSE:7203 carries a 1 October bar.
Forward catalyst slate
- Today, 1 Oct. Initial jobless claims 08:30 ET. S&P Global manufacturing PMI final 09:45. ISM manufacturing 10:00, prior 54.6 agreed on both routes; the forecast conflicts between routes and no point figure is published for it. ISM prices 10:00. Construction spending 10:00, forecast 0.0% against -0.5% prior, both fields agreed. Natural gas storage 10:30. 4-week and 8-week bill auctions 11:30. Accenture and Nike report, both corroborated on two routes. Nike closed Wednesday at 35.40 dollars.
- Friday 2 Oct. Non-farm payrolls 08:30 ET, forecast 90,000 against 162,000 prior, and every field in the 2 October set agrees across both calendar routes. Confirmed publishing on schedule against the Bureau of Labor Statistics’ own October release schedule, which carries no lapse or revised-date notice.
- Not this week, and it is commonly misplaced: there is no coupon auction between 29 September and 5 October. Verified by exhaustive enumeration with a date filter; seven auction records from 25 September onward are all bills.
- 6 to 8 Oct. A 3-year note on the 6th, a 9-Year 10-Month note on the 7th and a 29-Year 10-Month bond on the 8th. Those two term strings are the reopening signature and do not read as 10-year and 30-year. No sizes are published: offering amounts are null on all three, so they are not yet announced.
- 11 Dec. The continuing resolution expires, 71 days out. 2 of the 12 required appropriations bills have cleared the House floor and the Senate has advanced none.
- 28 Oct. FOMC. The relay puts a hold at roughly two-thirds and a further 25 basis point hike at roughly a third; tier 3, labelled, bucket orientation checked by hand against the 3.75% to 4.00% target range set on 16 September and not inverted this session.
Divergence flags
- The index and its own internals inverted in sign. The Nasdaq Composite closed +0.237% whilst the S&P, Dow and Russell closed red, and NYSE down volume beat up volume 2.0496 to one whilst Nasdaq up volume beat down volume 1.6081 to one. This is no longer a magnitude gap between index and breadth; it is opposite signs on the same session.
- NYSE new lows 113 against 13 new highs, and Nasdaq 96 against 37. Barely improved from Tuesday’s 123 and 12. Not a resolution.
- A thin dollar on a long-end selloff. +0.0838% against a 5 basis point move at the thirty-year, less than half the prior session’s dollar response to a smaller long-end move. Flagged, not explained.
- The metals complex disagreed with itself: gold +0.1675%, silver -0.9599%, copper +0.2726%. No single monetary or industrial story reconciles the three.
- Crude rose whilst its own curve flattened. Backwardation narrowing on a rising flat price rules out prompt scarcity being priced, and it contradicts the available syndicated attribution to Middle East flows. No causal chain was established in either direction: no wire feed timestamp was placed against the intraday highs and lows, so the attribution is declined rather than reversed.
- Two independent crypto routes agreed more loosely than their established tolerance, 0.0379% on bitcoin against 0.0167% established and 0.0346% on ether against 0.011%. Same direction on both pairs, so a session characteristic rather than one feed drifting. Not a conflict at 31.69 dollars and 93 cents. Logged.
- Zacks and Stocktwits disagree completely on one name. A renewable-gas operator’s Zacks three-day attention growth collapsed fourteen-fold from 3.7059 to 0.2612 whilst its Stocktwits day volume held at exactly 75 and extremely high, the identical figure to the prior edition, on a 383-watcher base and a market capitalisation under half a billion dollars. Reported both, merged neither. The extremely-high reading is a thin-base artefact rather than a crowd.
Carry-over note (§10.6): does not fire. §8.4.1 did not trip on any leg and Phil has flagged no catalyst.
Regime and sensitivity read (§17.3)
Running LOOSE, thirtieth consecutive edition, stated openly rather than presented as neutral. The diagnosis is unchanged and remains specification rather than tuning.
Turn condition: 2 sessions in which a dated Federal Reserve communication moves DGS2 by 10bp or more whilst DGS30 moves by less than half. Progress 0 of 2. NINTH consecutive miss, and the second in a row to fail both limbs outright. DGS2 moved 1 basis point against a 10 basis point magnitude floor, and DGS30 moved 5 against a permitted 0.5. The attribution limb was not tested at all, because the mover was a data set and not a communication. §18’s Lesson 51 diagnosis stands: each limb is individually reachable, the conjunction has not arrived in nine attempts, and lowering the floor produces a condition that fires on half-evidence.
Four regime-grade observations this session and the tripwire saw none of them. A market-on-close imbalance supplying 43.82% of a session’s volume and setting four indices’ lows. A beat-and-guide-up falling 10.0301% whilst a guide-down rose 3.8389% in the same hour. A 69.52% net margin disclosed into a session that had already closed three cents higher. And a curve finishing on opposite sides on one data set for a second consecutive session, with the intraday path showing the two ends moved together at every turning point and differed only in retracement amplitude.
That last point is a correction to this book’s own eighth instalment and it matters. The daily closes licensed the reading that the two ends moved in opposite directions. The intraday path says they gapped the same way at 08:30 and rose together from 09:05; the opposite-sign closes are unequal retracement, not opposed direction. The honest ninth instalment is not “the ends diverged” but “the ends moved together and only the finish line differed.”
Recommendation order, unchanged at the top, with one addition at five:
- Two-sided volatility leg. Fourteen editions overdue. Vindicated a ninth time: VIX finished 16.34 on a session that produced a quarter-end liquidation and four index lows, and moved 0.30.
- Split the turn condition into two separately-scored legs. Nine attempts, each limb individually reachable, never together, now two consecutive sessions failing both.
- Breadth-versus-index leg built on the new-high COUNT rather than the advance/decline ratio. The ratio travelled 0.703 to 0.5761 whilst the new-high count went 12 to 13. The count remains the stable signal.
- A leg on front-end-versus-long-end ORDERING rather than transmission magnitude, as recommended last edition, now additionally requiring an intraday path before any ordering claim is made at all.
- 🟢 NEW: a leg on calendar-driven price formation. No current candidate can express a session in which the dominant price-setting mechanism is a rebalancing deadline rather than information. The tripwire is built entirely on levels and spreads and is structurally blind to where in the session the volume arrived.
Duration flag: ordinary. The long end led the curve higher for a second consecutive session, +5 at the thirty-year against +4 at the twenty-year, and the twenty-year held as strictly the curve’s high point for an eighth session. The heading is working.