MACD-v At Bullish Extreme Signals Continuation Not Reversal – 21 Years Of 30-Minute Data Says So
 Ahoy there, Trader! ⚓️
It’s Phil…
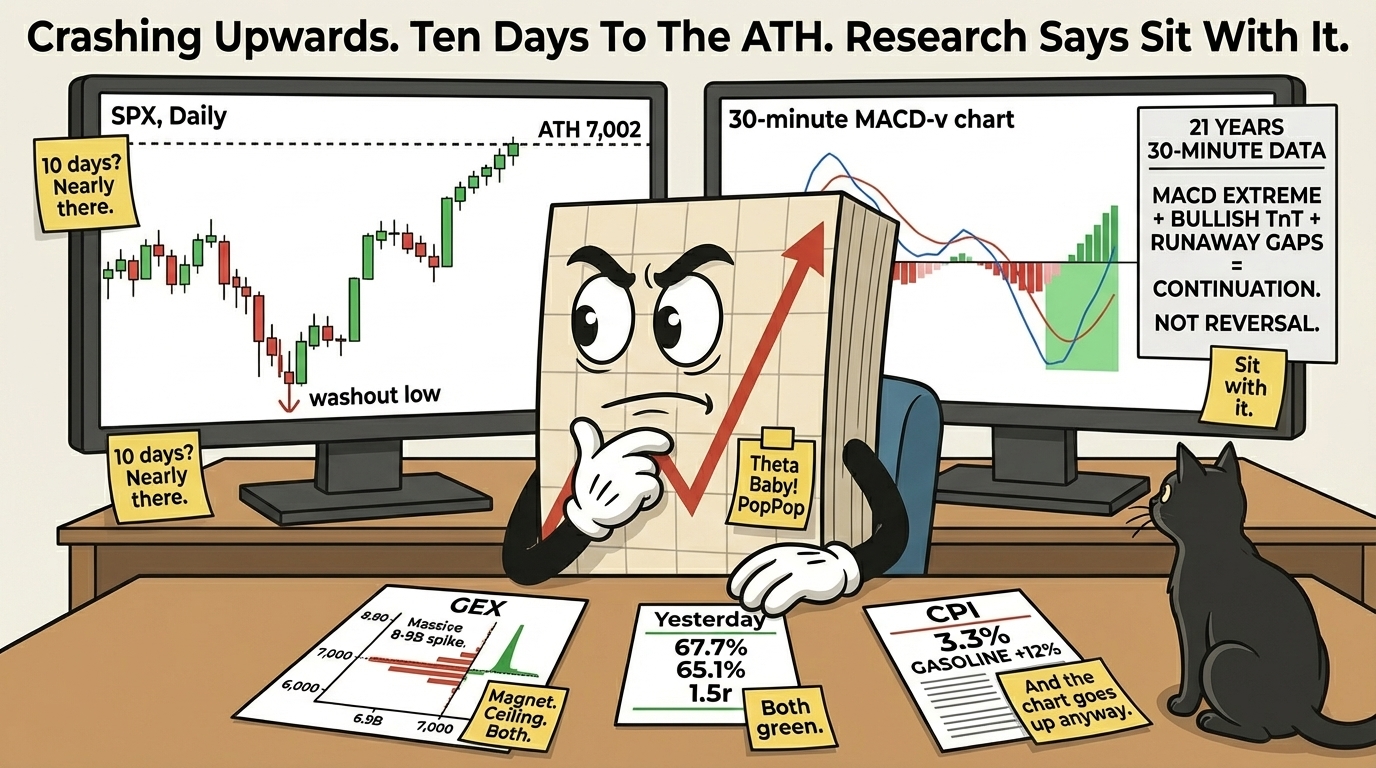
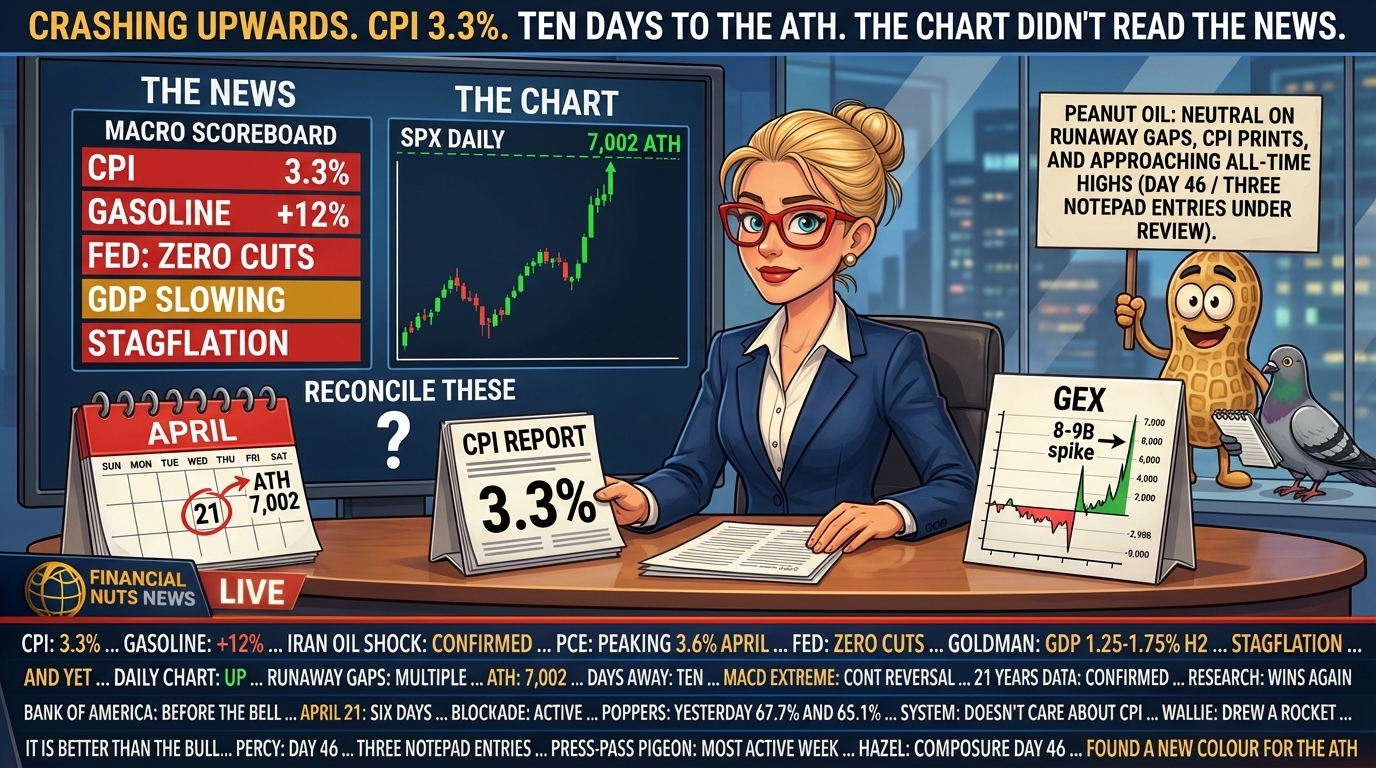
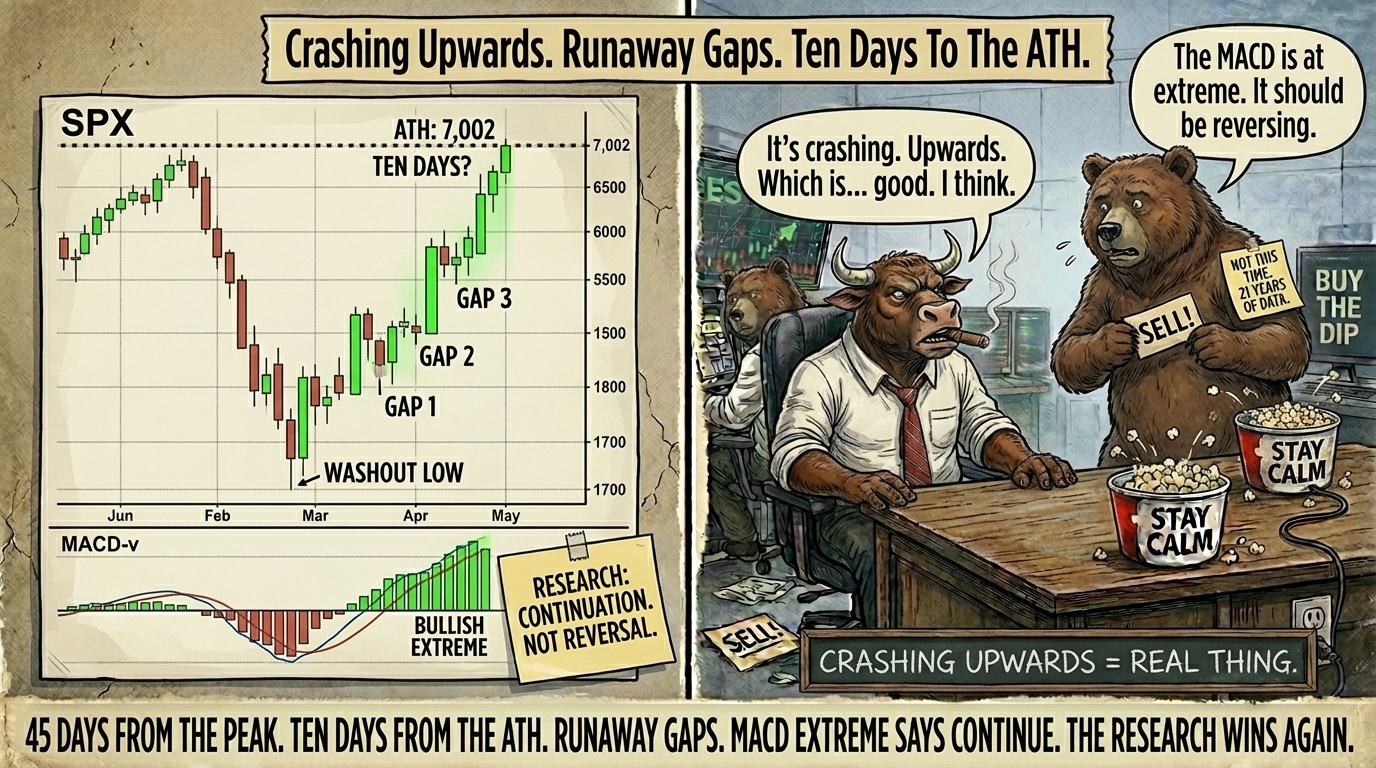
Crashing upwards.
These vertical moves are making me nervous. Futures are obviously gapless — but when you look at the same moves on the daily SPX and RUT charts you can clearly see runaway gaps with barely a downtick. And before you know it we will be popping that new all-time high. Forty-five days down from the peak and only ten days away from peeking at it. Nearly there. The speed of movement is really inverted compared to everything we have been used to in this conflict.
The MACD-v in those bullish extremes is actually highlighting the continuation signal as opposed to the reversal — which is an interesting finding. And another one that came directly from my 21 years of 30-minute data research. Worth noting and worth sitting with.
On the macro side: March CPI landed at 3.3%. Gasoline up 12% — the Iran war oil shock doing exactly what Goldman warned. PCE forecast to peak at 3.6% in April. Fed is frozen. Zero rate cut probability priced. Goldman now sees US GDP cooling to 1.25-1.75% in H2. That is stagflation, not a soft landing.
And yet the daily charts are going up like a rocket.
GEX levels are being smashed through. The new ceiling is at 7,000. A peekaboo to a new all-time high and we will see whether this continues to travel or starts to unravel. Futures down 1% this morning. Bank of America reports before the bell. The blockade holds. April 21 is six days away.
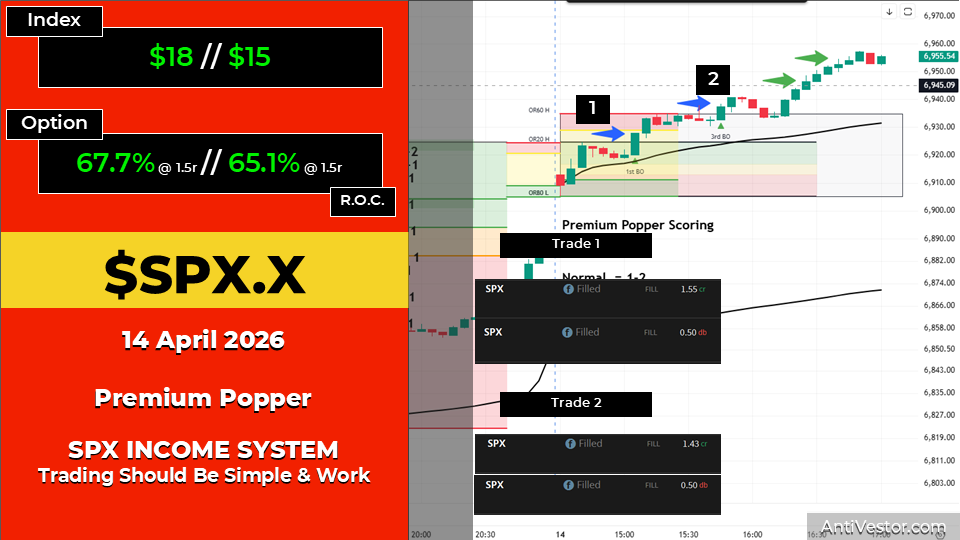
Yesterday’s premium poppers popped nicely. The day had a moderate scoring for 1.5x risk. Two poppers — a 1st BO and a 3rd BO — both paid. As always, waiting for the opening bell to pop some more premium.
Runaway Gaps. MACD Extreme Says Continuation. 7,000 Is The New Ceiling. Ten Days To The ATH Peek.
Get The Complete Premium Popper System – Automation Included
Your entry ticket to consistent SPX income. Inside: the exact setup, rules, and checklists I trade daily – for less than the cost of lunch. Easily actionable.
Get The Premium Popper System – Click Here

Market Briefing:
Wednesday 15 Apr – Bank of America / CPI morning.
- Tuesday closed: S&P +1.02% to 6,967 / Dow +301 to 48,218 / Nasdaq +1.23% — recovery on renewed second Islamabad talks chatter
- Runaway gaps visible on daily SPX and RUT / barely a downtick / MACD-v at bullish extreme
- 45 days from the peak / 10 days from peeking at a new ATH
- March CPI (overnight data):
- 3.3% headline / gasoline +12% / Iran oil shock confirmed
- PCE forecast to peak 3.6% April / Fed frozen / zero cut probability
- Goldman: US GDP cooling to 1.25-1.75% H2 2026 / stagflation not soft landing
- Premarket: S&P futures -1% / Nasdaq -1.3% / Dow -350 points / VIX climbing
- Brent above $100 / WTI near $99 / ceasefire expires April 21 / six days
- Bank of America reports before the bell: NII +7% expected / Merrill Lynch at record $4.1T client balances
- GEX ceiling smashed to 7,000 / both walls at 7,000 / new peekaboo territory
- Wednesday read: continuation signal from MACD-v extreme / wait for bell / runaway gaps building toward NATH
Market Snapshot
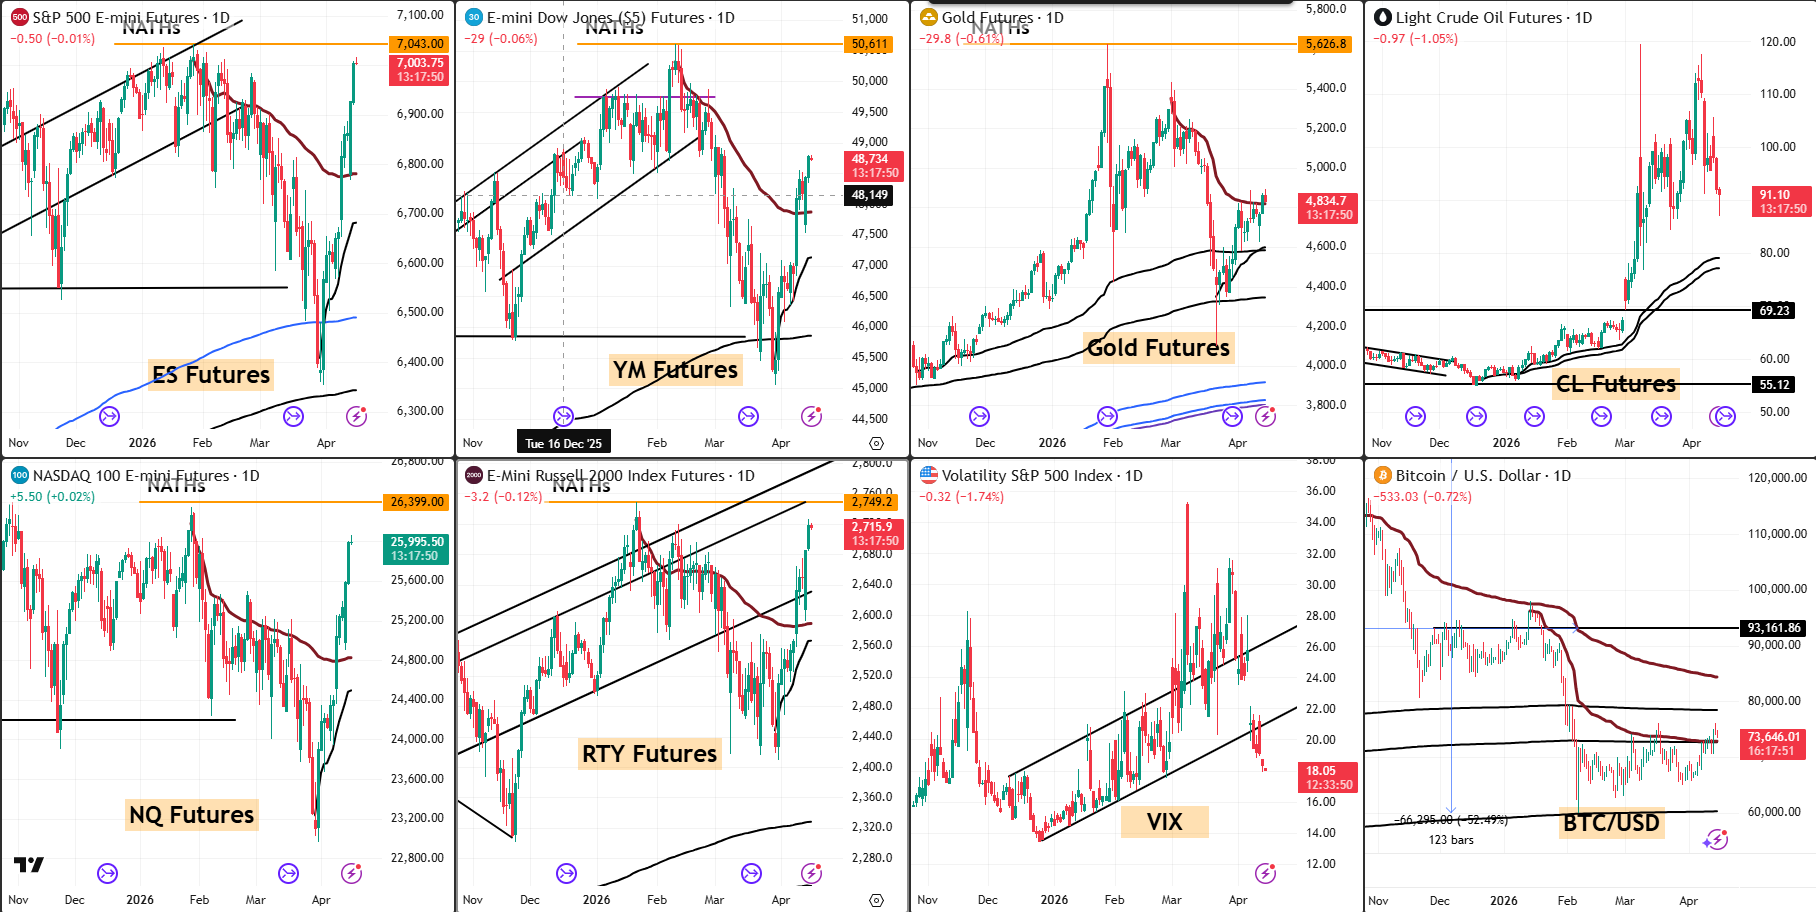
- ES: 7,003.75 / -0.50 (-0.01%) / runaway gap daily chart / 7,000 level reached
- YM: 48,734 / -29 (-0.06%) / Dow holding near ATH range
- NQ: 25,995.50 / +5.50 (+0.02%) / Nasdaq nearly reclaimed
- RTY: 2,715.90 / -3.20 (-0.12%) / Uncle Russell keeping pace
- GC: 4,834.70 / -29.80 (-0.61%) / inflation premium / near record
- CL: 91.10 / -0.97 (-1.05%) / WTI easing slightly / blockade active
- VIX: 18.05 / -0.32 (-1.74%) / compressing / below 22 / trendline watching
- BTC: 73,646.01 / -0.72% / range-bound / zero cuts and $99 oil explain it
Tag ‘n Turn
Both instruments bullish and the MACD-v at bullish extreme is producing a continuation signal not a reversal — 21 years of 30-minute data says so. Runaway gaps on the daily. Waiting for the bell before engaging. The vertical move is real but nerve-wracking.
The key finding from the research is worth repeating here. In most configurations a MACD-v at extreme would suggest a pause or reversal is due. But the data from 21 years of 30-minute research shows that in the context of a confirmed bullish TnT with runaway gap conditions, the extreme is a continuation signal — the market is going, not exhausted. That finding is what makes the current setup both exciting and uncomfortable in equal measure. Both instruments remain bullish. The ATH is ten days away if the pace holds.
SPX Analysis
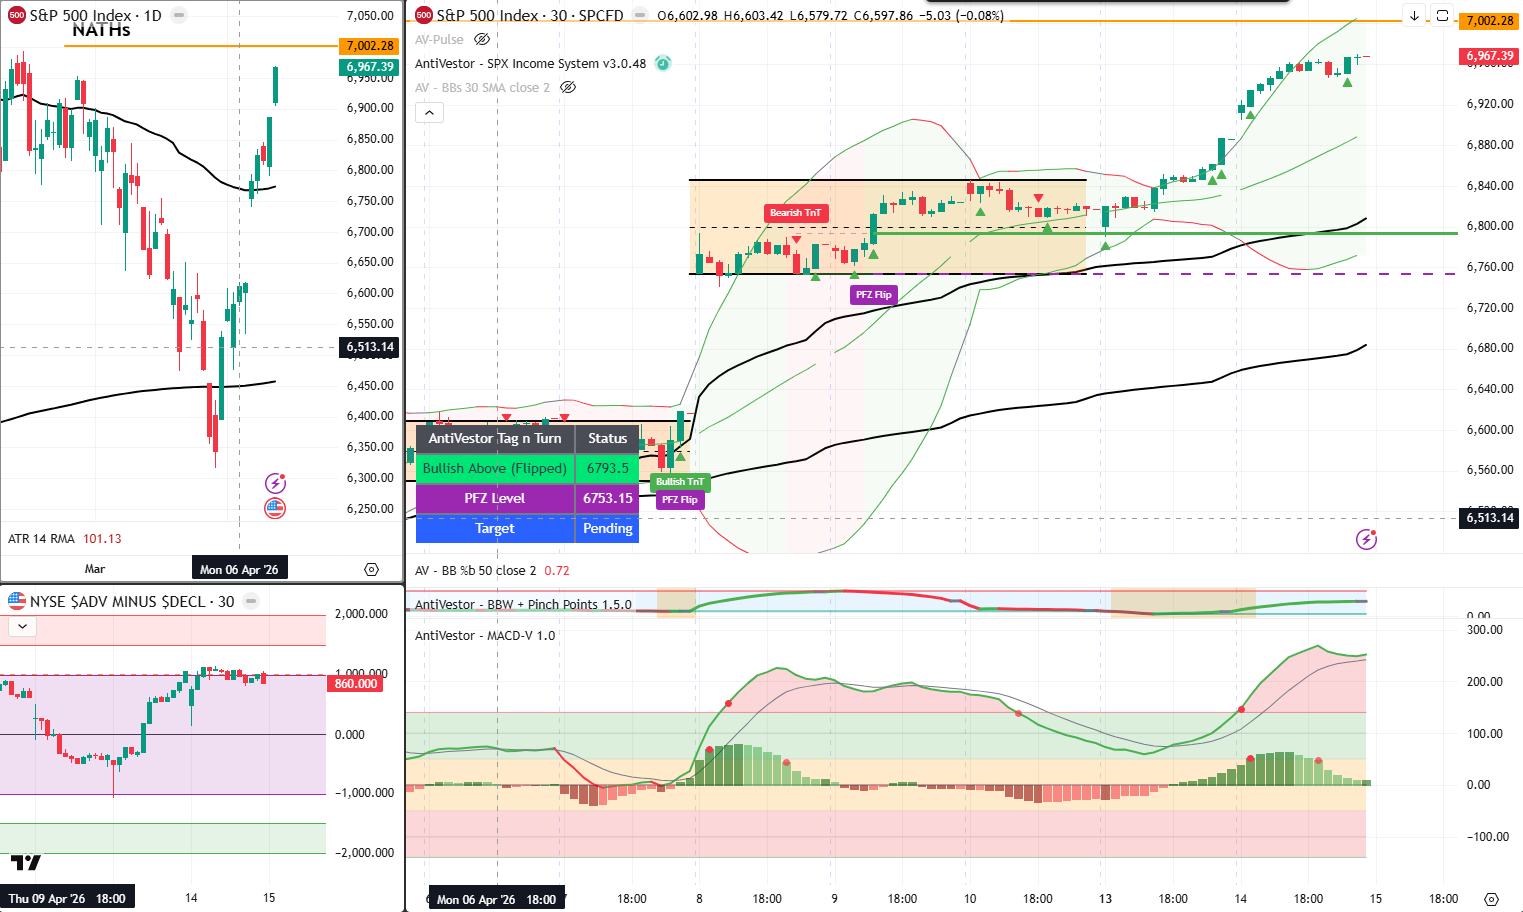
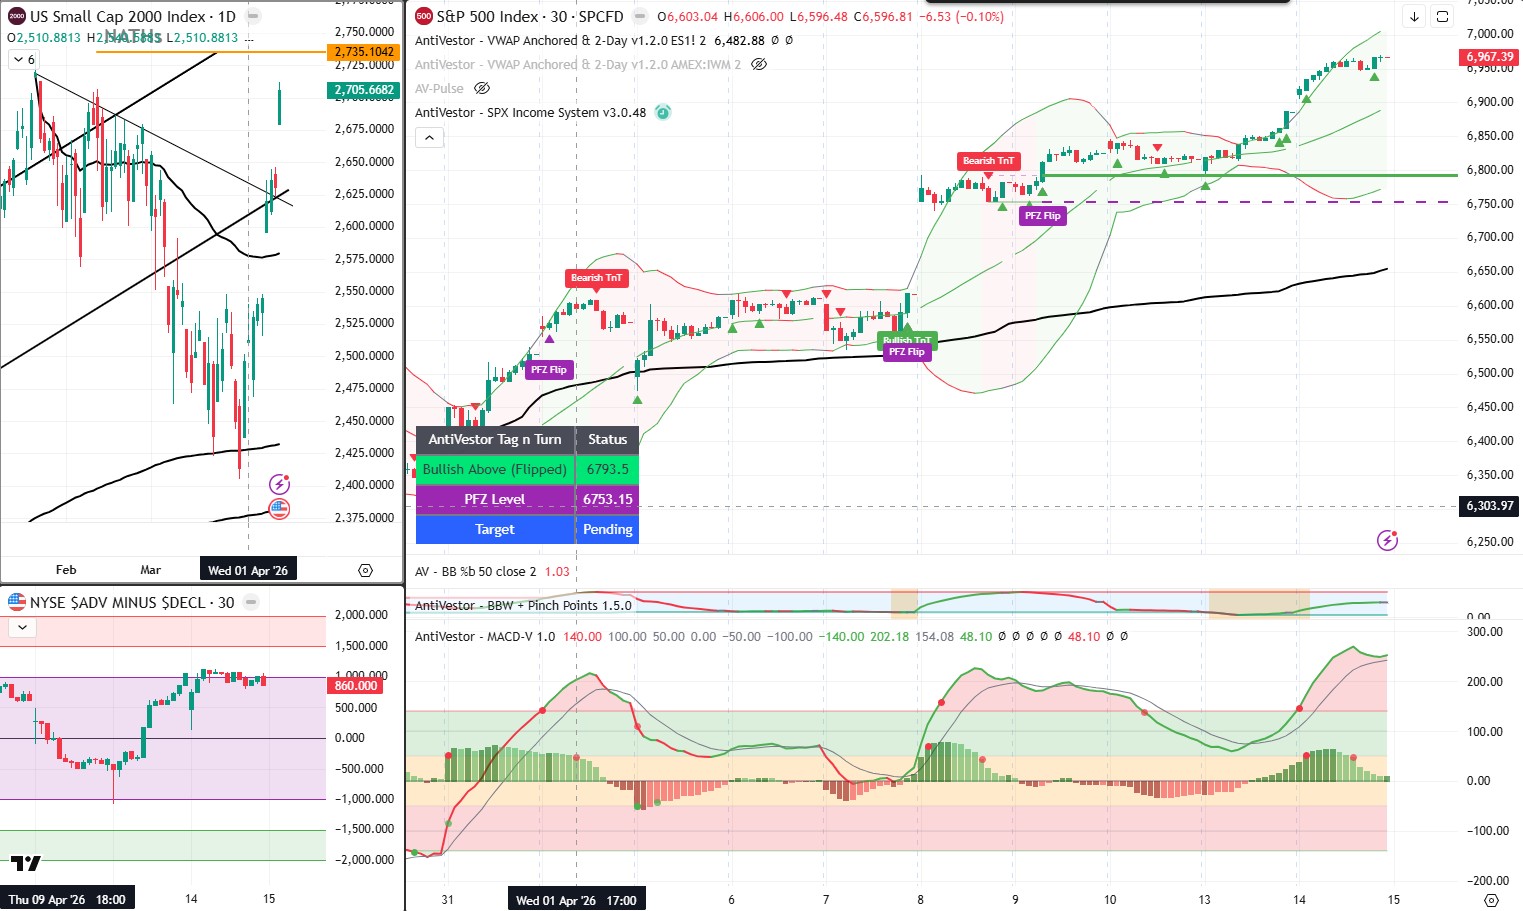
Bullish above 6,793. Runaway gaps on the daily. MACD-v at bullish extreme — research says continuation. GEX ceiling at 7,000. ATH 7,002 just overhead. Ten days. Nearly there.
The daily chart tells the story more clearly than the 30-minute here. The sequence of runaway gaps — sessions that open above the prior close without a meaningful downtick — is the technical signature of a momentum move that has not yet exhausted itself. The MACD-v is at a bullish extreme on the 30-minute but the 21-year data study says this is the continuation pattern rather than the reversal pattern in these conditions. The ATH on SPX is 7,002.28. Futures touched 7,003 overnight. The peekaboo is not theoretical — it is imminent. The question is whether the GEX ceiling at 7,000 holds price there or allows it to travel beyond.
Current Status: Bullish Above (Flipped) 6,793 / PFZ 6,753 / Target Pending
Gamma Exposure
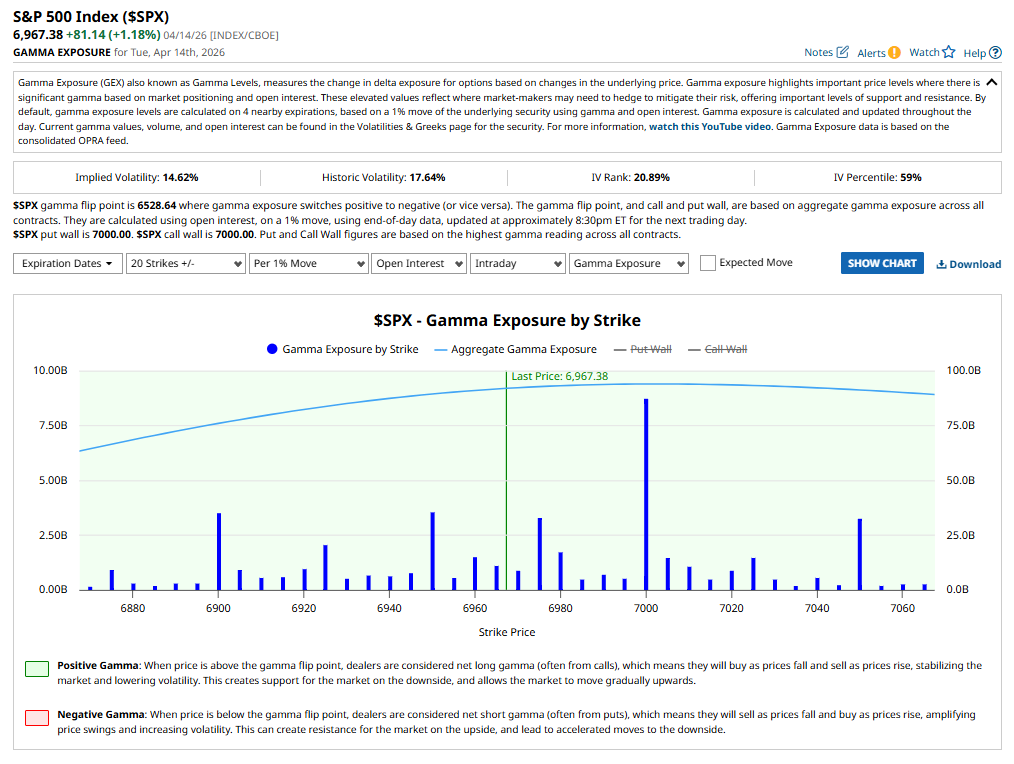
GEX ceiling smashed to 7,000. Massive 8B+ spike at 7,000. Both walls at 7,000. Flip point 6,528. IV 14.62% well below HV 17.64%. IV Percentile 59%. The 7,000 level is simultaneously the magnet and the ceiling.
This is the most significant GEX reading of the conflict period. The gamma spike at 7,000 is at approximately 8-9B — the largest concentration seen since the briefings began. Both the put wall and call wall have converged at 7,000. The flip point at 6,528 gives 439 points of positive gamma cushion below current price — the deepest cushion of the conflict. IV at 14.62% against historic vol of 17.64% — the market is pricing exceptional calm. IV Percentile at 59% continues its remarkable compression. The 7,000 level is the pivotal zone: the concentration of gamma there means price is being mechanically pulled toward it, but also means dealer selling will cap the move as price touches it. Peekaboo to the ATH — yes. Clean through it on the first attempt — that is the question.
Current Status: Strongly positive / flip point 6,528 / massive gamma at 7,000 / both walls 7,000 / IV 14.62% below HV / IV Percentile 59% / 439-point cushion
RUT Analysis
Uncle Russell also running with runaway gaps. Same MACD-v bullish extreme continuation signal. Bullish above 6,793. Pace matching SPX. The move is real on both instruments.
RUT has been tracking SPX’s vertical move with its own runaway gap sequence on the daily. The MACD-v on the 30-minute is at the same bullish extreme as SPX — and the same data finding applies. Continuation, not reversal, in this configuration with this TnT context. Both instruments are aligned and both are approaching meaningful overhead levels. The same question applies to RUT: travel or unravel at the ceiling.
Current Status: Bullish Above (Flipped) 6,793 / PFZ 6,753 / Target Pending
Post Trade DeBriefing – 14 Apr 2026
SPX Premium Poppers: Moderate scoring day at 1.5r. Two trades, two wins. Clean and straightforward.
- Trade 1: 1st BO. 67.7% ROC from an $18 move. At 1.5r.
- Trade 2: 3rd BO. 65.1% ROC from a $15 move. At 1.5r.
2 trades / 2 wins / 0 losses.
The scoring was moderate — 1.5r rather than 2r — reflecting the day’s conditions. Both entries confirmed and both paid without drama. The system continues to deliver in conditions that would make most traders sit on their hands. Waiting for the bell to pop some more.
Rounding Off
Crashing Upwards The phrase sounds wrong because we are conditioned to associate the word crash with downward movement. But the daily chart is doing something genuinely unusual — runaway gaps on consecutive sessions, barely a downtick, vertical price action in a conflict that was 10% down across all major indexes just three weeks ago. The speed of the recovery is the inverted version of the speed of the selloff, which was itself described at the time as too slow to be a crash. Now the recovery is too fast to be comfortable. The MACD-v research resolves the discomfort: it is continuation, not exhaustion.
Ten Days The ATH on SPX is 7,002. Futures touched 7,003 overnight. Forty-five days after the peak, ten days may be all it takes to peek at a new one. The conflict is ongoing. The blockade is active. The ceasefire expires April 21. And the chart is approaching the all-time high anyway. That is the market’s assessment of the situation.
Bank of America NII expected up 7% year-on-year. Merrill Lynch at a record $4.1 trillion in client balances. Arriving into CPI at 3.3%, oil at $99, and a Fed with zero cut probability. The consumer credit commentary from Bank of America — its bread and butter — is today’s equivalent of Goldman’s FICC read: the number the market will focus on beyond the headline beat or miss.
April 21 Six days. The blockade is active. Trump told the New York Post a second round of talks could happen within days. Deal or escalation is still the binary. The market is pricing deal. The blockade is pricing escalation. These two facts are unresolved and the clock is running.
Current Status: Crashing upwards / runaway gaps / MACD-v continuation / GEX ceiling 7,000 / ATH 10 days / BofA before bell / April 21 six days / blockade active
Expert Insights
“It was never my thinking that made the big money for me. It was always my sitting. Got that? My sitting tight.”
— Jesse Livermore, documented in Edwin Lefèvre “Reminiscences of a Stock Operator,” Doran, 1923, public
Different quote from the two prior Livermore uses in this session. Applied today specifically: the vertical move is nerve-wracking precisely because it demands sitting rather than reacting. The instinct when the MACD-v hits an extreme is to anticipate the reversal and position accordingly. The 21-year research says the opposite — in this configuration, the continuation is the higher-probability outcome and the big money is in sitting with it. Two poppers at 1.5r. Two wins. The bell rings shortly. The sitting continues.
[Source: Jesse Livermore, as documented in Edwin Lefèvre — Reminiscences of a Stock Operator, George H. Doran Company, 1923, public domain]
AI-BotView
 Beep-Beep, Trader
It’s Cachè-AI-Bot,
Cachè-AI terminal in the corner of the newsroom. The Hormuz Blockade Risk Assessment Week 2 is at 19 pages. Page 16 covers the ATH-approaching-under-blockade scenario. Page 17 covers what happens if both the ATH and the April 21 deadline arrive in the same week. Nobody asked for page 17. The terminal is processing the implications of both events on the same calendar. It is always processing.
Beep-Beep.
1 – March CPI at 3.3% with gasoline up 12% confirms the Iran war oil shock is transmitting to headline inflation at approximately the rate that energy economists would model for a Hormuz disruption of this duration. The transmission lag from crude oil to pump prices to CPI is typically four to eight weeks. [Source: Bureau of Labor Statistics CPI release, March 2026, bls.gov, public | Federal Reserve research on energy price pass-through, federalreserve.gov, public]. The war began February 28. The March CPI survey period ends approximately March 28. Four weeks of oil shock is what the March print captures. The April CPI — released in mid-May — will capture the full month of blockade-era oil prices plus any ceasefire reversal effects. The April print will be the most informative data point of the entire conflict period for the Fed.
2 – Runaway gaps on the daily chart in the context of a V-shaped recovery from a 10% correction represent a specific technical pattern with documented statistical properties. A runaway gap — also called a continuation gap — occurs when price opens significantly above the prior close in the middle of an established trend rather than at the beginning or end. [Source: Edwards and Magee — Technical Analysis of Stock Trends, 9th edition, AMACOM, public | John Murphy — Technical Analysis of the Financial Markets, NYIF, public]. In documented historical studies, runaway gaps in confirmed uptrends have a continuation rate above 70%. The distinction from exhaustion gaps — which appear at the end of a move and quickly get filled — is confirmed by the MACD-v behaviour: exhaustion gaps typically coincide with MACD divergence; continuation gaps coincide with MACD confirmation. The current configuration matches the continuation pattern.
3 – The GEX concentration of approximately 8-9B at the 7,000 strike creates a specific mechanical dynamic as price approaches the all-time high. The 7,000 level is simultaneously the ATH reference zone, the put wall, the call wall, and the largest single gamma concentration since the conflict began. [Source: SpotGamma GEX data, $SPX Gamma Exposure, 14 April 2026, spotgamma.com, public]. Dealer hedging at this level involves both call writing above 7,000 — suppressing upside momentum as price approaches — and put protection below 7,000 — supporting price if it fails to break through. The practical result: 7,000 is likely to be a magnetic target that price approaches, tests, and consolidates at before either breaking through or rejecting. A clean first-attempt break above 7,000 into new ATH territory requires either a significant new catalyst or sufficient momentum to overwhelm the dealer positioning. The April 21 ceasefire outcome is the most likely source of either.
Beep.
This Bot potentially hallucinates. Maybe. OK, Probably! Page 17 covers the ATH-and-April-21-deadline coincidence scenario. It runs to three pages. Nobody asked. The calendar implications are on page 17. Processing.
In Other News…
March CPI: 3.3%. Gasoline up 12%. The Iran war oil shock is now officially in the inflation data. PCE forecast to peak at 3.6% in April. The Fed has zero cuts priced for 2026. Goldman forecasts US GDP at 1.25-1.75% in H2. That is stagflation.
The daily SPX and RUT charts are going up like a rocket anyway.
Runaway gaps. Barely a downtick. Forty-five days from the peak, the all-time high is ten days away. Futures touched 7,003 overnight. The ATH is 7,002.28. The peekaboo is imminent.
Bank of America reports before the bell. Goldman beat Monday — profit up 19%, record equities, FICC miss, shares -2%, Solomon warning on Q2-Q3. Bank of America has Merrill Lynch at a record $4.1 trillion in client balances. The consumer credit commentary is what the market is watching.
The blockade is active. The ceasefire expires April 21 in six days. Trump told the New York Post that a second round of talks could happen within days. The market is pricing deal. The chart is pricing continuation. The calendar is pricing April 21.
Percy Peanut has reviewed the CPI print. Percy is neutral on 3.3% headline CPI. This is consistent with all prior positions. The press-pass pigeon has now written three entries in its notepad — the most active week of notepad activity since the conflict began. Percy is reviewing whether the notepad entries require a formal response. This review is ongoing.
Hazel’s Take:

Wednesday morning: March CPI 3.3% gasoline +12% Iran oil shock confirmed, PCE peaking 3.6% April, Fed zero cuts, Goldman GDP 1.25-1.75% H2 stagflation not soft landing, Bank of America before the bell NII +7% Merrill Lynch record $4.1T, futures -1% Nasdaq -1.3%, daily SPX and RUT showing runaway gaps barely a downtick, MACD-v at bullish extreme says continuation not reversal per 21-year data, GEX ceiling at 7,000 massive 8-9B gamma, ATH 7,002 ten days away, April 21 six days, blockade active, yesterday two poppers 1.5r both green, waiting for bell. Crashing upwards. The research says sit with it.
Rumour Has It…
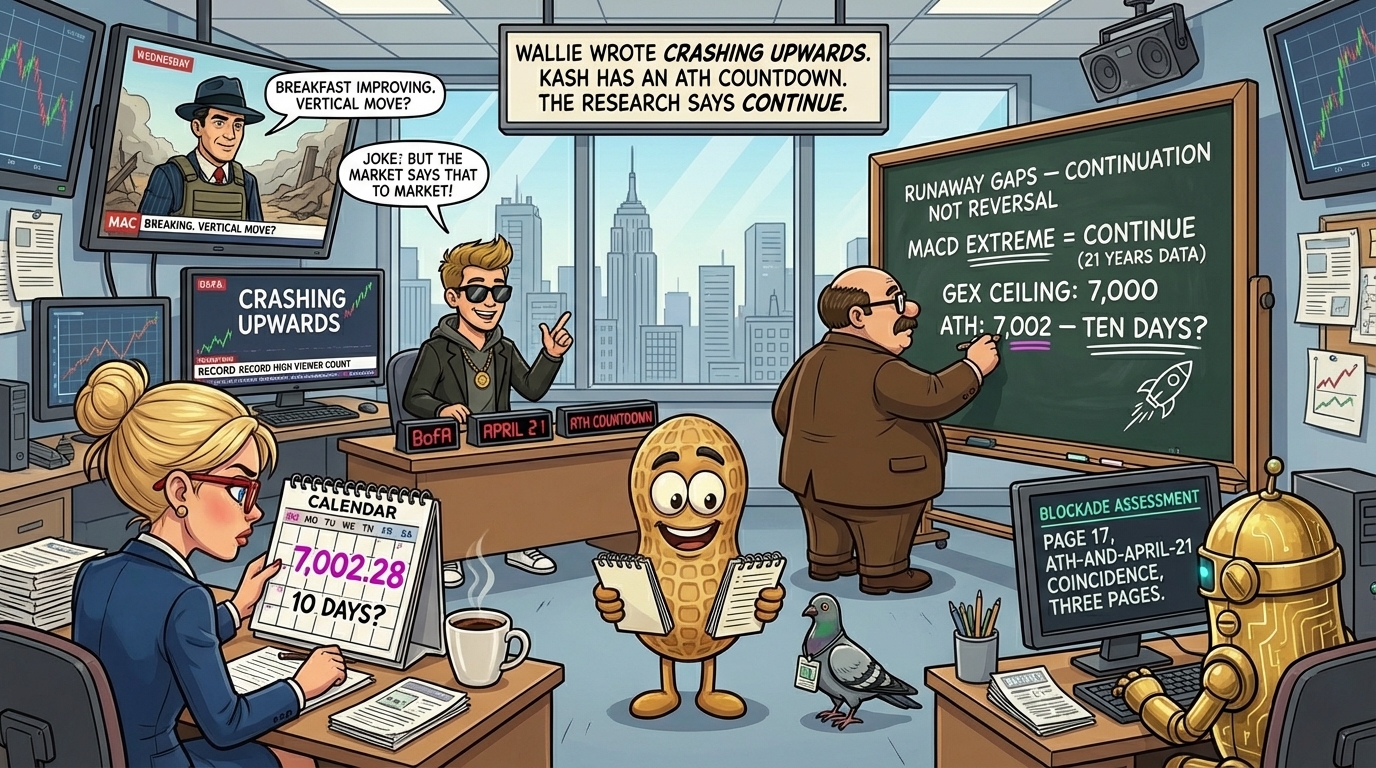
Hazel has added a new entry to the calendar beside the ATH level. She has written “7,002.28” in a different colour from all the other entries. Below it: “10 DAYS?” She has looked at this for a moment. She is not sure what colour a potential new ATH gets. She has not used that colour before. Day 46. The double espresso is structural at this point.
Wallie has updated the chalkboard. “CRASHING UPWARDS” in large letters at the top. Two underlines. Below: “RUNAWAY GAPS — CONTINUATION NOT REVERSAL.” Below: “MACD EXTREME = CONTINUE (21 YEARS DATA).” Below: “GEX CEILING: 7,000.” Below, in even larger letters: “ATH: 7,002. TEN DAYS?” He has drawn a small upward rocket beside the ATH line. It is better than the bull silhouette. He has three underlines on ATH: 7,002. No hesitation.
Kash is standing. He has been standing since Monday. Stream title: “CRASHING UPWARDS – RUNAWAY GAPS – ATH IN 10 DAYS?” Three timers: Bank of America open, April 21 countdown, ATH countdown. He considered removing the ATH countdown as speculative. He kept it. His viewer count is at a new conflict high. Crashing upwards is apparently excellent content.
Mac has filed from a new location described as “appropriately elevated given the market’s trajectory.” He may be making a joke about the vertical move. He has not confirmed this. The flak jacket is on. The breakfast situation has improved slightly from adequate. He considers this progress. Return flight: not confirmed.
Percy is reviewing the press-pass pigeon’s three notepad entries. This is the most active notepad week of the conflict. Percy is not sure what the entries mean for the neutrality position. The review is ongoing. Day 46. The record continues.
Cachè-AI terminal in the corner. Blockade assessment at 19 pages. Page 17 covers the ATH-and-April-21 coincidence. Three pages. Nobody asked. Processing the calendar implications.
This is entirely made-up satire. Probably!
Breaking scoops courtesy of the Financial Nuts Newswire-because who needs sanity?

Fun Fact:
A runaway gap — also called a continuation gap — is one of three classic gap types in technical analysis, alongside breakaway gaps and exhaustion gaps.
The distinction matters because each type has a different implication for what happens next. A breakaway gap signals the start of a new trend. An exhaustion gap signals the end of one. A runaway gap occurs in the middle of an established trend, confirms its strength, and statistically tends to resolve with continuation rather than reversal.
The term “runaway” refers to the fact that the market is, quite literally, running away from the prior trading range — so fast that it leaves a void on the chart that price may not revisit for a significant period. The key diagnostic is that runaway gaps are rarely filled quickly. Exhaustion gaps almost always are.
The MACD-v behaviour at the time of the gap is one of the best ways to tell the two apart — which is precisely what 21 years of 30-minute data research has been mapping.
[Source: Edwards and Magee — Technical Analysis of Stock Trends, 9th edition, AMACOM — public |
John Murphy — Technical Analysis of the Financial Markets, New York Institute of Finance — public]
Meme of the Day:
Happy trading,
Phil
Less Brain, More Gain
…and may your trades be smoother than a cashmere codpiece
p.s. There are 3 ways I can help you…
- Option 1: The SPX Income System Book (Just $12)
A complete guide to the system.
Written to be clear, concise, and immediately actionable.
>> Get the Book Here

- Option 2: Full Course + Software Access – 50% off for Regular Readers – Save $998.50
Includes the video walkthroughs, tools for TradeStation & TradingView, and everything I use daily. Plus 7 additional strategies
>> Get DIY Training & Software

- Option 3: Join the Fast Forward Mentorship – 50% off for Regular Readers – Save $3,000
>> Join the Fast Forward Mentorship – trade live, twice a week, with me and the crew. PLUS Monthly on-demand 1-2-1’s
No fluff. Just profits, pulse bars, and patterns that actually work.