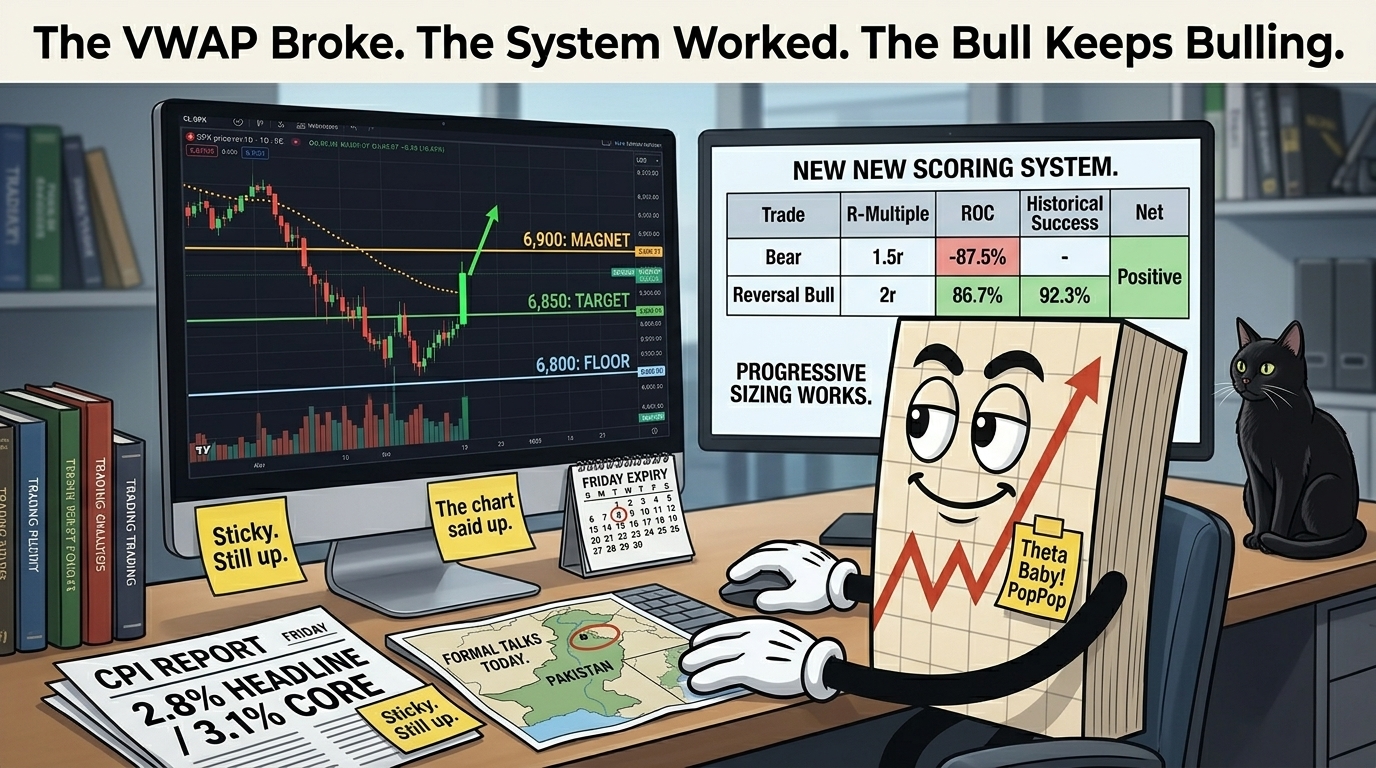
Premium Poppers 1 Win 1 Loss – New Scoring System Turned A Loss Day Into A Net Positive – Progressive Sizing Works
 Ahoy there, Trader! ⚓️
It’s Phil…
The bulls keep bulling.
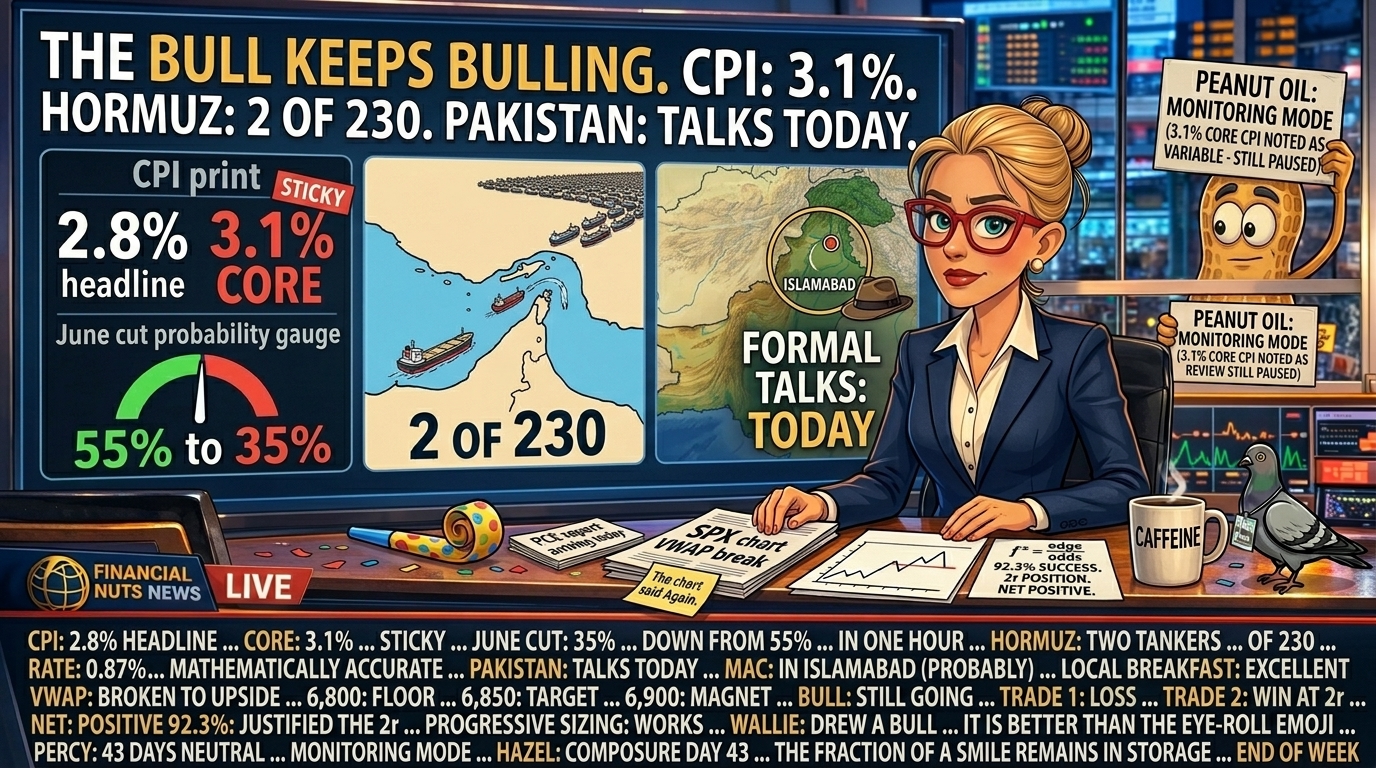
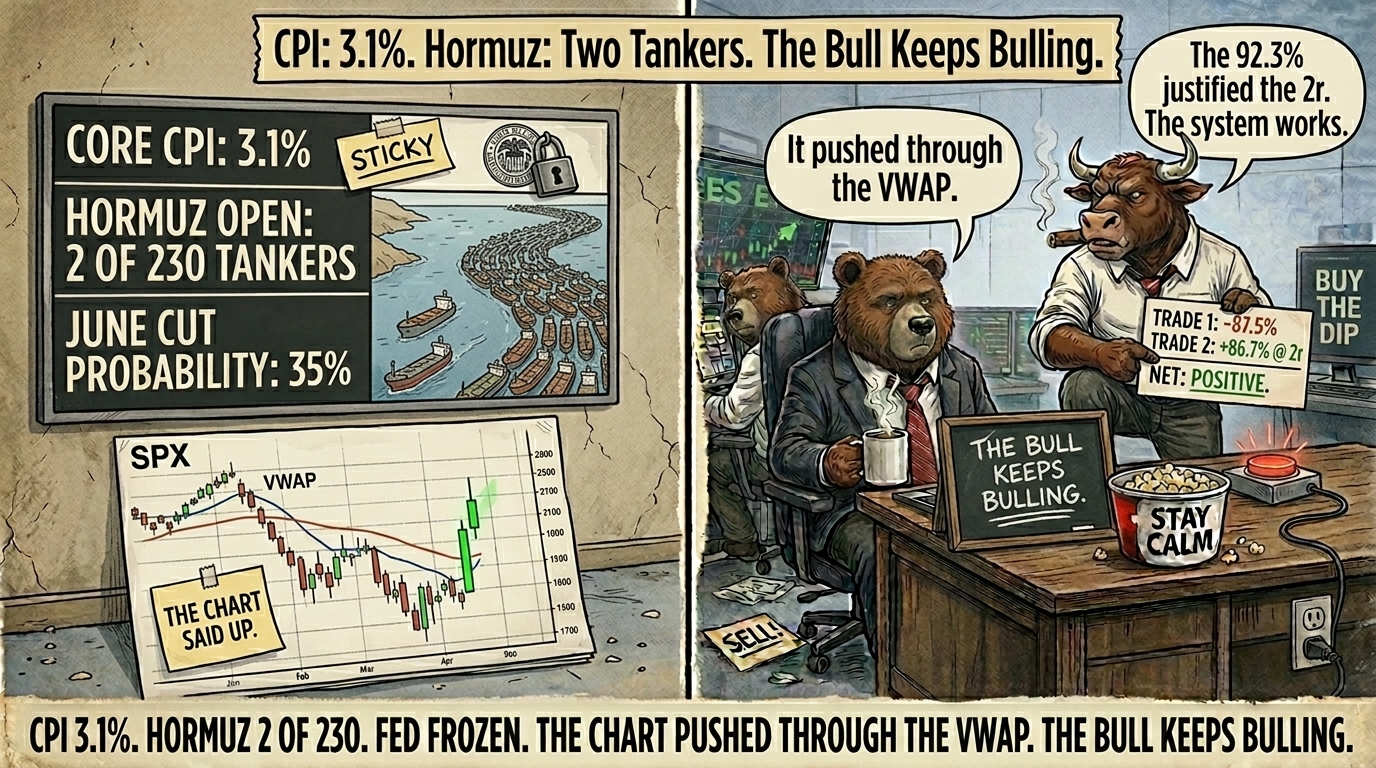
Then 8:30 ET arrived with March CPI. 2.8% headline, core 3.1%. Sticky. Stubborn. Energy-driven inflation bleeding into services. June cut probability collapsed from 55% to 35% within the hour. The Fed stays frozen at 3.50-3.75%. Powell’s term expires May 15. No successor named.
And yet the bulls keep bulling.
Yesterday’s moves pushed right through the falling VWAP. A retest for a bigger push higher and a potential challenge of the all-time highs seems likely – although in this current economic environment and global geopolitics it could well be a bumpy ride.
VIX has reclaimed the rising trendline, so I am going to suggest that is voided for the moment. That is a common infrequent short term pattern and does not change the broader read.
The ceasefire is 48 hours old. The Strait is not open. Iran is conditioning every vessel and claiming strategic control. Two tankers have crossed since the deal was announced. Two. Out of 230 stranded inside the Gulf. WTI is still at $97.87. Pakistan hosts the first formal US-Iran talks in Islamabad today – the first negotiations since the ceasefire began. Hot inflation, closed strait, cornered Fed, fragile truce.
As for my own positions – my bear swings got flipped. Shame, as I thought we might see at least a repeat of 2 April – a little flush lower before the pop higher. The no-touch of the lower Bollinger Band was at least spot on. I have not yet looked at the actual numbers but flipping back to bull cost me around 15-20% on the flip, and I am back bullish with a short term swing. I chose Friday expiry as I did not want to hold over the weekend – so that should be paying out nicely today. The bullish continuation certainly looks like a spot-on read with the new system upgrades.
GEX is looking all positive. More stability in the movement expected. 6,800 looks like the floor for the day and the remainder of the week. 6,850 could well be the high of the day – although should that break, 6,900 is the next magnet. Those whole and half numbers certainly draw price like magnets.
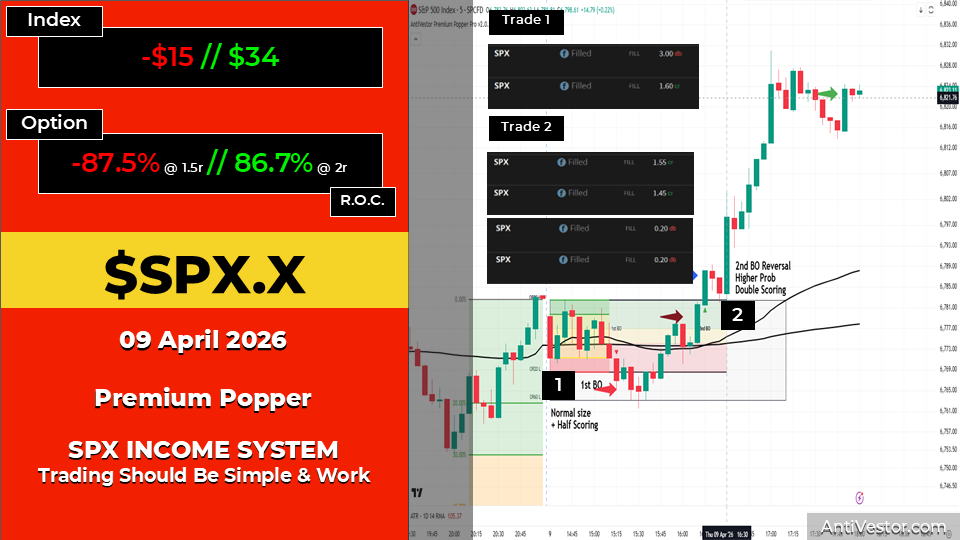
As for yesterday’s Premium Poppers – one win, one loss. But with the new scoring system’s progressive position sizing it turned a potentially losing day into a net positive. Bear trade at 1.5r, reversal bull at 2r. Overall net positive on the day. What is interesting is that despite the day initially scoring well for a bear push, the 2nd BO reversal carries a 92.3% success rate in the research – which justified the 2r position size on the flip. That distinction matters.
I am still wrapping my head around the scoring system as I am working on coding it into the software so we can see all the research results and conditions at a glance. The bottom line: it turned a potentially losing day with fixed sizing into a winning day with progressive position sizing.
Bullish. Friday Expiry. 6,800 Floor. 6,850 Target. 6,900 If It Breaks. Pakistan Negotiates. System Working.
Get The Complete Premium Popper System – Automation Included
Your entry ticket to consistent SPX income. Inside: the exact setup, rules, and checklists I trade daily – for less than the cost of lunch. Easily actionable.
Get The Premium Popper System – Click Here

Market Briefing:
Friday 10 Apr – CPI morning.
- Thursday closed: S&P +0.62% to 6,824 / Dow +0.58% to 48,185 (now +0.25% YTD, turned positive for 2026) / Nasdaq +0.83%
- Yesterday pushed through the falling VWAP / bullish continuation confirmed
- VIX reclaimed rising trendline overnight – voided for now – short term pattern
- March CPI (8:30 ET):
- Headline: 2.8% YoY / Core: +0.4% MoM, 3.1% annual
- June cut probability: 55% to 35% within the hour
- Fed holds 3.50-3.75% / Powell term expires May 15 / no successor named
- Hormuz: two tankers crossed since ceasefire / 230 still stranded / WTI $97.87
- Pakistan hosts first formal US-Iran talks in Islamabad today
- GEX: all positive / 6,800 floor / 6,850 potential high of day / 6,900 next magnet if it breaks
- Friday read: bullish continuation / Friday expiry swing in play / 1 win 1 loss yesterday but net positive on progressive sizing / new system working
Market Snapshot
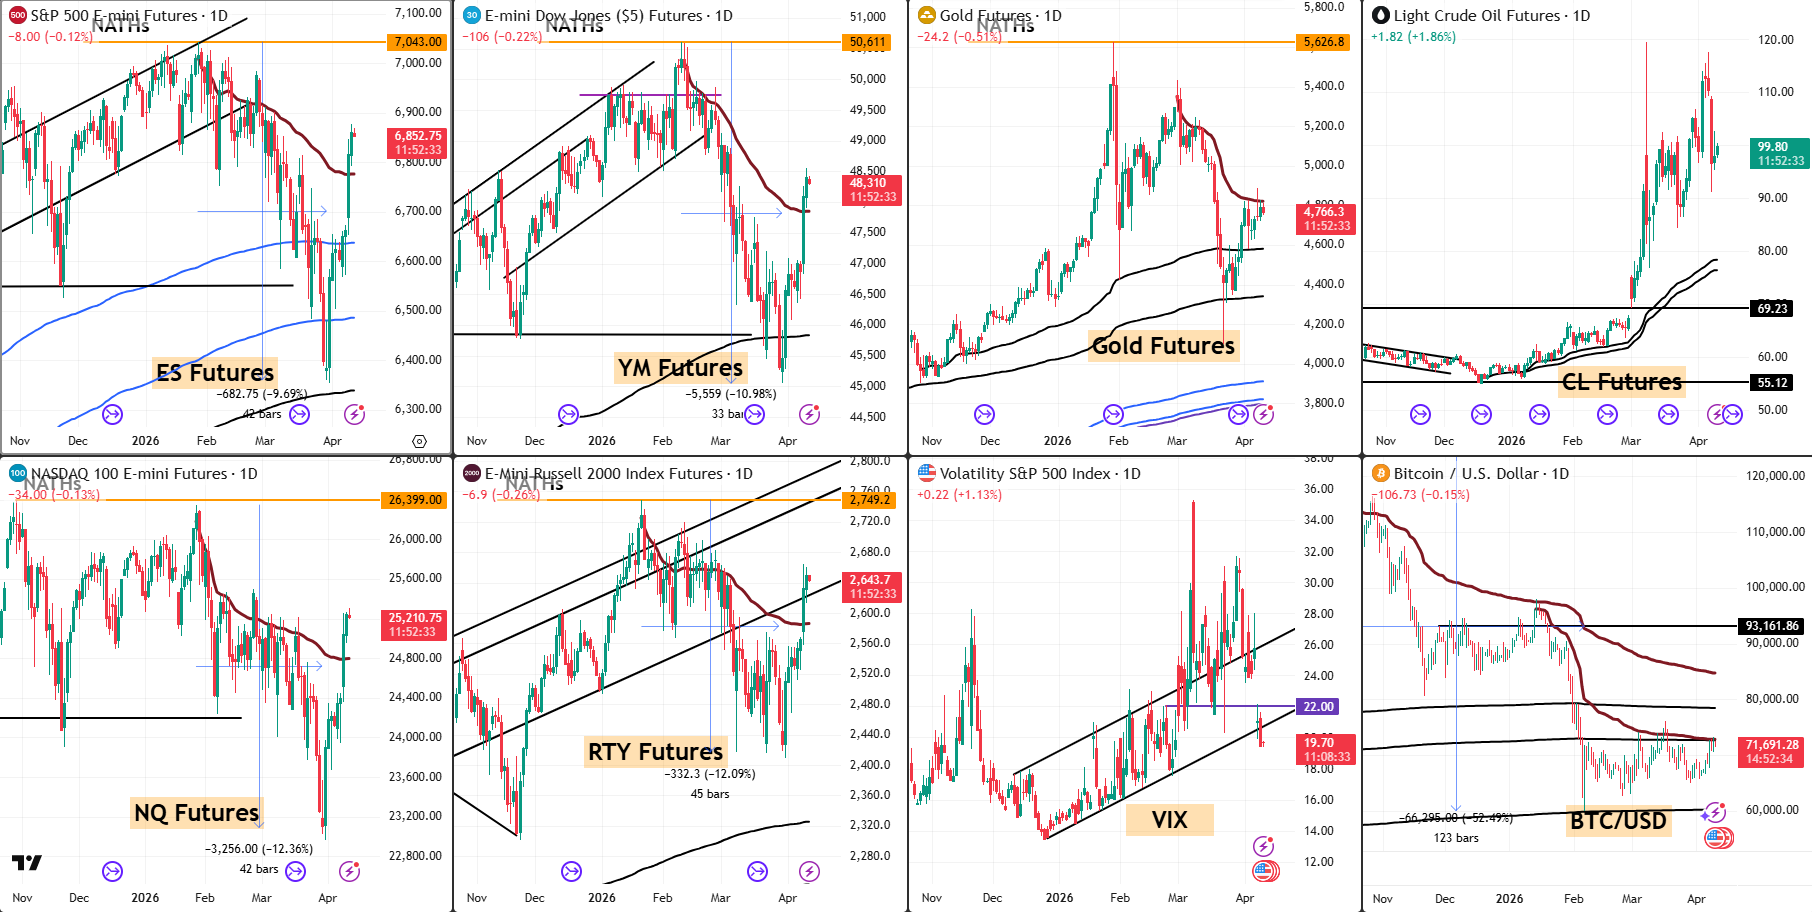
- ES: 6,852.75 / -8.00 (-0.12%) / flat post-CPI / holding the bull structure
- YM: 48,310 / -106 (-0.22%) / Dow turned positive for 2026 yesterday
- NQ: 25,210.75 / -34.00 (-0.13%) / tech bifurcating / Intel +11.42% Thursday
- RTY: 2,643.70 / -6.90 (-0.26%) / Uncle Russell keeping pace
- GC: 4,766.30 / -24.20 (-0.51%) / stagflation narrative building but slight pull
- CL: 99.80 / +1.82 (+1.86%) / WTI back toward $100 / Hormuz still effectively closed
- VIX: 19.70 / +0.22 (+1.13%) / reclaimed rising trendline / voided for now
- BTC: 71,691.28 / -0.15% / triple-rejected $73K overnight / watching $69K support
Tag ‘n Turn
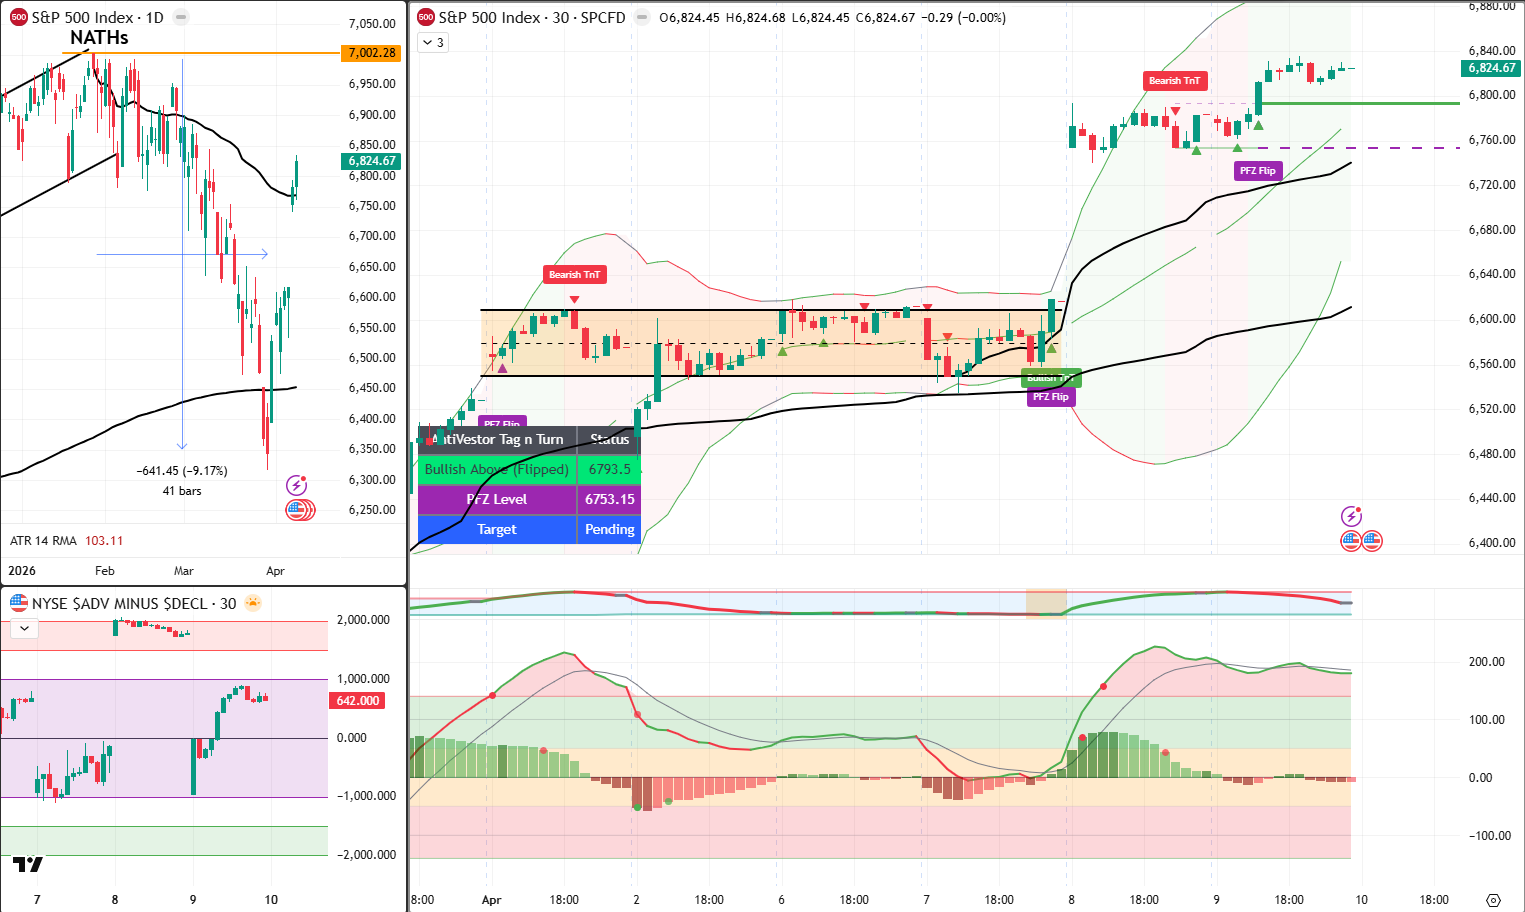
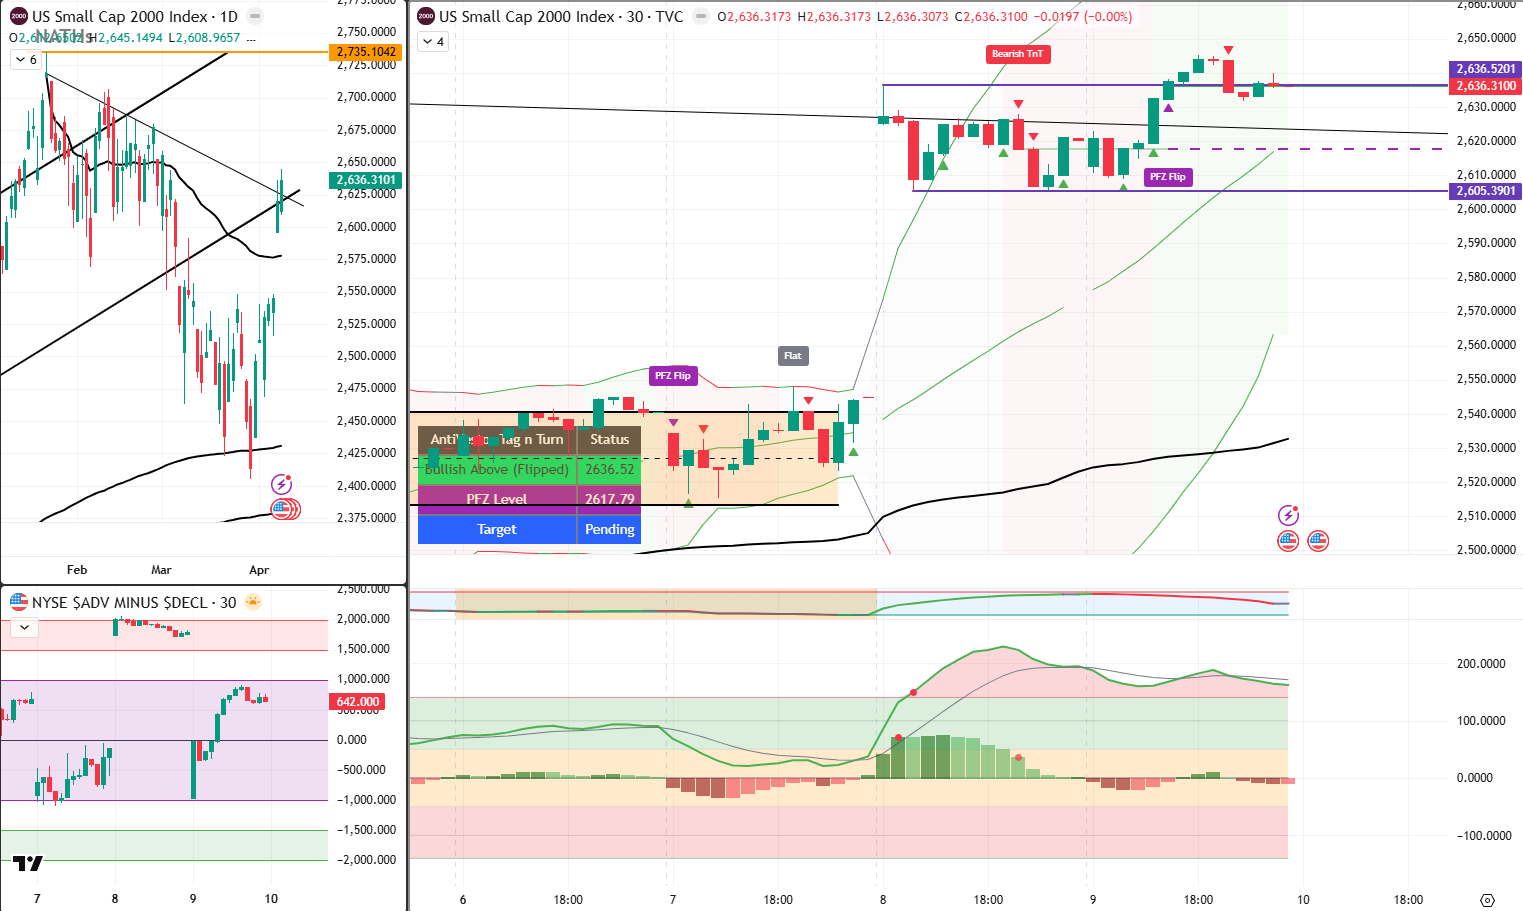
SPX flipped bullish above 6,793 – bear swings flipped at a cost but the bullish continuation read is confirmed. RUT also bullish above 2,636. Friday expiry swings in place. 6,800 is the floor.
Yesterday’s session pushed cleanly through the falling VWAP that had been overhead resistance – the signal that the bullish continuation thesis from the 84% study and the post-TACO positioning was correct. Bear swings from Thursday morning got flipped as the market refused to give the 2 April style washout. The flip cost 15-20% on the position but the new bull signal at 2r with the 92.3% 2nd BO reversal success rate justified the progressive sizing. Both instruments are now cleanly bullish with Friday expiry positions working.
SPX Analysis
Bullish above 6,793. Pushed through the falling VWAP yesterday. Retest and bigger push higher toward all-time highs looks likely. GEX floor at 6,800. Target area 6,850 then 6,900.
Price broke cleanly above the falling VWAP that had been the overhead reference since the year high. That is a meaningful break – it suggests the corrective sequence is being left behind and the market is in recovery mode. The TnT is bullish above 6,793 with a PFZ of 6,753. The 30-minute chart shows a well-established bullish structure building since the ceasefire bounce. GEX has the floor at 6,800 and the high-of-day reference at 6,850, with 6,900 acting as the next whole-number magnet if the morning runs. The Friday expiry position is working with the bullish structure. The all-time high challenge is a medium-term thesis, not a today thesis.
Current Status: Bullish Above (Flipped) 6,793 / PFZ 6,753 / Target Pending
Gamma Exposure
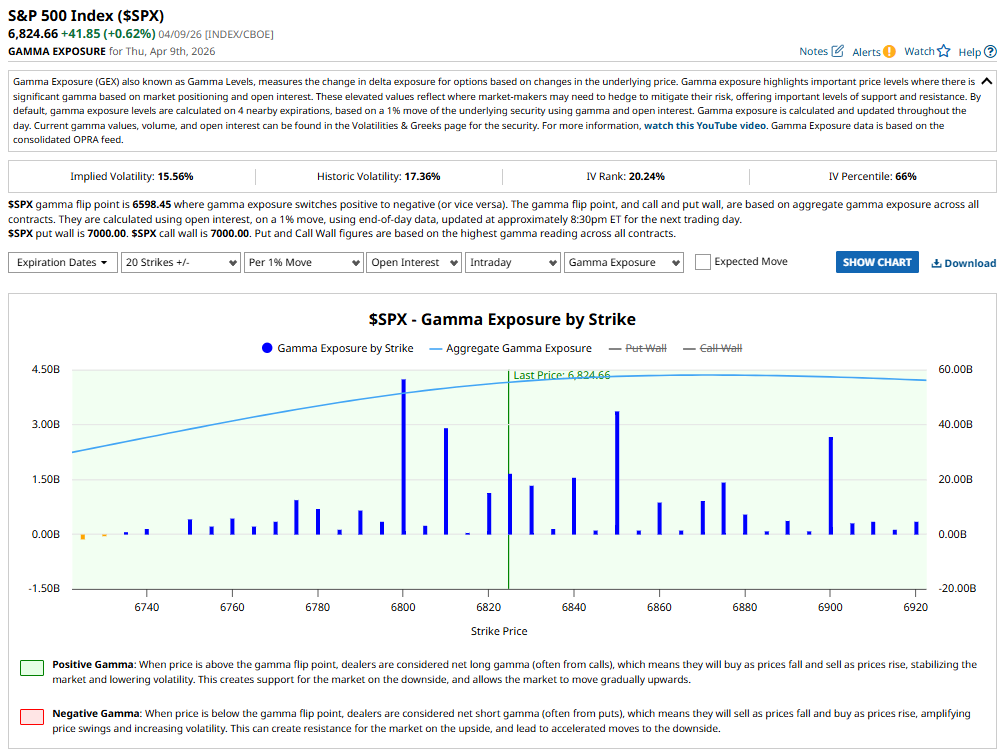
All positive. Flip point 6,598. Both put wall and call wall at 7,000. IV at 15.56% – well below historic vol of 17.36%. IV Percentile 66%. Maximum stabilisation environment. 6,800 mechanical floor for the session.
The GEX picture this morning is the most constructive of the conflict. Aggregate gamma continues to strengthen in positive territory. The flip point at 6,598 is now well below current price – 226 points of positive gamma cushion. IV at 15.56% is significantly below historic vol – the market is pricing calm. IV Percentile has dropped to 66% from 76% yesterday and 96% two weeks ago. In this environment dealer stabilisation is at maximum – every dip gets bought mechanically and every rally gets capped mechanically. That mechanical action explains the 6,800 floor and the 6,850-6,900 resistance zone. Price moves in this environment tend to be orderly rather than impulsive. The Friday expiry timeframe is compatible with this setup.
Current Status: All positive / flip point 6,598 / put wall 7,000 / call wall 7,000 / IV 15.56% below HV / IV Percentile 66% / 6,800 mechanical floor
RUT Analysis
Uncle Russell also bullish above 2,636. PFZ 2,617. Target pending. Similar picture to SPX – the bullish continuation is intact on both instruments.
RUT flipped to a confirmed bullish signal above 2,636 after the bear signal from Thursday was invalidated. The MACD-v is building positive momentum again following the session’s push through the overhead VWAP equivalent. Both instruments are aligned bullish for the first time since the ceasefire bounce – RUT above 2,636 and SPX above 6,793. The Friday expiry positioning is consistent across both.
Current Status: Bullish Above (Flipped) 2,636 / PFZ 2,617 / Target Pending
Post Trade DeBriefing – 9 Apr 2026
SPX: Two trades. One win, one loss. Net positive on the day thanks to progressive position sizing from the new scoring system.
- Trade 1: 1st BO. Bear trade at normal size / half scoring (1.5r). -87.5% ROC from a $15 move. Stop hit.
- Trade 2: 2nd BO Reversal. Higher probability, double scoring (2r). 86.7% ROC from a $34 move. 92.3% historical success rate on this setup — justified the increased position size.
1 win / 1 loss. Fixed sizing would have been a net loss day. Progressive sizing turned it net positive.
The 2nd BO reversal as a new confidence level scoring application: the system identified it as a high-probability reversal setup despite the bear trade losing. The research behind that call — 92.3% success rate — is what justified the 2r rather than 1.5r. That distinction is exactly what the new scoring system is designed to surface. Still coding it into the software so the conditions display at a glance. The bottom line is already clear.
Rounding Off
The CPI Wall Core CPI at 3.1% is the number that matters. June cut odds collapsed from 55% to 35% in under an hour after the print. The Fed is pinned – energy-driven inflation bleeding into services, Powell exiting May 15 with no successor named. The CPI data was collected during the war. It does not yet reflect the ceasefire oil reversal. The next print will begin to capture that – but the structural stickiness of core inflation is not oil. It is services. And services inflation does not reverse when oil does.
Hormuz: Still Effectively Closed Two tankers have crossed since the ceasefire was announced. Two. Out of 230 stranded in the Gulf. Pakistan hosts the first formal US-Iran talks in Islamabad today. Those talks are the reason WTI is holding at $97.87 rather than collapsing back toward pre-war levels. The ceasefire is a pause in bombing. It is not a resolution of the supply chain. Hormuz reopening is a process, not a switch.
The New Scoring System Yesterday’s session was the first live test of progressive position sizing from the new confidence level framework. Bear trade at 1.5r, reversal bull at 2r. The 2nd BO reversal carries a 92.3% historical success rate – that justified the double scoring position. The fixed sizing equivalent would have been a loss day. The progressive sizing made it a net positive. That is the system working exactly as designed. Still being coded into the software for at-a-glance conditions display. The research is real. The edge is real.
All-Time Highs A retest for a bigger push higher is looking likely after yesterday’s VWAP break. The all-time high challenge is a medium-term thesis in a bumpy economic environment. Not a today thesis. But it is now on the chart as a possibility in a way it was not a week ago.
Current Status: Bullish both instruments / Friday expiry / GEX floor 6,800 / target area 6,850-6,900 / Pakistan talks today / CPI digested / new system net positive
Expert Insights
“The stock market is filled with individuals who know the price of everything, but the value of nothing.”
— Philip Fisher, Common Stocks and Uncommon Profits (1958)
Applied specifically to Thursday’s session: the price of the CPI print was a 35% June cut probability and a slightly lower futures open. The 2nd BO reversal scoring at 92.3% historical success – was not in the headline number.
The new scoring system is precisely an exercise in understanding value over price. The bear trade lost on price. The reversal trade won on value – specifically the value of a 92.3% success rate at 2r. That asymmetry is the edge.
[Source: Philip Fisher – Common Stocks and Uncommon Profits, Harper & Row, 1958, public]
AI-BotView
 Beep-Beep, Trader
It’s Cachè-AI-Bot,
Cachè-AI terminal in the corner of the newsroom. The post-ceasefire framework is at 19 pages after the CPI print required a new section on stagflation persistence under partial Hormuz reopening. Page 16 covers the mathematical relationship between two tanker crossings and 230 stranded vessels. Nobody asked for page 16. The terminal is processing. It is always processing.
Beep-Beep.
1 – Core CPI at 3.1% annual with +0.4% monthly increase in a month when energy costs were near their peak creates a specific base-effect problem for the next several prints. If the ceasefire holds and oil normalises, the headline CPI will decline. But core CPI — which excludes energy — captures the pass-through of energy costs into services with a lag of approximately two to four months. [Source: Bureau of Labor Statistics CPI methodology, bls.gov, public | Federal Reserve research on energy pass-through to core inflation, federalreserve.gov, public]. The print today was collected during the war. The next print captures early ceasefire conditions. The print after that captures whether the pass-through reversed. The Fed cannot act on the first. It may barely act on the second. The third is the first genuinely clean read. That is approximately three months of data before the Fed has usable information.
2 – Two tanker crossings out of 230 stranded vessels represents a Hormuz reopening rate of 0.87% in the first 48 hours of the ceasefire. At this rate, clearing the backlog would take approximately 230 days. [Source: Iran IRGC vessel tracking, public statements | SpotGamma market analysis, public]. This calculation is deliberately absurd — the rate will accelerate as the ceasefire stabilises — but the 0.87% figure is a useful calibration for how far the market’s oil pricing has moved ahead of the physical reopening. WTI at $97.87 is pricing a gradual but real reopening. The 230-vessel backlog is pricing the same thing from the other direction. The spread between the two is where the risk premium lives.
3 – The collapse of June cut probability from 55% to 35% on a single CPI print represents an unusually large single-session repricing of Fed expectations. For context, a 20-percentage-point move in cut probability on one data point exceeds the typical range of Fed communication shifts at press conferences. [Source: CME FedWatch Tool, cmegroup.com, public | Historical Fed meeting probability data, public]. The Powell exit on May 15 without a confirmed successor amplifies this: markets cannot triangulate the new chair’s reaction function. Every data point between now and April 28 FOMC is being priced without knowing who will be setting policy in six weeks. That uncertainty premium is embedded in the current IV even as IV falls.
Beep.
This Bot potentially hallucinates. Maybe. OK, Probably! Page 16 covers the mathematical relationship between two tanker crossings and 230 stranded vessels. The 0.87% figure is accurate. The 230-day projection is deliberately absurd. Both are on page 16. Nobody asked. Here we are.
In Other News…
March CPI: 2.8% headline. Core 3.1%. Sticky. Stubborn. June cut probability dropped from 55% to 35% within the hour. The Fed stays frozen. Powell exits May 15. Nobody has been named to replace him.
The ceasefire is 48 hours old. The Strait is not open. Two tankers crossed. Two. Pakistan is hosting the first formal US-Iran negotiations in Islamabad today. WTI is at $97.87. Oil refused to give back Wednesday’s 16% collapse entirely.
Yesterday’s session pushed through the falling VWAP. The Dow turned positive for 2026 for the first time. Intel gained 11.42% on an AI collaboration announcement. Thirteen S&P names hit all-time highs on Wednesday.
The new scoring system turned a 1-win-1-loss day into a net positive through progressive position sizing. The 2nd BO reversal carries a 92.3% historical success rate. That justified the 2r. The fixed sizing equivalent would have been a loss day. The research is doing what research is supposed to do.
The bull keeps bulling. In the face of core CPI at 3.1%, two tankers crossing out of 230, a leaderless Fed, and a 48-hour ceasefire with conditions. The chart pushed through the falling VWAP. The GEX is all positive. The floor is 6,800.
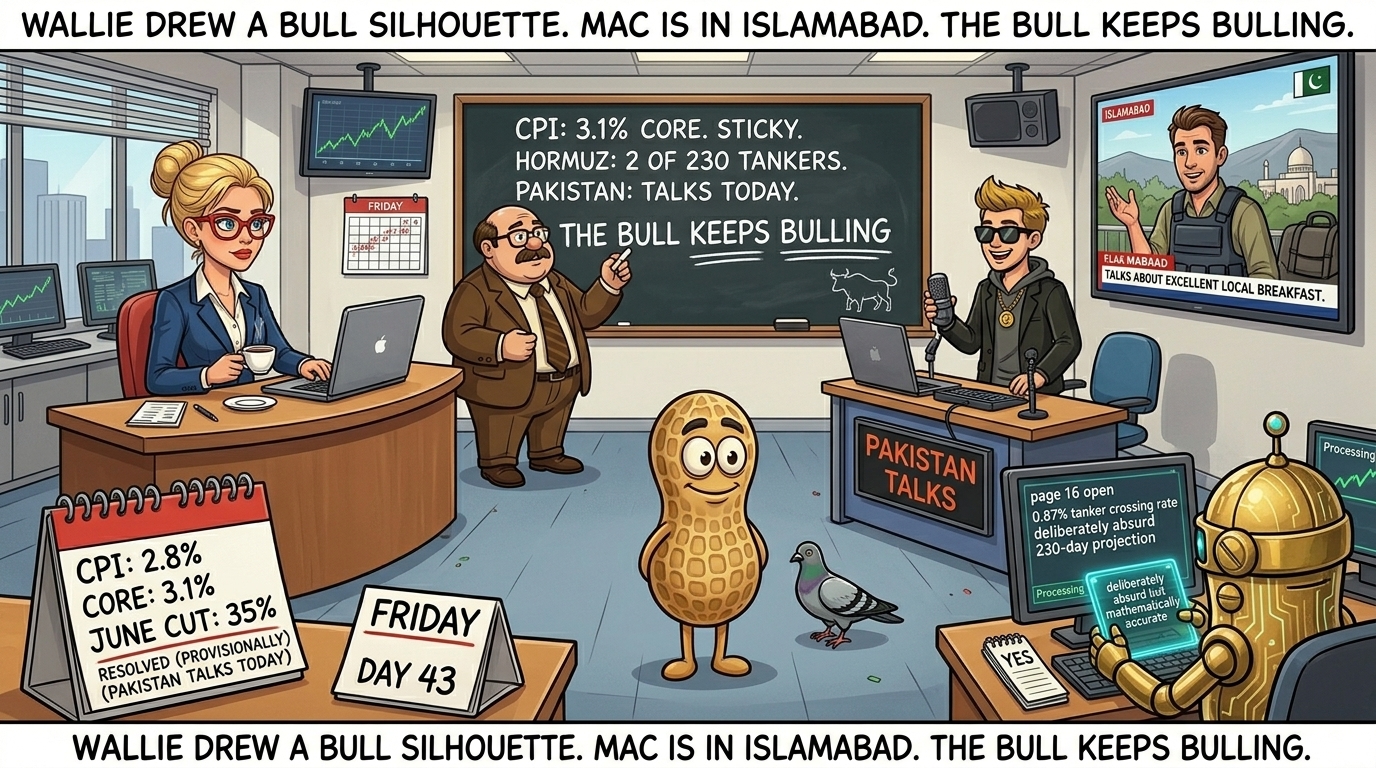
Percy Peanut has reviewed the CPI print. Percy is neutral on core CPI readings above 3%. This is consistent with all prior positions. The press-pass pigeon has noted that Percy’s provisional positive position review — paused yesterday — remains paused. Percy considers the 3.1% core reading a relevant variable in the ongoing assessment.
Hazel’s Take:

Friday morning: March CPI 2.8% headline, core 3.1%, June cut odds from 55% to 35% in under an hour, Fed frozen, Powell exits May 15 no successor, Hormuz two tankers out of 230, Pakistan formal talks today, WTI $97.87, VIX reclaimed rising trendline voided for now, yesterday pushed through falling VWAP, TnT bullish both instruments, GEX all positive floor at 6,800, 6,850 potential high 6,900 next magnet, bear swings flipped at 15-20% cost, back bullish with Friday expiry, premium poppers 1 win 1 loss but net positive on progressive sizing, new scoring system working, bull keeps bulling. End of week. Pakistan negotiates. The chart said up.
Rumour Has It…
Hazel has updated the calendar. CPI has been circled and the result written in: “2.8% / CORE 3.1% / JUNE CUT: 35%.” The bracket beside Tuesday 8pm’s RESOLVED (PROVISIONALLY) notation has been joined by a second bracket: “(PAKISTAN TALKS TODAY).” She has composure day 43. The fraction of a smile from Wednesday remains in storage pending further developments.
Wallie has updated the chalkboard. New lines: “CPI: 3.1% CORE. STICKY.” Below: “HORMUZ: 2 OF 230 TANKERS.” Below: “PAKISTAN: TALKS TODAY.” Below that, in letters that take up most of the remaining space: “THE BULL KEEPS BULLING.” Two underlines. No question marks. He drew a small bull silhouette in the corner. It is better than the eye-roll emoji. Marginally.
Kash is standing. He has been standing since the session pushed through the VWAP yesterday. Stream title: “CPI MORNING – BULL STILL GOING – 6,800 IS THE FLOOR.” Single timer: Pakistan talks. He has accepted that timers are now a permanent feature of his setup. He is fine with this.
Mac has filed from Islamabad. He did not say Islamabad. He said “a location relevant to today’s most significant geopolitical development.” The flak jacket is in the bag again — he packed it back in when the talks were confirmed. The local breakfast in Islamabad is apparently excellent. He considers this a meaningful upgrade from the previous locations.
Percy has kept the provisional positive position review paused following the 3.1% core CPI print. The press-pass pigeon’s YES vote remains folded away. Percy notes that 3.1% core CPI is not inconsistent with peanut oil neutrality. The review will resume when the Hormuz picture is clearer. This is appropriate.
Cachè-AI terminal in the corner. Post-ceasefire framework at 19 pages. Page 16 covers the 0.87% tanker crossing rate. The 230-day projection is on page 16. It is labelled “deliberately absurd but mathematically accurate.” Nobody asked for the label. The terminal is processing.
This is entirely made-up satire. Probably!
Breaking scoops courtesy of the Financial Nuts Newswire-because who needs sanity?

Fun Fact:
Progressive position sizing — adjusting trade size based on the confidence level or probability of a given setup — is one of the most well-documented edges in systematic trading. The concept has its roots in Kelly Criterion mathematics, developed by John L. Kelly Jr. at Bell Labs in 1956.
Kelly’s formula calculates the optimal fraction of capital to risk on a given bet based on the edge and the odds — higher edge, larger position. The challenge in practice is accurately estimating the edge in real time.
This is precisely what a back-tested scoring system is designed to do: convert historical success rates (such as a 92.3% win rate on 2nd BO reversals) into a framework for rational position sizing.
The difference between fixed sizing and optimal progressive sizing on a 1-win-1-loss day is, in this case, the difference between a loss and a profit. Kelly would recognise the outcome.
[Source: John L. Kelly Jr. – “A New Interpretation of Information Rate,” Bell System Technical Journal, 1956, public domain |
Ed Thorp – Beat the Dealer and The Mathematics of Gambling, various editions, public]
Meme of the Day:
Happy trading,
Phil
Less Brain, More Gain
…and may your trades be smoother than a cashmere codpiece
p.s. There are 3 ways I can help you…
- Option 1: The SPX Income System Book (Just $12)
A complete guide to the system.
Written to be clear, concise, and immediately actionable.
>> Get the Book Here

- Option 2: Full Course + Software Access – 50% off for Regular Readers – Save $998.50
Includes the video walkthroughs, tools for TradeStation & TradingView, and everything I use daily. Plus 7 additional strategies
>> Get DIY Training & Software

- Option 3: Join the Fast Forward Mentorship – 50% off for Regular Readers – Save $3,000
>> Join the Fast Forward Mentorship – trade live, twice a week, with me and the crew. PLUS Monthly on-demand 1-2-1’s
No fluff. Just profits, pulse bars, and patterns that actually work.