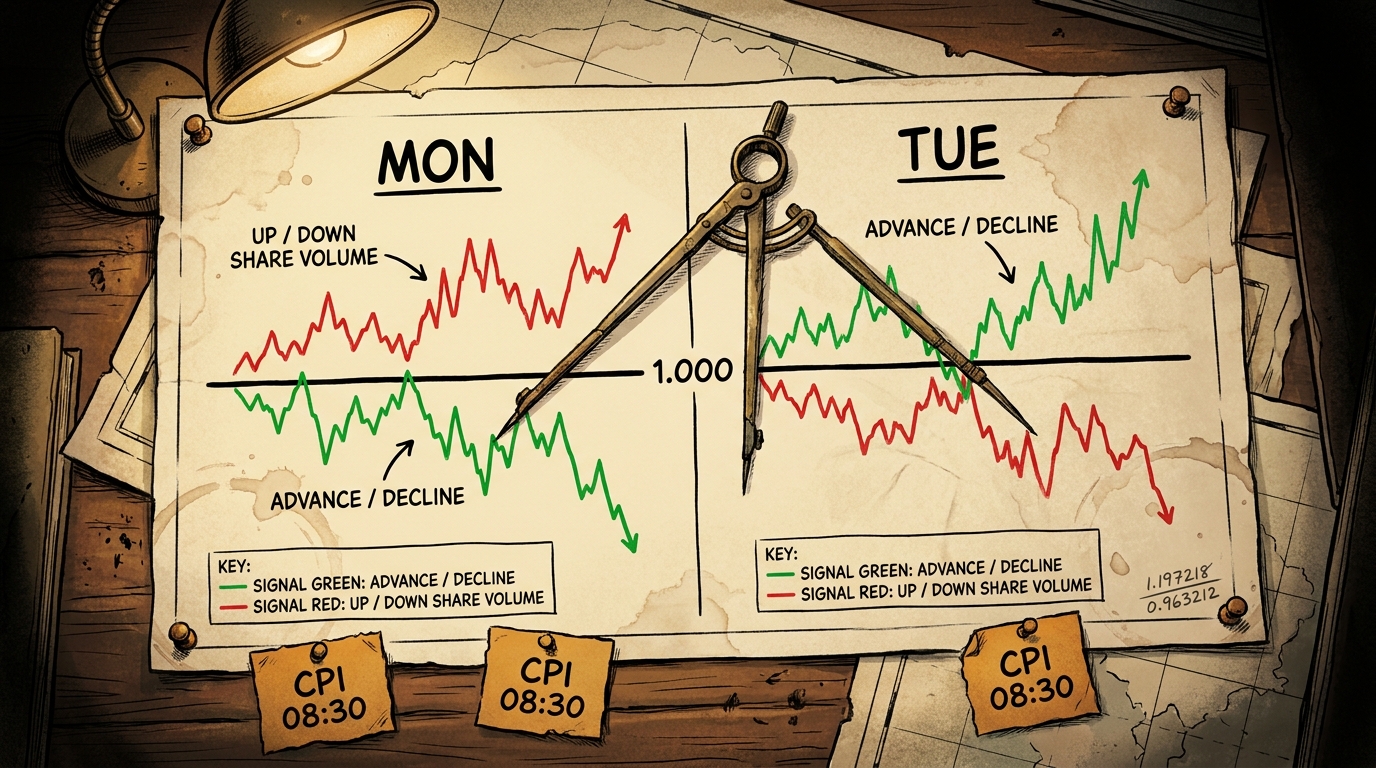
Monday the NYSE put its share volume into the risers whilst more names fell. Tuesday it did the exact opposite.
⚓ Weathervane. The wind is coming from the long end. The policy rate has been frozen for most of the year whilst the term premium does the tightening, and the price of long money is set by deficits, issuance supply and a synchronised global duration bid rather than by the committee. Higher-for-longer stopped being a Fed decision and became a bond-market fact. The cruise ship is holding this heading.
 Ahoy there, Trader! ⚓️
It’s Phil…
When breadth and volume disagree two sessions running and then swap sides, which one is measuring the market?
Take the two sessions side by side, because neither is interesting alone. Monday’s NYSE advance-decline ratio was 0.885017, more fallers than risers, whilst up-to-down volume printed 1.184875, more shares into the risers. Tuesday read 1.197218 and 0.963212. The same contradiction, turned over.
Most desks will reach for the obvious reconciliation, and it is correct as far as it goes. Issue breadth counts companies. Volume breadth counts shares. A handful of enormous, heavily-traded names can outweigh several hundred small ones without appearing in the advance count at all, and Tuesday supplies them: Citigroup ran to 133.50 and closed 124.53, Goldman Sachs opened 923.00 and closed 891.91, JPMorgan reached 344.355 and closed 331.43. Every lender that reported before the bell was marked up at the open and marked down by the close. Over the same session the Dow gave back 647.22 points from its intraday high, though no share of that is attributed here: this book has no Dow divisor and two of those names are not in the index.
So the mechanism is not mysterious. What is harder is what it licenses.
The textbook treats these as two readings of one quantity, participation, and expects them to agree. When they disagree it says the index is being carried, or held back, by a few large names, and treats that as a warning about the quality of the move. What it does not cover is the pair disagreeing twice running and inverting between the two, which is less a warning about one session than a statement that the shares and the crowd sat on opposite sides both days and merely swapped sides.
The uncomfortable part is this. On Monday the shares went with the minority that rose; on Tuesday with the minority that fell. A reader who trusts volume has to say the market swung from buying conviction to selling conviction overnight on no catalyst anybody has produced. A reader who trusts issue breadth says the opposite with equal confidence.
The settling test is specific and arrives soon: a full-volume session with no single sector reporting into the open. Tuesday had earnings concentrated in a handful of the largest NYSE listings, a condition under which these two measures can come apart. Monday’s inversion has no such explanation on this stack, and that is what this letter cannot account for. Strip the reporting session out: if they still disagree, the divergence is about the market. If they agree, it was the calendar.
Phil’s Musing
I trust the volume number more and I cannot defend the preference. It is a habit, not a conclusion. Tuesday made the habit expensive: had I read only Monday’s up-volume line I would have called it accumulation, and a day later the same line said distribution with exactly the same confidence.
Happy trading,
Phil
Less Brain, More Gain
…and may your trades be smoother than a cashmere codpiece
P.S. – Phils Footnote I had assumed that when two breadth measures disagree, one of them is broken. It had not occurred to me that both could be working perfectly and still produce opposite answers on consecutive days, because the thing they measure genuinely changed hands between them. That is a worse problem than a broken instrument, and I would rather have found it this week than next quarter.
🗂 Desk Notes – Part 228 | 14 Oct 2026
Raw briefing. Observations, not trades.
Session read (§8.4)
SESSION BRIDGE: prior session (Tuesday) full reaction SPX -0.022927% to 7,805.45, DJI -0.348019% after a 647.22 point give-back from an intraday 52,317.32, NDX -0.310506%, IXIC -0.152398%, RUT -0.397608%, December ES settlement proxy -0.028633%; live premarket ES +0.1082% / NQ -0.0536%, VIX no premarket print exists on this stack so the prior session official close of 15.27 is carried; threshold: none.
Capture. The five minute bar opening 06:30:00 UTC, window 06:30:00 to 06:34:59, which is 07:30 UK. Read twice at 07:08:30 and 07:15:10 UTC, roughly six minutes forty apart. Open, high, low, close and volume byte-identical on both reads for all four December contracts. Both control conditions fired: the adjacent 07:05 bar mutated between the reads (ES close moved 0.25 of a point and gained 401 contracts, NQ moved 4.00 points and 138 contracts, YM moved 9 points, RTY 0.10) and two new bars were created between them. The capture bar never moved across either read. Container clock verified against the feed’s own last stamped bar, no drift.
Capture values. December ES 7,864.25 on 745 contracts; December NQ 30,775.00 on 334; December YM 52,021 on 72; December RTY 2,806.30 on 51.
Three disagreeing prior closes per contract, reproduced on both ES and NQ. December ES: daily bar 7,855.75, settlement-window bar 7,856.00, electronic close 7,855.50. December NQ: 30,791.50, 30,788.75, 30,782.00. The daily bar matches neither intraday leg on either contract and NQ’s sits above both. The settlement-window bar is identified by its volume spike, ES 67,264 contracts against 19,756 and 15,067 either side. Every figure names its leg and the daily close is labelled a settlement proxy throughout.
Threshold reasoning (§8.4.1). December ES moved -0.028633% on the prior session, which is an order of magnitude inside the 1.0% soft trigger. No carry-over fires. The volatility leg is also silent: VIX moved 0.06 of a point, far short of the ±8% trigger. The commodity leg is silent: November WTI settled +0.426712%, against a ±4% trigger.
Close-to-open window. 20:00 UTC Tuesday to 06:34:59 UTC Wednesday. The CME maintenance gap was used to split trade dates rather than the daily-bar stamp: the last bar of the session opens at 20:55 UTC and the next opens at 22:00, so the break that follows it runs 21:00 to 22:00, which is the published maintenance window.
Contract roll (§2.5). Not a quarterly roll month; the third Friday of October is not a March, June, September or December expiry and the December equity contracts are current. But a different roll is live and it constrains publication: NYMEX:CLX2026 last trades about 20 October, roughly four sessions after today. The November-December volume ratio fell from 1.3673 to 1.172744, and the decomposition matters: both legs grew, November by 7.893% and December by 25.790%, so this is genuine migration into the back month rather than a front month emptying out. November remains front by a 1.17 margin. Any WTI front-month window opened from here spans the expiry and would require splicing an expired contract, which this book does not publish. Brent’s front month is December and last trades 30 October, by the contract rule rather than by a fetch.
Mechanism read (full)
The one artery. Not rates. The distribution of money inside the US cash session, and specifically the second consecutive session on which NYSE issue breadth and NYSE volume breadth pointed opposite ways.
Tuesday: 1,463 NYSE advancers against 1,222 decliners, ratio 1.197218, positive. Up volume 572,903,905 against down volume 594,785,018, ratio 0.963212, negative. Monday was the mirror image: 0.885017 on issues, 1.184875 on volume. The same disagreement, with the sides swapped. The Nasdaq carried no such split on either day, printing 0.640725 and 0.805883 on Tuesday, both negative and mutually consistent.
The named mechanism. Issue breadth counts companies; volume breadth counts shares. A small number of very large, heavily traded NYSE listings moving against the crowd can invert one measure and not the other. No per-name share volume is held on this stack, so the mechanism is named rather than quantified. Tuesday supplies the candidates by name, each percentage measured close against prior close and each level named as what it is: Citigroup ran to an intraday 133.50 and closed 124.53, down 5.601577%; Goldman opened 923.00 and closed 891.91, down 0.228224%; JPMorgan ran to an intraday 344.355 and closed 331.43, down 0.858511%; Wells Fargo down 3.096495%; Johnson and Johnson down 5.733143%. Every large lender reporting before the bell was marked up at the open and marked down by the close. Over the same session the Dow gave back 647.22 points from its intraday high, the financials proxy placed tenth of eleven at -0.417802%, and the S&P closed -0.022927%. No share of the Dow move is attributed to any name: there is no divisor on this stack, and two of the four named lenders are not Dow constituents.
The CMT curve, Tuesday 13 October, all fourteen tenors.
| Tenor | 9 Oct | 13 Oct | Δ bp |
|---|---|---|---|
| 1 Mo | 4.13 | 4.10 | -3 |
| 1.5 Month | 4.13 | 4.15 | +2 |
| 2 Mo | 4.13 | 4.15 | +2 |
| 3 Mo | 4.25 | 4.26 | +1 |
| 4 Mo | 4.29 | 4.32 | +3 |
| 6 Mo | 4.32 | 4.34 | +2 |
| 1 Yr | 4.47 | 4.48 | +1 |
| 2 Yr | 4.80 | 4.79 | -1 |
| 3 Yr | 4.89 | 4.90 | +1 |
| 5 Yr | 5.02 | 5.00 | -2 |
| 7 Yr | 5.13 | 5.11 | -2 |
| 10 Yr | 5.24 | 5.21 | -3 |
| 20 Yr | 5.65 | 5.60 | -5 |
| 30 Yr | 5.60 | 5.56 | -4 |
A twist. The six-week point out to one year cheapened; the 1-month richened 3 basis points and everything from five years out richened, most at the 20-year. 2s10s flattened to 42 from 44, 2s30s to 77 from 80, 20s30s to -4 from -5. The 20-year holds as the strict maximum of all fourteen tenors for a 23rd consecutive published session, the break remaining 9 September where it tied the 30-year at 5.28. H.15 matched 44 of 44 overlapping cells with all five date columns mutually distinct, so the duplicate-and-relabel bug did not recur; H.15 carries no 13 October column, so no discrepancy on that date is assertable and none is asserted.
Retrieval state. The CMT month-scoped endpoint held as primary for a sixth consecutive run and the first fetch was NOT stale: two cache-busted reads agreed byte for byte and the top row was verified as the session expected rather than merely recent. Stale-first stands at 9 of the last 16. The fourteen-column header with the 1.5 Month tenor was asserted before parsing.
The dollar. Down 0.348% to 102.215 on the published index. The six-leg rebuild gives -0.3712 for a residual of -0.0232, which is 6.7% of the move against 0.9% on the calibration run. Direction is unimpeachable because all six legs weakened the dollar, which is a genuinely broad move rather than a euro artefact; the second decimal of the rebuilt index change is not trustworthy this session and the published figure is the point number. The euro’s share of the rebuild fell to 60.4% from 68.8%. Dollar-krona posted the largest single leg at -0.7566% and euro-dollar +0.3891%, which are opposite quote conventions both expressing dollar weakness; the krona contributed 8.6% and the euro 60.4%. Leg magnitude is not index contribution and the two are reported in separate columns for exactly that reason.
Volatility. 15.27 official cash close, up 0.06 from 15.21. Thirteenth of the thirty-two session window held, carrying no superlative. A 12 October VIX bar legitimately exists because Columbus Day shut the bond market on the SIFMA recommendation whilst equities and options traded; the Treasury no-session must not be transposed onto it.
Overnight Excitement (§8.5)
Does not fire. Ninth consecutive edition of non-firing. The largest overnight leg across the four December US equity contracts was NQ at +0.324765%, measured as the maximum absolute excursion from its own settlement proxy, which falls short of the 1.0% trigger by 0.675235 percentage points and sits inside the 0.3 to 0.6 normal-and-silent band. Measured at the capture point rather than the extreme, the largest is RTY at +0.2214%, also silent. The prior two editions printed 0.949892% and 0.580223%; the first was a genuine near-miss and the second, like today’s, sits inside the silent band.
No foreign index level is published and none was hunted. Japan closure test, by the sanctioned method: TSE:7203 returned a contiguous daily series with Monday 12 October absent and 14 October present on 19,149,000 shares, which demonstrates Monday’s closure and today’s opening. No direction is read from that constituent; it is a closure test and nothing more. No further claim is drawn from the closure beyond the closure itself.
Forward catalyst slate
- Today, Wednesday 14 October, 08:30 ET: September CPI. Seven prints at that single timestamp from two BLS releases, enumerated individually: CPI index level, CPI seasonally adjusted, CPI month-on-month, CPI year-on-year, core CPI month-on-month, core CPI year-on-year, and September Real Earnings. Not one print and not four. Consensus 3.6% headline against 3.4% prior, 2.5% core against 2.4%, 0.6% month-on-month. The consensus dispute flagged last week has resolved: all eight consensus-and-prior fields across those six CPI rows now agree between the two calendar routes, so the headline figure is publishable with both routes named. BLS primary confirms the date and nothing in October is marked delayed.
- Separately timed today and deliberately not folded into the 08:30 cluster: MBA mortgage applications at 07:00 ET, a 17-week bill at 11:30 ET, the Beige Book at 14:00 ET, API crude stocks at 16:30 ET.
- Thursday 15 October 08:30 ET: September PPI, plus retail sales, claims, Philadelphia Fed and Empire State. Thirteen prints at one timestamp, the heaviest cluster of the week. BLS primary confirms PPI on schedule.
- Bills only for the rest of this week. No coupon supply lands into CPI or PPI. 17-week today; 4-week and 8-week Thursday; nothing Friday. The 20-year reopening is Wednesday 21 October and a 5-year note Thursday 22 October.
- FOMC 27 to 28 October, two days, no projection round.
- Not this week, commonly misplaced: no coupon auction, no FOMC decision, and no Board-governor monetary policy speech. Both of today’s Bowman appearances are titled supervision and regulation and neither is a policy signal.
Divergence flags
- The headline divergence. NYSE issue breadth positive at 1.197218 against NYSE volume breadth negative at 0.963212, second consecutive session of disagreement, sides swapped from Monday. Did not reconcile and is the edition’s spine.
- A secondary wrap’s futures percentages failed to reproduce for a seventh consecutive edition. One stated December NQ futures “rose 0.27%” against a measured -0.0536% at the capture, an opposite sign, with all four magnitudes differing. Almost certainly a different reference close and a different timestamp. Not reconciled; the dated-contract-against-settlement-proxy measure is the one published.
- Three crude causal chains failed their timestamp test, the third consecutive edition on which this has happened. November WTI bottomed at 91.70 at 11:00 UTC, was back at 94.11 by 16:00 UTC and settled 94.14. The first Middle East supply wire reached the feed at 15:38 UTC, which is twenty-two minutes BEFORE that 16:00 reading, so this stack does not establish where the contract sat immediately before the wire and no pre-wire recovery is claimed. What does hold: a second wire landed 47 minutes AFTER the 18:30 UTC settlement it purported to explain, a third carries a 14 October stamp entirely, and the session high of 95.11 was not set until 20:00 UTC. The sequence is published without a cause.
- The two crudes went opposite ways and the wire layer called both of them “oil”. November WTI settled +0.426712%, December Brent -0.900141%. Their curves also moved opposite: WTI’s front spread widened to 0.97 from 0.88 whilst Brent’s Dec-Jan compressed to 2.78 from 3.45. An “Oil Prices Near $95” headline is true only of November WTI post-settlement at 95.11; December WTI settled 93.17, which is 1.94 below it, and no December intraday high is held. Unnamed continuous symbol; not relayed.
- Zacks staleness has widened from one session to two.
last_trade_datereads 2026-10-12 on a 14 October capture, and it is now provable against a tier-1 route on the same ticker: Zacks gives Wells Fargo’s last close as 83.32, which Stocktwits independently records as the 12 October close against an actual 13 October close of 80.74. Same defect on ASML, 1750.24 against 1717.76. No Zacks price is published as current and every Zacks figure carries a 12 October stamp. Thesector_namedefect also recurred on two named tickers in one pull. - Yahoo and the primary disagree on 12 October S&P volume, 4,148,500,000 against 2,291,949,104. Closes are unaffected and matched to the cent. No index volume figure is published for that date.
- One ASML print, two unlabelled currencies, on the morning’s most-watched name. 11.7 billion euros, company-reported. Separately, a 13.4 billion dollar conversion is circulating, measured against a 13.18 billion dollar consensus. Not a fabrication, a basis collision: set the euro figure beside the dollar one and the apparent 14.5% gap is purely currency. Every figure published carries its currency and its basis and the two never share a sentence.
- The gold carry jumped 20.02 to 28.90 in one session on a tenor one day shorter. It is measured on the aligned basis, December settlement 4177.3 against the FX:XAUUSD bar stamped 17:00 UTC at 4148.40, and NOT against the 4160.31 spot cash close, which is a different leg at a different hour. On the tenor-normalised measure that is 2.246% to 3.302% annualised, inside the September range of 2.204% to 3.461%. No superlative is published on the dollar carry: tenor shrinks monotonically across the window, so the eighteen values are eighteen different quantities and §2.6’s same-quantity requirement fails outright. Days to expiry 77.
- An SEC deep link returned the wrong period. An ASML Form 6-K surfaced by search as “FY2026” is the 15 July Q2 release carrying 9.3 billion euros of net sales and EPS of 7.59 euros. Had it been trusted on the strength of being a primary deep link it would have placed a three-month-old revenue figure in today’s letter under a primary-grade label. “Deep links work” needs amending to “deep links work once the period inside the document is verified.”
- A Board-governor absence that was not a phantom. A calendar carried Waller at 03:45 ET Tuesday and the Board speeches page, read twice with cache-busts, shows nothing on the 13th. The Fed’s own October events page carries it as a Discussion at the Bloomberg New Economy Forum, topic “AI”. The speeches page indexes prepared speeches only and its silence is not evidence an appearance did not occur. No rates read-through is attributed and no transcript exists.
Carry-over note (§10.6)
Does not fire. §8.4.1 is silent on all three legs and Phil has flagged no catalyst. Tuesday’s session was noteworthy in its internals rather than in its magnitude, which is precisely the condition the carry-over is not built for, and the material is carried in the mechanism read and the spine instead.
Regime and sensitivity read (§17.3)
Running LOOSE, thirty-ninth consecutive edition, stated openly rather than presented as neutral. The diagnosis is unchanged and remains specification rather than tuning.
And it has sharpened again. Tuesday produced a second consecutive regime-grade observation about market internals, and the tripwire saw none of it. Monday gave an NYSE session where advance/decline and up/down volume finished on opposite sides of parity; Tuesday gave the same divergence inverted. None of the six candidates is pointed at a volume-against-breadth divergence, none is pointed at a composition effect, and none would have fired on either day. The candidate set is built around rate transmission and dollar response whilst the last five editions’ best observations have all been about who is doing the trading. A candidate set producing no fires across thirty-nine editions whilst the book’s own spine lands outside it on five consecutive mornings is aimed at a different market from the one this book is describing. Adjusting sensitivity will not fix that, and saying so again is more useful than retuning.
Duration flag. The 20-year holds the strict curve maximum for a 23rd published session at 5.60%, with the 20y-30y gap at -4bp inside a window that has run -6bp to 0bp. No extreme, no superlative. The long end richened five basis points into the print whilst the bills cheapened. Watch rather than act.
Drift gate (§11.9.1)
Run immediately before delivery against the spine and the headline figure set. Both limbs recorded: the price-distance limb as specified, and the threshold-distance limb proposed at Part 219, because a figure can cross a specification boundary without travelling 2%. The §8.5 trigger is the live one today and its margin is 0.675235 percentage points, which is wide enough that no plausible intraday move reopens it before publication.
Live variables for Phil to refresh if publication slips materially beyond the capture: the four December futures captures and their percentages, the bitcoin live mark of 83,395.14 stamped 07:00 UTC, and the ether live mark. Everything else in this edition is a settled prior-session figure and does not drift.