Also: the 3 numbers we said on Wednesday we did not have
⚓ Weathervane. The wind is coming from the long end. The policy rate has been frozen for most of the year whilst the term premium does the tightening, and the price of long money is set by deficits, issuance supply and a synchronised global duration bid rather than by the committee. Higher-for-longer stopped being a Fed decision and became a bond-market fact. The cruise ship is holding this heading.
 Ahoy there, Trader! ⚓️
It’s Phil…
Why did the long end rally 9 basis points at 5 tenors on a 0.7 point producer-price surprise?
Most desks will say the market looked through the print, as though looking through something were a mechanism. Take the figures apart.
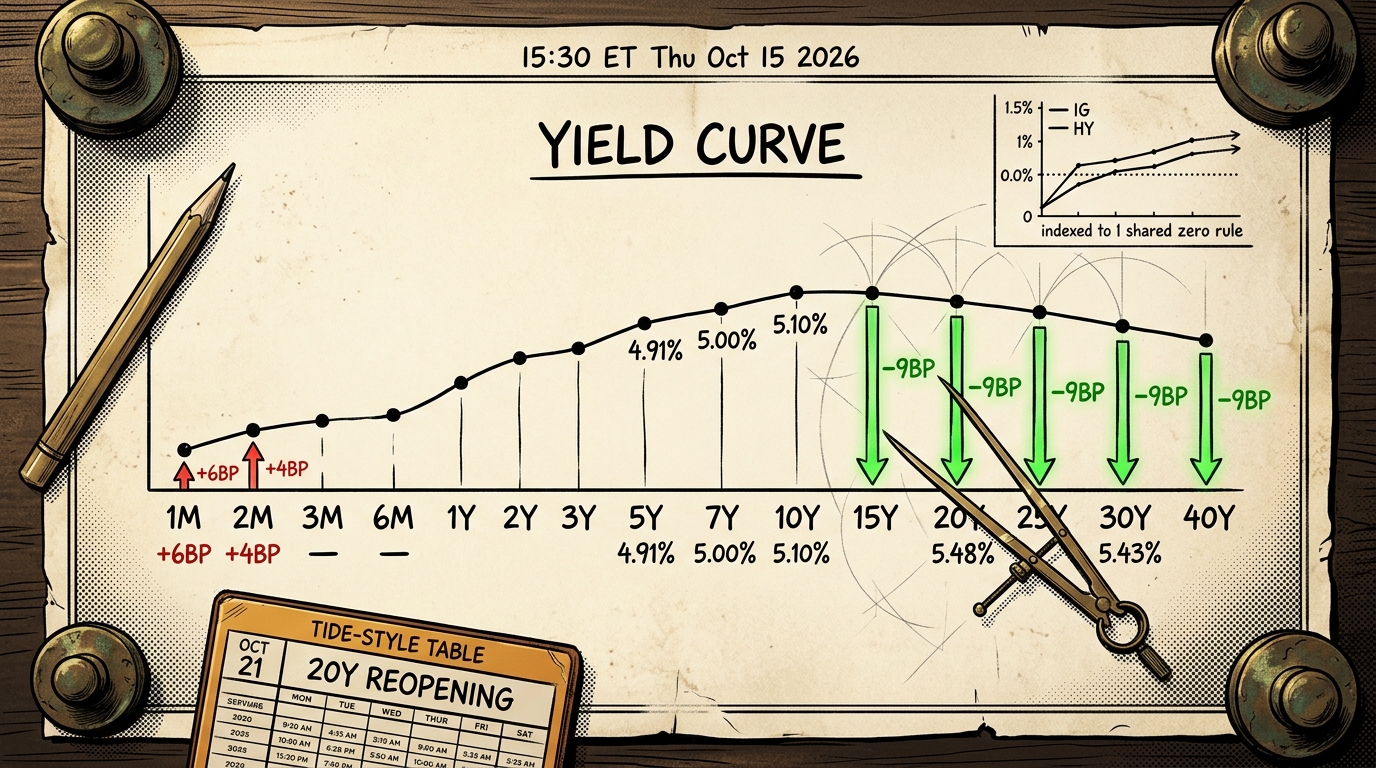
Producer prices rose 1.3% against a 0.6% consensus and 6.3% on the year, a 0.7 point upside surprise. The curve’s reply was to cheapen the 1-month bill 6 basis points and the 2-month 4, leave two tenors untouched, and richen the 5, 7, 10, 20 and 30-year 9 basis points each. Recomputed across all 14 published tenors: exactly 5 carried the 9, and they are the 5 longest.
On a tier-3 relay, October’s odds of a further 25 basis point hike went from 29.9% to 13.8% and December’s single-hike mode from 62.0% to 75.7%, whilst the probability of at least one further hike by December rose to 87.5% from 85.8%. Nothing was removed. Something was moved.
The textbook says an upside inflation surprise cheapens the front end, where policy lives, and does less to the long end, because breakevens and term premium are slower objects. Yesterday did the reverse at the long end whilst the two shortest bills did what the textbook says, which is half the puzzle rather than all of it. The print is timestamped 12:30 UTC, an hour before the cash open, and no part of the day’s bond move has a named cause in this book.
What we can hand you is the thing we admitted on Wednesday we could not. This letter published, in plain words, that it held no effective duration for its credit proxies and so could not say whether a credit price move was a rally or a widening. Those numbers now exist, as published on 14 October and run against 15 October returns: 3.25 years for high yield, 7.54 for investment grade, 14.76 for the long Treasury proxy. The long proxy implies a 9.275034 basis point fall in yield, reconciling with the 9 the curve printed at the 20 and 30-year. Investment grade beat its duration-matched benchmark by 0.118897 points and high yield by 0.115173: roughly 1.58 basis points of investment-grade tightening and 3.54 of high yield. Two caveats. That reconciliation tests only the long end, so it says nothing about where the other two instruments live. And high yield sits at 3.25 years, where the curve did not move 9 basis points at all, so its sign is indicative rather than established.
Phil’s Musing
Nine identical prints across five tenors is not a market with a view about inflation. I cannot tell you what it is a view about, and the bills are why: they went the way the textbook says whilst the 1, 2 and 3-year went the other, so the curve is not telling one story. I would rather own that puzzle than borrow somebody else’s explanation of it.
Happy trading,
Phil
Less Brain, More Gain
…and may your trades be smoother than a cashmere codpiece
P.S. – Phils Footnote I spent Wednesday saying this book could not convert a credit price into a spread, and it was uncomfortable to write. Three numbers off a fund factsheet narrowed it, and the first thing they did was contradict the assumption I had been carrying: I had credit quietly widening under the surface, and duration-matched it tightened. The admission was worth making because it is what made somebody go and find the numbers.
🗂 Desk Notes – Part 230 | 16 Oct 2026
Session read (§8.4)
SESSION BRIDGE: prior session (Thu) full reaction December ES +0.267044% close to close, with December NQ -0.129213%, YM +1.103012% and RTY +1.340619% beneath it; live premarket ES +0.08343% / NQ +0.008294%, VIX 16.46 prior-session official close carried as a prior-session figure; threshold: none.
Threshold reasoning. §8.4.1 is specced on S&P futures and December ES moved +0.267044%, inside the normal envelope, so no carry-over fires and the bridge is silent on the equity leg. The volatility leg did not fire either: VIX fell 2.43035%, well inside ±8%. The commodity leg did not fire: the front-month crude move was December’s +2.768903%, inside ±4%. The expiring November contract moved +3.02871%, also inside it. Threshold is NONE.
§8.4.2 cash trigger, checked explicitly. Sector spread 3.438887 points, below the 4.0 condition. No named constituent in the tables moved more than 10%; the largest was Dell at 6.80% lower. The largest-or-second-largest-daily-move condition is NOT ESTABLISHABLE, because the book holds no dated daily-return window for any headline index, and a closing-level window does not license a claim about daily returns. The condition is recorded as not establishable rather than as not tripped. The §8.3 board below was run regardless, since it costs no tool calls.
Close-to-open window: the cash session closed 16:00 ET Thursday and the capture bar is 06:30:00Z to 06:34:59Z Friday, the fixed 07:30 UK mark. The bar was read at 06:44:49Z and again at 06:46:14Z and returned byte-identical open, high, low, close and volume on all four dated contracts, whilst the adjacent forming bars mutated between the reads on every contract. That restores four-contract confirmation after the prior edition ran the protocol on two of four. Honest note on the maturity rule: the first read came 10 minutes after the bar closed rather than the guided 15, so maturity here is demonstrated empirically by the identity of the two reads against a mutating control rather than assumed from the clock.
Contract roll: not a quarterly roll month. October is not in the March, June, September, December cycle, so the §2.5 pre-flight roll item does not apply. A separate expiry does: CLX2026 last trades about 20 October, so no multi-session WTI front-month superlative is publishable without splicing an expired contract, and none is published.
Mechanism read (full)
The CMT table, all fourteen tenors, both sessions.
| Tenor | 15 Oct | 14 Oct | Change |
|---|---|---|---|
| 1 month | 4.17% | 4.11% | +6bp |
| 1.5 month | 4.15% | 4.15% | 0bp |
| 2 month | 4.19% | 4.15% | +4bp |
| 3 month | 4.28% | 4.28% | 0bp |
| 4 month | 4.35% | 4.36% | -1bp |
| 6 month | 4.35% | 4.37% | -2bp |
| 1 year | 4.49% | 4.53% | -4bp |
| 2 year | 4.77% | 4.82% | -5bp |
| 3 year | 4.85% | 4.92% | -7bp |
| 5 year | 4.91% | 5.00% | -9bp |
| 7 year | 5.00% | 5.09% | -9bp |
| 10 year | 5.10% | 5.19% | -9bp |
| 20 year | 5.48% | 5.57% | -9bp |
| 30 year | 5.43% | 5.52% | -9bp |
2s10s 33bp from 37bp. 2s30s 66bp from 70bp. 20s30s unchanged at -5bp and still inverted. The exhaustiveness claim was recomputed in code over all fourteen tenors: exactly 5 printed -9bp, they are contiguous and terminal, 2 printed 0bp and 2 cheapened. H.15 matched 44 of 44 overlapping cells; it carries no 15 October column, so no 15 October discrepancy is assertable and none is asserted.
The one artery, stated as co-movement and not as a mechanism. The bills cheapened whilst everything from 5 years out richened by the same amount, and over an overlapping but WIDER window, the two tier-3 relay readings being stamped 01:05 on each date against a curve change running 15:30 to 15:30, the relay moved October’s further-hike odds from 29.9% to 13.8% and December’s single-hike mode from 62.0% to 75.7% with the probability of at least one further hike by December rising from 85.8% to 87.5%. The book holds no instrument that connects those two observations, and no flow, positioning or funding series exists on this stack to test a transmission story. They are reported as having happened together.
What the clock permits, and the item P decomposition
The September producer-price release is timestamped 12:30:00Z against a 13:30:00Z cash open. It therefore precedes the entire cash session, and on the equity leg the published decomposition is:
| Leg | Points | Share of move |
|---|---|---|
| Dow opening gap | 236.58 | 42.534295% |
| Dow intraday leg | 319.63 | 57.465705% |
| Full close-to-close | 556.21 | 100% |
The two shares sum to 100 within the validator’s tolerance. The print precedes the open and therefore precedes the gap; the intraday leg carries the majority and has no named cause in this book. The lock is filed with named_cause null and majority_unexplained true, which is the licensed admission. 🔴 Scope of that admission, stated precisely rather than certified loosely: both letters now carry the no-cause sentence for the BOND move. They do NOT carry one for the breadth reading, the Dell fall, the crude dislocation or the Nasdaq-100 round trip, each of which is also untriggered in this book, and that is a gap the next edition should close rather than a discharge.
On the spine itself, no decomposition is available at all: the spine is a CMT change, CMT yields are end-of-day par yields and the series publishes no intraday path, so there is no gap-versus-intraday split to compute for it. That is a structural absence, not a retrieval failure.
§8.3 candidate cause board
Column one, effects without causes.
| Candidate | Class | Timestamp | Precedes majority? | Large enough? |
|---|---|---|---|---|
| The uniform -9bp from 5 years out | 6 | none | n/a | no candidate passes |
| Health care leading two sessions running, 1.856749% after 2.534481% | 6 | none | n/a | no |
| NYSE advance/decline at 3.031019, outside the book’s logged base-rate range | 6 | none | n/a | no |
| November WTI +3.02871% against December Brent -0.132001% | 6 | none | n/a | no |
| The large-bank 8-K cluster against the Dow’s 42.534295% opening gap | 3 | filing DATES only, no filing times held | not establishable | plausible, unconfirmed |
The bank cluster is admitted as a class 3 candidate, labelled narrative, and is not published as a cause. Sixty-two companies filed an earnings 8-K on 15 October and financials rose 1.375642%, and the book holds filing dates rather than filing times, so the sequence cannot be established.
Column two, causes without effects. This is the stronger column this edition.
| Candidate | What it did not move |
|---|---|
| September producer prices +1.3% against +0.6%, the loudest print of the run | Yields fell 9bp from 5 years out, VIX fell 2.43035%, the volatility curve deepened its contango to 0.890211, and the dollar fell 0.51108% |
| The Nasdaq-100 | Closed -0.050821% after a 424.11-point gap and a 1.963% range, whilst 8,028,709,200 shares traded in advancing issues across the Nasdaq exchange as a whole |
| CoreWeave’s 15.460738% collapse on Wednesday | Reversed to +5.944056% on 3.674 times its 20-session mean volume |
| The semiconductor rout | Decelerated roughly fivefold, SOXX -0.906781% against -4.500827%, despite printing -4.55% at its intraday low |
| The weakest 8-week bill cover of its trailing six, 2.26 against a window of 2.82, 2.94, 2.76, 2.70, 2.77 and 2.26 | 20s30s unchanged at -5bp; the weakness stayed inside the bill sector |
| Utilities, on a day the long Treasury proxy rose 1.368995% | XLU fell 0.07, seven cents, and was one of only 3 sectors down |
| Two Fed speakers on the tape | Both slots sit after the 16:00 ET cash close and neither has a prepared text; nothing attributed |
Overnight Excitement (§8.5)
Does not fire, and does not merely fail to lead. Overnight movement on the four dated December contracts at the capture was ES +0.08343%, NQ +0.008294%, YM +0.150677% and RTY +0.183335%, every one of them below the 0.3% floor of the normal-and-silent band. Note the trap avoided: YM and RTY carried +1.103012% and +1.340619% on the prior CASH session close-to-close, which is a different quantity from overnight movement and would have mis-fired the section by a factor of roughly ten. No foreign index level is published; no tier-1 route to any non-US cash index exists on this stack, and the closure tests for Japan and China were not run this edition and are recorded as untested rather than absent.
The credit leg, and a standing gap closed
Effective duration was obtained for all three proxies from the fund issuer’s own product pages, as of 14 October: high yield 3.25 years, investment grade 7.54 years, long Treasury 14.76 years. This closes the gap the registry ranked first.
What it licenses, with the caveats attached. The long proxy’s 1.368995% return implies a 9.275034bp fall in yield, which reconciles against the 20-year and 30-year both printing -9bp. 🔴 That reconciliation tests ONLY the long end: it demonstrates that the long proxy tracks the tenors it holds and says nothing about the curve points where the other two instruments live, so it is not a validation of the parallel-shift assumption and must not be written as one. Investment grade returned 0.818235% against a duration-matched 0.699338%, an excess of 0.118897 points, reading as 1.58bp of tightening at two decimal places. High yield returned 0.416612% against 0.301439%, an excess of 0.115173 points, reading as 3.54bp. 🔴 The high-yield proxy’s effective duration is 3.25 years and the curve did NOT move 9bp at that point: the 2, 3 and 1-year moved -5, -7 and -4bp. The caveat the outward files carry is therefore the right one and the sign on high yield is indicative rather than established. Durations and option-adjusted spreads are the issuer’s own figures as of 14 October, run against 15 October returns, and that one-session staleness is stated rather than buried. Option-adjusted spreads were 296.82 basis points for high yield and 87.14 basis points for investment grade.
Forward catalyst slate
- Today, 16 Oct: import and export price indexes 08:30 ET, industrial production and capacity utilisation 09:15 ET, commercial bank assets and liabilities 16:15 ET. No auction.
- Mon 19 Oct: 13-week bill $95 billion and 26-week bill $82 billion.
- Tue 20 Oct: state employment and unemployment 10:00 ET, 6-week bill $95 billion. The Part 229 credit shot settles on this close, and its geometry is asymmetric: the high-yield proxy closed 77.13 against a falsifier floor of 76.19552 and a confirming band of 76.57957 to 77.04043, so it sits ABOVE the confirming band and the distance back into it is roughly a tenth of the distance down to the floor.
- Wed 21 Oct: usual weekly earnings Q3 10:00 ET, and a 19-Year 10-Month bond auction of $13 billion, which is a 20-year reopening landing on the tenor that has held the curve maximum.
- Thu 22 Oct: 5-year note auction of $26 billion.
- Not this week: no FOMC. The meeting runs 27 to 28 October over two days with no projection round. No further inflation release falls inside any ten-session window from here, which is why a long-end-on-hot-data shot is declined below.
Divergence flags
- The Nasdaq Composite and the Nasdaq-100 finished on OPPOSITE SIDES OF ZERO, 12.6338 basis points apart. A bare reference to “the Nasdaq” this edition gets the sign wrong, not merely the magnitude.
- Bond volatility rose 3.454781% whilst equity volatility fell 2.43035% and the volatility term structure deepened its contango from 0.897818 to 0.890211. Rate vol up, equity vol down, on one session.
- November WTI rose 3.02871% whilst December Brent fell 0.132001%. The transatlantic spread narrowed 3.02 and the decomposition sums on a single date basis: the WTI leg is 2.88 and the Brent leg 0.14, so 95.364238% of the narrowing is WTI. Brent’s flatness sits awkwardly with a global supply story. No cause is named and no signature is characterised; the two legs are also different delivery months, December Brent against the expiring November crude contract, and a December-against-December comparison gives a different spread.
- WTI’s front month rolled to December on 15 October on a volume ratio of 1.158707, so the standing note that the two crude products run opposite ways has LAPSED: both are now front-December. Brent’s ratio is 1.373255.
- Utilities fell on a session the long Treasury proxy rose 1.368995%.
- The volume-integrity residual returned to positive at +0.911154%, having been MINUS 0.863378% the session before. The 14 October negative reproduced exactly off this run’s own bars, so it was a genuine one-session feed event rather than a persistent regime, and the standard framing is publishable again for 15 October whilst 14 October remains the one logged exception. The Nasdaq residual remains not computable; no working Nasdaq total-volume symbol exists.
- Index closes are SINGLE-ROUTE AND UNRECONCILED this edition. The AP syndication path returned SITE_BLOCKED on a direct fetch of its canonical hub, which is a regression from the prior edition where it reconciled all four exactly. Four internal cross-checks against previously locked values did pass.
- The sector up-and-down count is decided by seven cents in utilities, the fourth consecutive edition in which a sub-dime move decides it. The spread and the leader and laggard are the robust statistics on this route; the count is not.
Carry-over note (§10.6)
Does not fire. §8.4.1 returned NONE on all three legs and Phil has flagged no catalyst.
Regime and sensitivity read (§17.3)
Sensitivity is running LOOSE, forty-first consecutive edition, stated openly rather than presented as neutral. The diagnosis remains specification rather than tuning.
This edition sharpens it in a seventh consecutive way. The spine is a curve REFLEX: one number repeated at five tenors, with the bills moving the other way. None of the six candidates is pointed at a repeated-identical-change signature, at a bills-versus-long-end split, or at a breadth reading outside its own base-rate range. Candidate 3’s long-overdue replacement leg would have missed a session in which equity volatility FELL 2.43035% whilst bond volatility rose 3.454781%, which is the two-sided shape it was supposed to catch. Candidate 6 was applicable and unscoreable for a third consecutive edition for want of a carried numeric threshold.
A new proposal, with a threshold attached at proposal: an identical basis-point change printing at three or more consecutive tenors on the same session whilst the bill sector moves the opposite way. That would have fired yesterday and fires nothing today. It needs no duration figure, no positioning data and no flow series to score, which is the test the other six keep failing.
The Weathervane’s turn condition did not advance: the mover was a data release rather than a communication, so the condition is inapplicable on its antecedent limb for a second consecutive edition. Twentieth consecutive non-advance.
Specification lesson (§18)
Candidate lesson: a threshold specced on one instrument cannot detect a magnitude event in another, and the §8.4.2 cash trigger inherits the same blind spot it was written to fix. Ruling O added a cash-magnitude trigger because December ES read “soft” whilst the cash Nasdaq-100 posted its largest move of the window. Yesterday the reverse shape appeared: every §8.4.1 leg and every §8.4.2 condition returned none or not-establishable, whilst the NYSE advance/decline ratio printed 3.031019 against a logged 32-session maximum of 1.814 and a median of 0.811. The book’s loudest single statistic of the session trips no trigger in either section, because neither section measures breadth. Proposed fourth §8.4.2 condition: a breadth ratio printing outside the range of its own held base rate. Cost is nil; the base rate is already carried.
Drift gate (§11.9.1), both limbs
Reported per the house practice adopted at Part 229. Price limb: the spine is a published CMT change for a completed session and cannot drift. The headline set re-quoted immediately before delivery is reported in the wrap-up. Threshold limb: §8.5’s nearest boundary is the 0.3% floor of the normal-and-silent band, and the four contracts sit 0.116665 to 0.291706 percentage points BELOW it at the capture. A crossing of that floor would take roughly a 1.6-fold move on the largest of them, so the band edge is marginal rather than comfortable. The 1.0% FIRING threshold is a long way off: clearances to it run 0.816665 to 0.991706.