Every tenor closed higher, 1,403 NYSE issues fell, and 2,673 Nasdaq issues rose
⚓ Weathervane. The wind is coming from the long end. The policy rate has been frozen for most of the year whilst the term premium does the tightening, and the price of long money is set by deficits, issuance supply and a synchronised global duration bid rather than by the committee. Higher-for-longer stopped being a Fed decision and became a bond-market fact. The cruise ship is holding this heading.
 Ahoy there, Trader! ⚓️
It’s Phil…
If the cost of money rose at every maturity, why did the two exchanges disagree about what that meant?
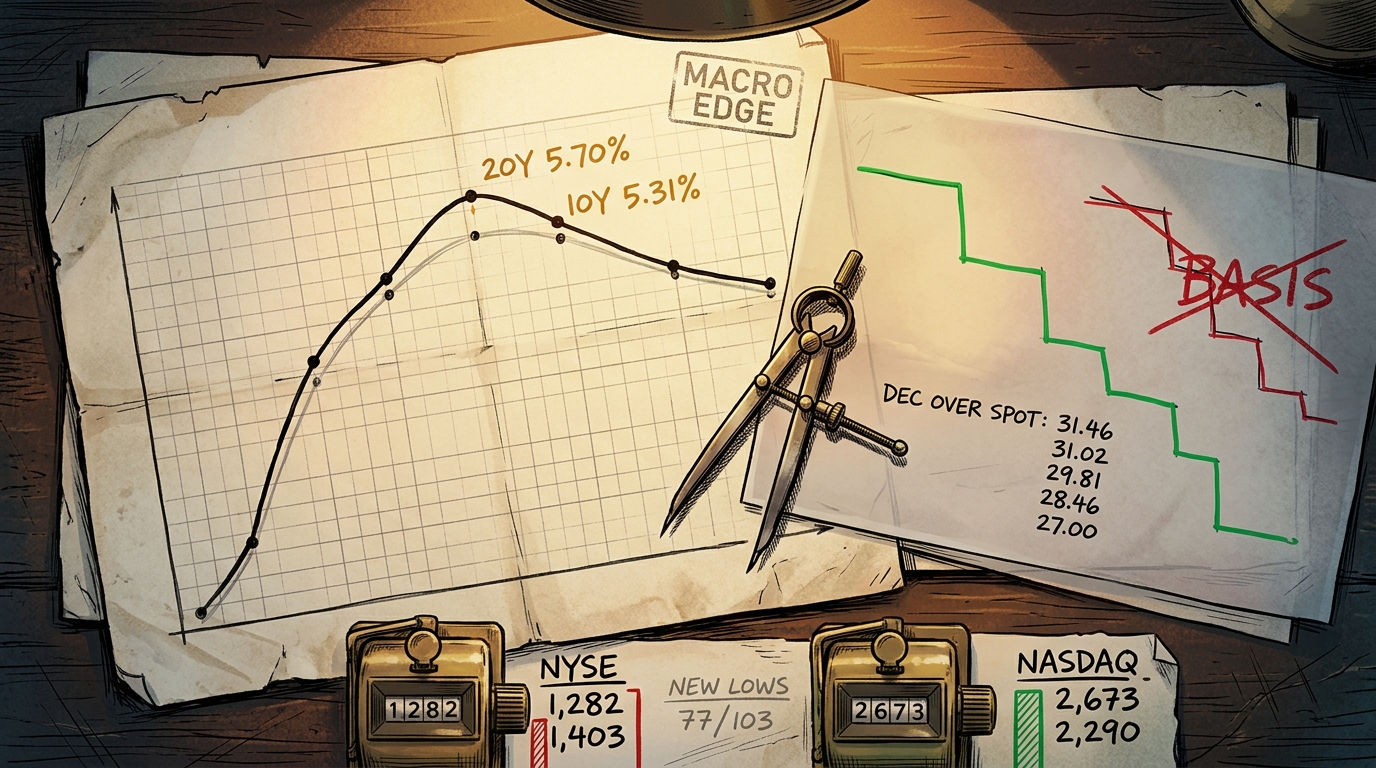
Start with the machine. Every Treasury maturity closed flat or cheaper. The 20-year finished at 5.70% and the 10-year at 5.31%, the highest closes of the eleven sessions held, and 2s10s widened to 47 basis points. The dollar firmed 0.1746%, about four-fifths of a six-leg rebuild from a weaker euro. The VIX added 0.21 point to 15.52, the wrong way. And the headline indices rose, 0.6634% on the S&P 500 and 1.0535% on the Nasdaq Composite, against a bare 0.1777% on the Dow.
Then look underneath. On the New York Stock Exchange 1,403 issues fell against 1,282 that rose. On the Nasdaq, same session, same curve, 2,673 rose against 2,290 that fell. One venue had most of its own listings going the wrong way and the other had most going the right way, out of one identical rate move.
This textbook is not controversial. A discount rate is a discount rate: it applies to every claim on future cash, it rose for everybody on Monday, and it should have pushed both listings the same way, with the longer-duration venue taking the worse of it. Monday declined, and the venue with the longer-duration reputation was the one that advanced on a majority of its own names.
They agreed on one thing. Both printed more new 1-year lows than highs: 77 against 40 in New York, 103 against 47 on the Nasdaq. So the disagreement is not about direction. It is about which part of each listing is being left behind, and the index tells you nothing about that in either place.
A second instrument agrees, and it comes with an admission. The premium of December gold futures over spot has been narrowing, which is the wrong direction when financing costs rise, and we were measuring it wrongly: the old form differenced a 13:30 settlement against a spot mark half an hour later, so it carried drift rather than carry. Re-struck at the settlement instant, the series reads 31.46, 31.02, 29.81, 28.46 and 27.00, four consecutive declines across five sessions. The breach of our own band was mostly our own basis error. The narrowing is real, and it points where the new lows point: money is getting dearer and something is refusing to reprice.
Two instruments, one shape, and a measurement we had to fix before we could see it.
Phil’s Musing
My instinct is that this is a listing-composition story rather than a rates story, and that the honest price of money here is the new-low count rather than either index. If so, the two exchanges are not disagreeing about the rate. They are disagreeing about how much of their own membership can still carry it. The test is whether both keep printing more 1-year lows than highs through the three auctions and the minutes this week.
Happy trading,
Phil
Less Brain, More Gain
…and may your trades be smoother than a cashmere codpiece
P.S. – Phils Footnote
I have been quoting that gold carry figure for the last few editions as though the number were the thing in question, and it was not: the definition was. A settlement and a spot mark half an hour apart are not the same moment, and I was quietly measuring thirty minutes of drift and calling it the cost of storage. The embarrassing part is that the corrected series tells the better story. The comfortable assumption was that a band holding for ten sessions meant the band was right.
🗂 Desk Notes – Part 222 | 6 Oct 2026
Observations, not trades.
Session read (§8.4)
SESSION BRIDGE: prior session (Mon 5 Oct) full reaction S&P 500 +0.6634% cash close to 7,773.95, Nasdaq Composite +1.0535%, Russell 2000 +0.5027%, NYSE advance/decline 0.913756, VIX +1.37% to 15.52, no after-hours catalyst identified; live premarket ES +0.1789% / NQ +0.2219%, VIX 15.52 carried as the prior-session official close because no premarket VIX exists on this stack; threshold: none.
Capture window stated explicitly: the 5-minute bar stamped 06:30 UTC on 6 October, read at 06:50:00Z and again at 06:58:04Z. All four December contracts returned byte-identical open, high, low, close and volume on both reads, whilst the adjacent still-forming bar moved on all four, which is the control that makes the lock evidence rather than assertion. Eighth consecutive clean run of this protocol. Container clock verified with date -u before the capture rather than assumed.
Threshold reasoning, every leg checked: the equity leg is +0.6634% on the prior cash session, inside the normal envelope and well short of the 1.0% soft trigger. The premarket leg runs 0.1778% to 0.2618% across the four December contracts, which is BELOW the 0.3% typical band rather than above the 0.6% abnormal band, so it fires nothing in either direction. The volatility leg is +1.37% against a ±8% trigger. The commodity leg is -1.8439% on front-month November crude against a ±4% trigger. No manual flag from Phil. Threshold NONE and no carry-over note fires (§10.6).
Close-to-open window: 7,773.95 cash close to a December ES premarket of 7,840.25, with a futures-over-cash premium near 52.3 points, so those two levels are not a comparison.
No contract-roll warning. The December equity, energy and metals contracts are all mid-life and the quarterly roll (§2.5) is 18 December.
The mechanism read (full)
The CMT curve, 5 October against 2 October, basis points.
| Tenor | 2 Oct | 5 Oct | Change |
|---|---|---|---|
| 1 Mo | 4.04 | 4.05 | +1 |
| 1.5 Mo | 4.09 | 4.10 | +1 |
| 2 Mo | 4.11 | 4.13 | +2 |
| 3 Mo | 4.19 | 4.22 | +3 |
| 4 Mo | 4.26 | 4.27 | +1 |
| 6 Mo | 4.27 | 4.30 | +3 |
| 1 Yr | 4.46 | 4.47 | +1 |
| 2 Yr | 4.83 | 4.84 | +1 |
| 3 Yr | 4.96 | 4.97 | +1 |
| 5 Yr | 5.06 | 5.06 | 0 |
| 7 Yr | 5.17 | 5.19 | +2 |
| 10 Yr | 5.28 | 5.31 | +3 |
| 20 Yr | 5.67 | 5.70 | +3 |
| 30 Yr | 5.63 | 5.66 | +3 |
Two cache-busted fetches of the month-scoped endpoint agreed character for character with a 5 October top row on the first attempt, so the stale-first streak does not extend. Fourteen-column schema with the 1.5 Month tenor, header asserted before parsing. H.15 carries no 5 October column, which is the expected one-session lag and not a failure; its 2 October column matches CMT on every tenor.
What moved. A flat-to-cheaper curve with a mild bear steepening. 2s10s widened 45 to 47, 2s30s 80 to 82, and the 20s30s gap held at +4 with the 20-year strictly the highest published yield at 5.70%. On the eleven sessions re-pulled this run, 21 September to 5 October, the 20-year is the unique curve maximum at every close, and both the 20-year and the 10-year set the highest close of that held window on Monday. The longer strictly-highest run is carried from prior editions and was not re-verified here.
What it implies, and the attribution is declined. ISM services printed 54.9 at 10:00 ET. The intraday path on the cross-validator instruments, used for shape only and never mixed with CMT magnitudes, shows both the 2-year and the 10-year dipping inside that release bar and then fully reversing within the following few bars. Both ends then climbed together into the early afternoon, where no scheduled release sits, and retraced into the close. The 2-year’s session low on that instrument was 4.785 and the 10-year’s high 5.349. No basis-point magnitude is published from this path: the research return flagged its own extremes as read by manual scanning rather than computed, so only the shape is carried. And no dated Federal Reserve communication was found on any route read. The Board speeches page, read twice with a cache-bust, carries nothing later than 1 October, and no Reserve Bank president’s own page shows a 5 October engagement. Reserve Bank pages generally post after delivery, so the correct characterisation is that no primary source exists yet rather than that nothing happened. A constructed New York Fed article path returned 404, which is useful negative evidence and not proof of absence. So the day’s largest rates move has no publishable author, for the third time in five editions, and nothing was invented to supply one.
The dollar. Up 0.1746% actual against a six-leg rebuild of +0.1723%, a residual of +0.0023 percentage points, well inside the tolerance this method has established. The euro leg supplied +0.1347 of the +0.1723, roughly seventy-eight per cent of it, with sterling second at +0.0148 and the Swiss franc third at +0.0081. This was a euro event, not a broad dollar event. The research return’s prose named the franc as second and its own leg table contradicts it, which is the second instance of that shape this run.
Volatility. The VIX gained 0.21 point to 15.52 on a 0.90-point range, after opening 16.24, which is a gap-up that faded. Rising volatility on a positive equity session is the volatility market declining to confirm the equity market.
The one artery. Rates did not drive equities and equities did not drive rates. Money got dearer at every maturity and the headline indices rose anyway, on a New York Stock Exchange stock count that was negative and a Nasdaq count that was positive. The mechanism is composition rather than direction, and the two venues disagreed about what one rate move meant. No claim is made about which companies produced the index move: there is no contribution or weighting data on this stack and the Dow divisor does not exist here. That is the day’s causal read and it is why breadth, not the index, is the spine.
Overnight Excitement (§8.5)
Does not fire, and it is not close. The trigger is US futures overnight movement. At the capture all four December contracts sit between +0.1778% and +0.2618% from settlement, below the 0.3% silent band, against a 1.0% firing threshold. The widest overnight extremes were a +0.3317% high on YM and a +0.2986% high on NQ, neither of them the capture-level move and neither near the trigger.
Colour only, no levels published because no tier-1 route to a non-US cash index exists on this stack: mainland China was closed for its October holiday, demonstrated by a successful constituent pull whose series stops on 30 September rather than by a failed call. Japan was open and Japanese shares were reported higher on three separate syndicated headlines, direction with attribution and no level. Korea was reported shut on Monday. German August factory orders printed 10.6% lower on the month against a forecast of 1.0% lower, which would be a very large miss, but the route returns a null raw-actual field and a previous value inconsistent with its own raw figure, so it is carried with that caveat or not at all. No central bank rate decision fell in the window. A Bank of Japan governor’s speech was scheduled inside it with content unknown at capture.
Forward catalyst slate
Every date and time below comes from the two calendar routes at tier 2, corroborated across both where stated. Auction sizes are tier 1 from Treasury’s own API. No company release was deep-linked, so the earnings dates are calendar-sourced and no estimate or fiscal period is printed from them.
Today, Tuesday 6 October. August trade balance, 08:30 ET. The 6-week bill auction. The 3-Year note auction at 13:00 ET, $58bn. Three Fed speakers, a New York Fed president at 09:05 ET, a Board governor at 10:45 ET and a Dallas Fed president at 19:00 ET, of which only the governor appears on both calendar routes. Constellation Brands after the close.
Wednesday 7 October. The 9-Year 10-Month note reopening at 13:00 ET, $39bn. The September FOMC minutes at 14:00 ET on the authority of two calendar routes only: the Federal Reserve’s own FOMC calendar lists the meeting and a minutes link but carries NO release date, where earlier meetings show one, so the time is tier 2 and is not published as Fed-confirmed. Consumer credit. Levi Strauss after the close.
Thursday 8 October. Initial and continuing claims, 08:30 ET. Wholesale inventories, on which the two routes disagree about the prior. The 29-Year 10-Month bond reopening at 13:00 ET, $22bn. A St Louis Fed president at 13:40 ET. PepsiCo before the open.
Friday 9 October. Preliminary University of Michigan sentiment and inflation expectations, 10:00 ET. A Boston Fed president at 16:00 ET. Delta Air Lines before the open.
What is coiled. Three coupons and the minutes inside three sessions, into a curve that has just set the highest 10-year and 20-year closes of the eleven sessions held. The 3-year’s own trailing six auctions ran bid-to-cover 2.68, 2.54, 2.64, 2.60, 2.71 and 2.72, so today prices against a run that has been firming, and the last one cleared at 4.474% when the 3-year CMT mark was well below today’s 4.97%.
What is NOT this week, because it is commonly misplaced. There is no FOMC meeting: that is 27 to 28 October, a two-day meeting. There is no CPI print. The minutes are a Wednesday release and are not a decision.
Divergence flags
What did not reconcile on Monday, in order of how much it would cost to ignore.
1. The two exchanges disagreed in sign. NYSE advance/decline 0.913756, negative. Nasdaq advance/decline 1.167249, positive. One session after the Part 221 ledger recorded them agreeing for the first time in several sessions, they split again. New lows beat new highs on BOTH exchanges regardless, 77 to 40 and 103 to 47.
2. Ten of eleven sector proxies rose whilst 1,403 issues fell. A capitalisation-weighted proxy and a stock count measure different populations, and the gap between them IS the edition.
3. The technology proxy finished 7th of 11 on a day the Nasdaq-100 led. XLK +0.5605% against the Nasdaq-100’s +0.8716%. No contribution claim is attached, because no contribution data exists on this stack.
4. Volatility rose on a positive equity session. +1.37% on the VIX against +0.6634% on the S&P 500.
5. ISM services employment at 50.1 against September payrolls of 29,000, three days apart, and the services gauge is the one that says hiring.
6. The gold December premium over spot has been measured on a misaligned definition and the definition, not the value, was the fault. The misaligned form has been in use since it was pinned at Part 219, so this edition is the fourth to carry it. See the note below; this is the §16.4 deliverable this edition.
7. The 2 October fund-flow rows both restated. Bitcoin from a provisional 31.7 million dollars in to 189.9 million, a revision of 158.2 million, and ether from 17.3 million out to 37.4 million, in both cases because the single largest issuer’s cell finally appeared on a row that had reconciled to its own stated total without it.
8. A research return’s prose contradicted its own rows. The 20-year minus 30-year gap was characterised in prose as 0 basis points on 21 and 22 September; the same return’s dated rows give 5.33 against 5.29 on both dates, which is 4 basis points. The rows win and the prose was discarded. Drafted as a lesson.
9. The two attention boards returned identical content. The equities and all-asset boards came back as the same twenty-five names in the same order with zero crypto symbols, against eighteen rank shifts and six absences one edition earlier. Recorded as a possible route condition, NOT published as a divergence finding.
10. Two sentiment metrics opposed on three tracked names. The long-bond ETF reads canonical 69 bullish against a 58.4% bearish legacy split; Oracle reads canonical 29 bearish against an 88.75% bullish legacy split. Canonical published alone throughout, legacy discarded, never averaged.
11. The calendar routes disagree on forecasts and priors. They disagree on the ISM services forecast and on the services PMI prior, and in the latter case one route’s prior equals its own forecast, which is the named predictable failure shape. The disputed values are deliberately not reproduced here: no forecast or prior is published as a point figure where the two routes differ.
12. Only one fed-funds relay route was reachable, so no disagreement check was possible. On that single route a hold at the 27 to 28 October meeting is the heavily favoured outcome and a further 25 basis point hike the minority one. Bucket orientation was hand-checked against the current 3.75% to 4.00% target range and is not inverted. Tier 3, qualitative, direction named, and no probability is published as a figure.
13. The Zacks route returned different report types at one capture, so recommendation text and style scores are unavailable today for two tracked names and are NOT restated from a prior edition as current.
14. Unretrieved rather than divergent, recorded so it is not mistaken for a finding. Nasdaq total volume was not pulled, so no Nasdaq volume residual is computed. The NYSE residual is 0.712%, below all five tracked readings, but only five values are held and their session mapping is inferred, so no dated extreme is claimed. The C.H. Robinson cause rests on a wire deals listing nobody opened, so no deal is named. The December ES settlement is taken from the daily bar and was not verified against an exchange page. Yahoo omitted the 5 October row on two indices, the third distinct instance of that failure mode.
15. A superlative refused outright. Two wraps describe the Nasdaq Composite’s close as a record. No dated closing-level series for that index was retrieved on any route, so the claim is not published anywhere in this edition, in any of the five outputs. The word “record” is on the superlative list and a wire’s assertion of one is not a window.
The gold carry note (the §16.4 deliverable)
The measure this book has used for the December-futures-over-spot premium differenced the COMEX December settlement, struck 13:30 ET, against a spot mark taken from the 1-hour bar closing 30 minutes later. That is a misaligned basis, and the gap it leaves is post-settlement spot drift rather than carry. On the retired form Monday reads 20.14, which is 5.29 below a floor that held for ten sessions, and on 2 October it read 25.01, 0.42 below the same floor. Both “breaches” are mostly drift: +6.86 on Monday and +3.45 on 2 October.
Re-differenced against the 30-minute spot close struck at the settlement instant, the aligned series reads 31.46, 31.02, 29.81, 28.46 and 27.00 across 29 September to 5 October, four consecutive declines, and the same decomposition reproduces every held anchor to the cent. So the aligned value is inside the old numbers’ range and the old BAND does not transfer to it, because that band was calibrated on the retired definition.
The finding survives the re-specification and is the point. The held series is five values and four consecutive declines, 29 September to 5 October, whilst the curve cheapened at every maturity. Carry should widen as financing costs rise. It is doing the opposite, and it is now doing so on a definition that can be checked. This is the second time this measure’s DEFINITION rather than its value has been the fault.
Regime and sensitivity read (§17.3)
Running LOOSE, thirty-third consecutive edition, stated openly rather than presented as neutral. The diagnosis is unchanged and remains specification rather than tuning.
Monday produced three regime-grade observations and the tripwire saw none of them. An index and its own market disagreeing in sign on a count. A carry measure whose definition was wrong for five editions and whose corrected form still narrows against rising rates. And a day’s largest rates move with no Federal Reserve communication anywhere in the session to attribute it to.
Recommendation order, carried with one addition at position 4.
First, the intraday-path requirement on the attribution limb, vindicated prospectively for a second consecutive edition: the only honest statement about Monday afternoon is that it has no catalyst, and only the path establishes that.
Second, a two-sided volatility leg. Seventeen editions overdue. The VIX rose on an up day and a suppression-shaped leg sees neither the level nor the direction.
Third, splitting the turn condition into two separately-scored legs. Twelve attempts now.
Fourth, and NEW this edition: a leg on cross-exchange breadth SIGN disagreement. Monday’s two exchanges returned opposite signs on the same session one day after agreeing, and the existing candidate set has no instrument that looks at the relationship between two breadth series rather than at one of them.
Fifth, a leg on the new-high and new-low COUNTS rather than the advance-decline ratio. Monday is the instance that proves the case: the NYSE ratio fell from 1.52 to 0.91 whilst the counts deteriorated on both exchanges together, so the counts agreed across venues where the ratios did not.
Sixth, a leg on data-to-price transmission failure. Monday is the third instance in five editions.
Seventh, a leg on calendar-driven price formation. Carried unchanged.