Strategy blinked. ETFs bled $5.4 billion. The bid keeps leaving.
 Ahoy there, Trader! ⚓️
It’s Phil…
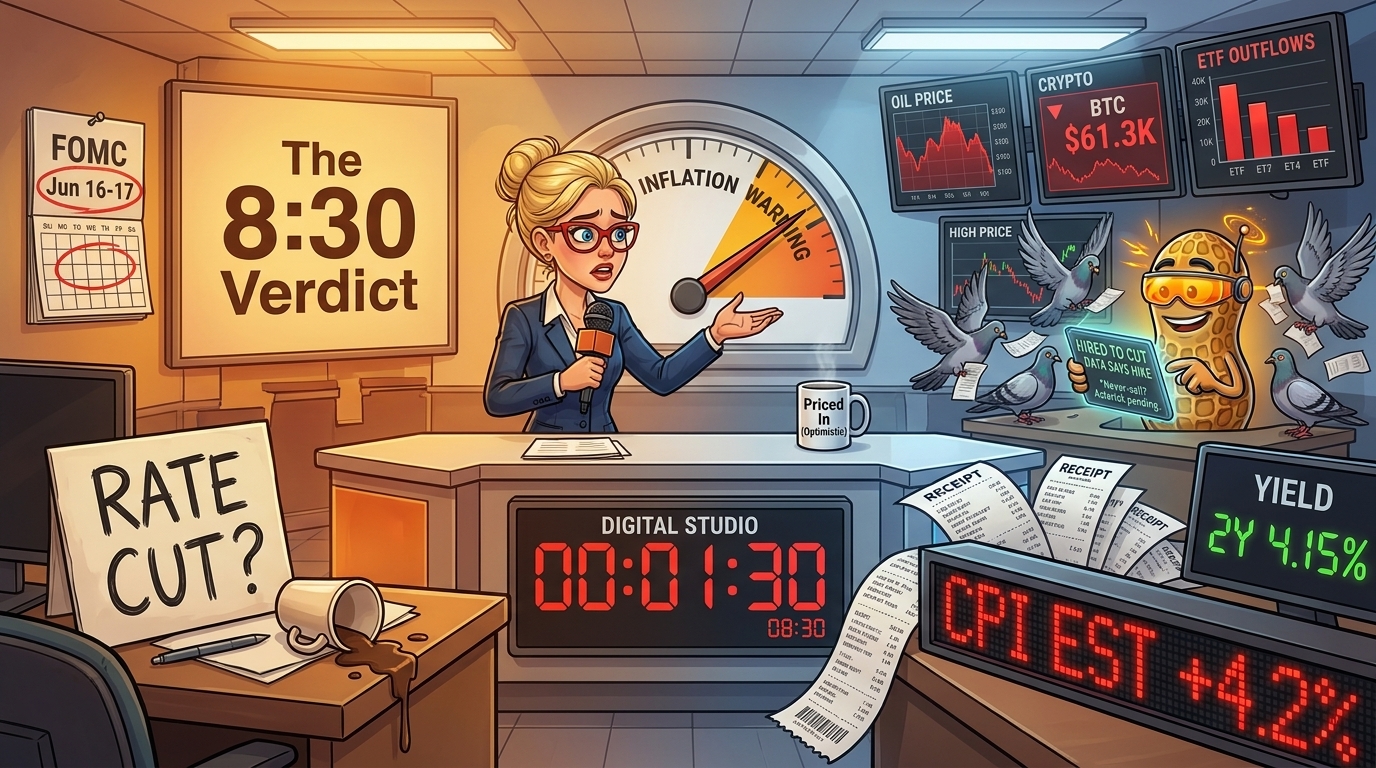
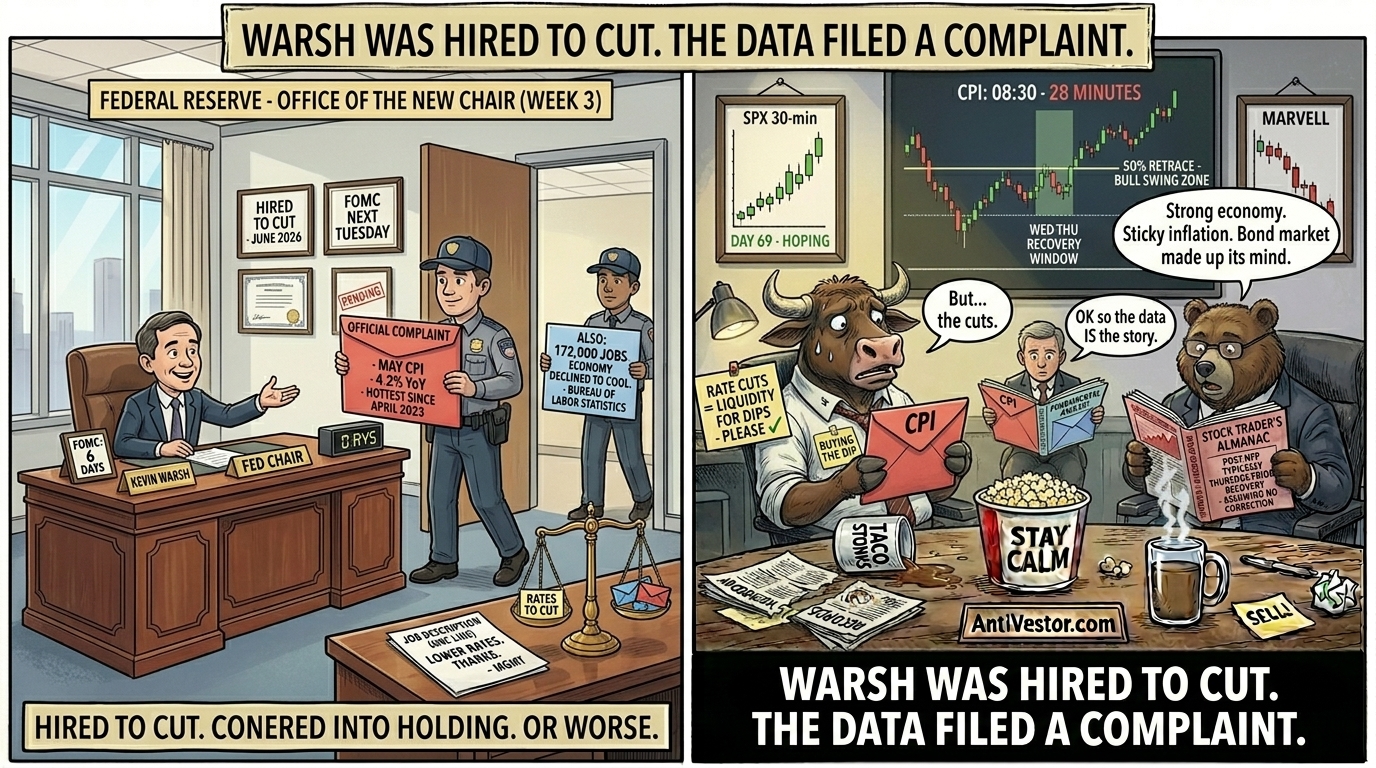
Warsh Was Hired to Cut. The Data Filed a Complaint. Three weeks into the job, the new Fed chair meets a 4.2% inconvenience.
Kevin Warsh accepted the Fed chair with one line in the job description: lower rates. This morning, at 8:30, May inflation arrives to read that line back to him slowly. Economists expect 4.2% year over year, the hottest since April 2023, up from 3.8%. Core near 2.9%. Energy supplied most of the heat, courtesy of a Gulf conflict that keeps forgetting to end.
Then Friday’s jobs report doubled consensus at 172,000, because the economy, having been asked to cool, declined. Strong hiring, stubborn prices, a bond market that has made up its mind. Two-year yields sit at 4.15%. The odds of a 2026 rate hike now clear 70%. The cuts Warsh was hired to deliver have quietly left the building.
Equities entered the print coiled, having spent Tuesday falling on fresh Iran strike chatter and Friday losing a trillion dollars in chips for reasons it would rather not discuss. Futures sit near flat, holding their breath.
One number decides whether Warsh’s first meeting next week is a victory lap or an apology tour. The Fed he was hired to loosen is limbering up to tighten.
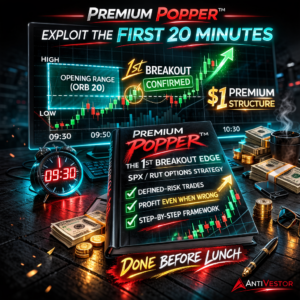
Get The Complete Premium Popper System – Automation Included
Your entry ticket to consistent SPX income. Inside: the exact setup, rules, and checklists I trade daily – for less than the cost of lunch. Easily actionable.
Get The Premium Popper System – Click Here
Stock Market Edge
A Trillion Dollars in Chips Did a Lap and Came Back Tired. The market coiled. The spring is labelled CPI.
Premarket snapshot:
Futures sat within a tenth of a percent of flat near 09:00 ET, the universal posture of a market that has decided to let someone else go first. Tuesday’s session closed lower on fresh Iran strike chatter. Friday’s 2.6% drop ended a nine-week win streak with no ceremony.
Sector rotation:
Semiconductors remain the mood ring. The PHLX index fell 10% Friday, roughly a trillion dollars, found dip buyers Monday, then handed it all back Tuesday. Nvidia, Broadcom and Micron led the round trip in both directions, impressively.
Earnings or guidance:
SailPoint fell 12% after posting a surprise loss of 13 cents where the street wanted a four-cent profit, though revenue rose 22% to $280 million. Apple’s developer conference, Tim Cook’s last as chief, promised a smarter Siri, eventually.
Cross-asset nuance:
The two-year yield at 4.15% is a market pricing tightening while everyone politely discusses easing. The VIX spiked over 20% Friday, then calmed below 19, as fear does when nothing has actually been resolved. Brent near $93 keeps energy underneath the whole session, the variable nobody can model and everybody can feel.
📊 There’s a level on SPX I’m watching closely this morning. My full analysis briefing has it – plus what happens if we hold it, and what happens if we don’t. [Read it here →]
Crypto Market Edge
The Company Famous for Never Selling Sold a Bit, Quietly. Bitcoin slips under $61K while the institutional bid finds the door.
Price snapshot:
Bitcoin traded near $61,300 early Wednesday, down about 3%, after a brief and unloved visit below $60,000 earlier in the week. Ethereum sat near $1,624, off 2 to 4%. The total market hovered at $2.11 trillion, dominance steady at 58%, a figure that flatters the majors only because the alts are doing worse.
Flows & positioning:
Spot Bitcoin ETFs shed another $77 million Tuesday, extending four-week outflows to $5.4 billion, one week of which set a $1.72 billion record. BlackRock’s IBIT did most of the leaving. Ether funds, not to be outdone, set their own outflow record.
Leadership & rotation:
Weakness was democratic. Solana, XRP near $1.12 and BNB near $588 all fell together. The Fear and Greed Index sits in extreme fear, the zone where capitulation and bargain occasionally share a postcode.
Catalysts & roadmap:
Strategy, the treasury built entirely on the promise of never selling, sold, then explained it was tax planning. Markets nodded politely and priced it as a signal anyway. Today’s CPI decides the next direction, for whoever is left.
TL;DR – The Bottom Line
- May CPI lands at 8:30, seen at 4.2%, the hottest since April 2023. Warsh was hired to cut. The data appears to have other plans, in writing.
- Two-year yields at 4.15%, hike odds past 70%, jobs that doubled consensus at 172,000. The economy refused to cool on schedule. Awkward for everyone involved.
- Chips lost a trillion Friday, found buyers Monday, lost them Tuesday. The S&P sits coiled near flat, waiting for one number to ruin or rescue the week.
- Bitcoin under $61K, ETFs down $5.4 billion in four weeks, and Strategy, the never-sell brand, sold. The believers are quietly checking the exits, one browser tab at a time.
- Brent near $93 after round-tripping $98 on a ceasefire that exists mainly in press releases. Hormuz stays shut. Energy keeps writing the whole inflation story underneath.
📌 Fun Fact
The “exhaustion bar” on this morning’s chart – whose name, as I noted, doesn’t really matter – sits inside a candlestick analysis tradition with a much longer history than most people realise.
Candlestick charting was developed in Japan in the early 1700s by Munehisa Homma, a rice merchant from Sakata who traded on the Dōjima Rice Exchange in Osaka – one of the earliest organised commodity markets in the world.
Homma reportedly amassed a fortune by analysing the open, high, low, and close of daily rice prices and noticed that the relationship between those four numbers contained reliable information about supply, demand, and the psychology of the other traders in the pit.
He recorded his observations in a treatise, Sakata’s Five Methods, which described patterns that today’s chartists would recognise as the building blocks of modern candle pattern analysis.
The Western world did not encounter candlestick analysis seriously until 1991, when Steve Nison published Japanese Candlestick Charting Techniques. Nison’s book introduced the formal English-language names for the patterns – doji, hammer, shooting star, hanging man, evening star, exhaustion bar and many others.
Each is, in Homma’s terms, a slightly different shape of the same four-number relationship at a particular point in a price series.
The names matter less than the shape. The shape matters less than where it appears. And where it appears matters less than what gets traded at the level when it does. Munehisa Homma was, in this sense, two and a quarter centuries ahead of Twitter chartists arguing about whether Tuesday’s print was a hammer, an exhaustion bar, or a hanging man with bullish implications.
[Sources: Munehisa Homma, Sakata’s Five Methods (c.1755),
historical Japanese commodity trading literature;
Steve Nison, Japanese Candlestick Charting Techniques
(New York Institute of Finance, 1991); public]
Meme of the Day:
Happy trading,
Phil
Less Brain, More Gain
…and may your trades be smoother than a cashmere codpiece
p.s. There are 3 ways I can help you…
- Option 1: The SPX Income System Book (Just $12)
A complete guide to the system.
Written to be clear, concise, and immediately actionable.
>> Get the Book Here
- Option 2: Full Course + Software Access – 50% off for Regular Readers – Save $998.50
Includes the video walkthroughs, tools for TradeStation & TradingView, and everything I use daily. Plus 7 additional strategies
>> Get DIY Training & Software
- Option 3: Join the Fast Forward Mentorship – 50% off for Regular Readers – Save $3,000
>> Join the Fast Forward Mentorship – trade live, twice a week, with me and the crew. PLUS Monthly on-demand 1-2-1’s
No fluff. Just profits, pulse bars, and patterns that actually work.