Seven basis points, no Fed input, and our own flag broken first
 Ahoy there, Trader! ⚓️
It’s Phil…
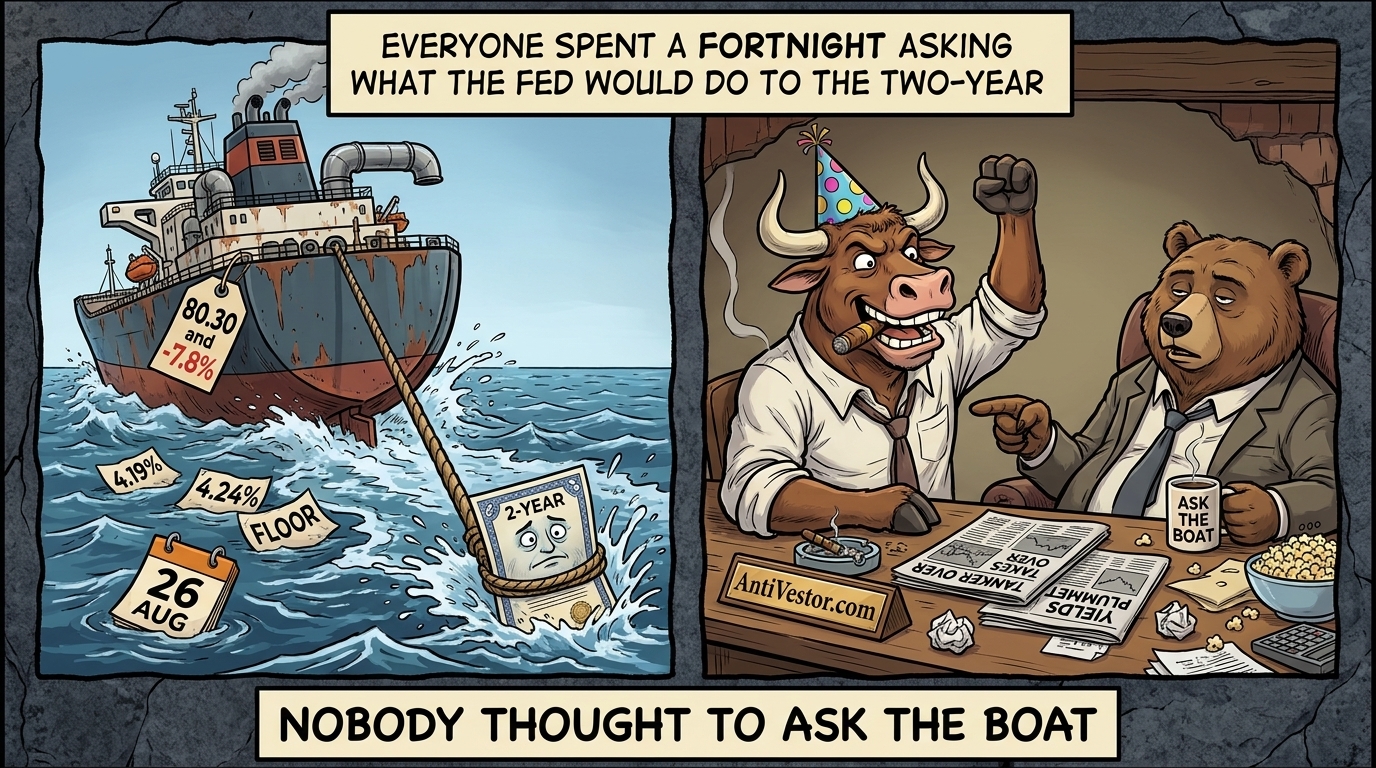
The Floor Was Never a Floor Four identical closes made 4.19% look like bedrock. It lasted two sessions.
On Friday this letter told you the two-year Treasury had stopped functioning as a price. It had closed at 4.19% four sessions running, through a doubled buyback, hawkish minutes and a 700-point Dow day, and we said the instrument had gone quiet because the argument had moved elsewhere.
On Monday it printed 4.24%. On Tuesday it printed 4.24% again, and we said it had woken up and filed a flag saying the new level would hold through this week’s inflation print.
On Tuesday it closed at 4.17%.
That is below the floor of both stories. Seven basis points in a session, two below a level that four consecutive closes had made look like bedrock, and it is our own flag that it broke first.
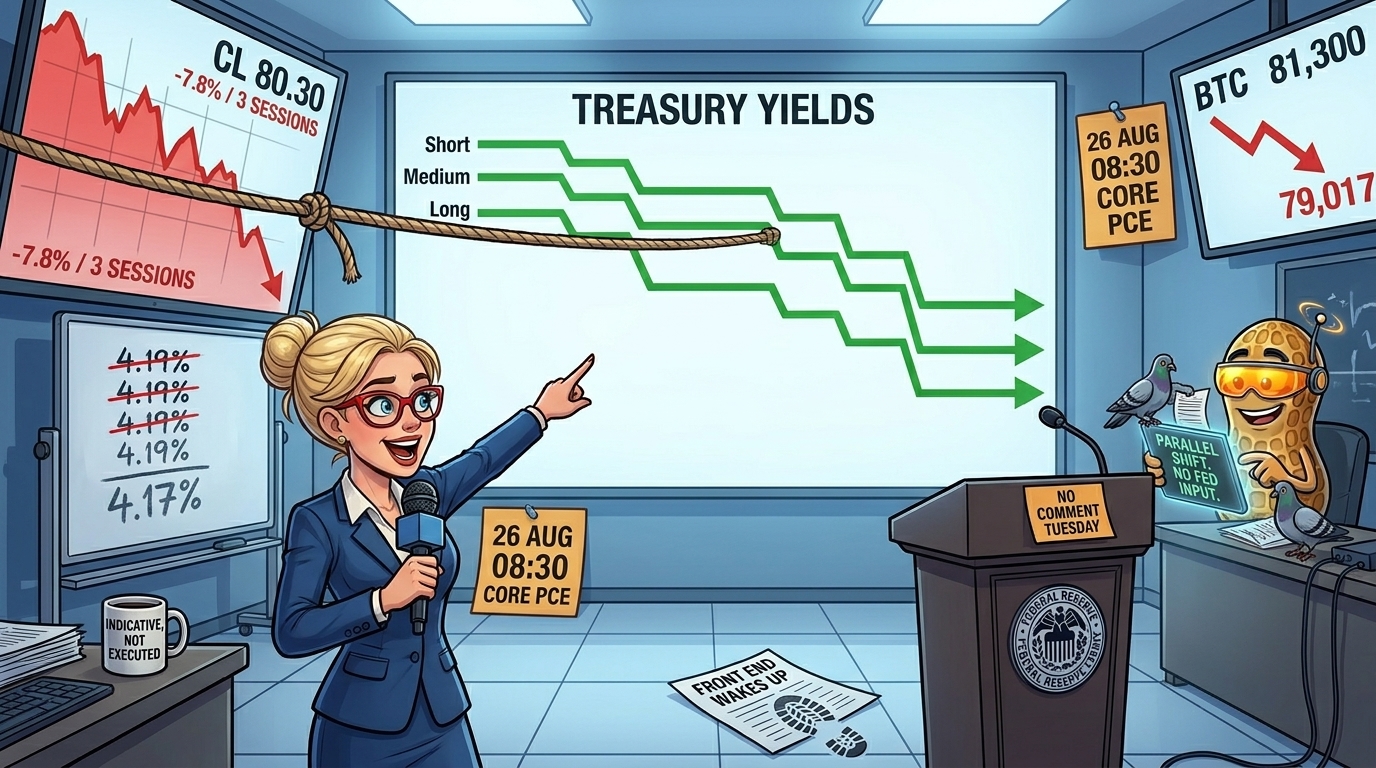
Here is the part worth your coffee. The Federal Reserve said nothing on Tuesday. There was no data. The ten-year came down six basis points and the thirty-year came down six, the entire curve shifting bodily lower in one piece.
What moved was oil. West Texas Intermediate has fallen 7.8% in three sessions on corridor talks and a sanctions package that arrived softer than the positioning.
The instrument built to price the committee took its instructions from a shipping lane.
The One That Mattered
August was spent arguing whether the front end was broken or fixed. Both camps had the causal arrow backwards. A parallel six-to-seven basis point shift across two, ten and thirty years, on a session with no Fed speaker and no print, is not a policy signal. It is an energy signal in policy dress. Crude fell 7.8% in three sessions and the curve simply followed it down, obediently, at every maturity. Which leaves the question a news letter cannot answer. If the 2-year is taking its instructions from the price of crude rather than from the Fed, what is the front end actually pricing?
We went down that rabbit hole in today’s Macro Edge. [Read it here]
Collect Morning Income
– Learn More
Stock Market Edge
Chips Buy Themselves Back the Day Before the Verdict Nvidia ends a seven-day slide on the eve of its own earnings
Premarket snapshot:
S&P 500 futures at 7,684.75, down 0.09%. Nasdaq futures off 0.26% at 29,201.00. Tuesday’s cash close was 7,677.28, up 0.32% and nine points shy of the August record, which the index has now been politely not making for a fortnight.
Sector rotation:
Semiconductors spent Monday being sold ahead of the print meant to justify them, then spent Tuesday buying themselves back. AMD 4.9%, Micron 2.5%, Intel above 2%. Nvidia rose 2% and ended a seven-day losing streak, its longest since 2022, which is a remarkable way to arrive at your own earnings. The iShares Semiconductor ETF had shed 2.7% the session before.
Earnings or guidance:
Nvidia reports after the close against consensus of 92 billion dollars and 2.09 a share, versus its own guide of 91.0 billion plus or minus 2%. Data-centre revenue is expected above 85.4 billion. The street is asking for 0.9% more than management promised. Forty analysts have concluded that the company is very slightly sandbagging, which is less a forecast than a personality assessment.
Cross-asset nuance:
Two-year 4.17%, ten-year 4.64%, thirty-year 5.17%. Six to seven basis points off each, in the same direction, on the same day, for the same reason, and the reason was not monetary.
📊 There’s a level on SPX I’m watching closely this morning. My full analysis briefing has it – plus what happens if we hold it, and what happens if we don’t. [Read it here →]
Crypto Market Edge
The Rejection Arrived Exactly Where It Was Advertised Ether takes the flow whilst a treasury raises two billion from equity
Price snapshot:
Bitcoin went through 80,000 dollars overnight, touched 81,300, and was back at 79,017.85 by 04:15 ET. The first genuine rejection since the run began on 19 August, and it arrived exactly where the chart said, in the 80,000 to 83,000 shelf everybody had marked. Being right about resistance is the cheapest way to be right.
Flows and positioning:
Ether funds took roughly 470 million dollars on Wednesday’s count against 184 million into bitcoin products. The second-largest asset is drawing better than twice the flow of the largest. The week to 21 August brought 2.62 billion combined, a 2026 record, which is the sort of number that precedes somebody explaining it was obvious all along.
Leadership and rotation:
Ether near 2,470 dollars, roughly 30% over seven days against bitcoin’s 23%. XRP holds 1.48 dollars and Solana 96.55. Beta is leading, which is what a flow-driven advance looks like right up until the flow stops.
Catalysts and roadmap:
Strategy sold 18.26 million of its own shares between 17 and 23 August and raised close to two billion dollars. During the best bitcoin week since 2023. From equity. It also bought back 1.43 million preferred shares for 136.4 million. The vow was never to sell the coin. Nobody promised anything about the company holding it.
Collect Weekly Income
Learn More
TL;DR – The Bottom Line
- The two-year closed 4.17%, seven basis points down and below a level four consecutive sessions had made look structural. Our own flag, filed Monday, broke first.
- Nothing came from the Fed. Ten-year down six, thirty-year down six, the curve shifting bodily. A parallel move with no monetary input is an energy signal.
- Crude fell 7.8% in three sessions to 80.30 dollars, undoing thirteen gains in fourteen days on corridor talks and a sanctions package softer than expected.
- Nvidia reports after the close against a bar 0.9% above its own guidance. Chips spent Monday selling the print and Tuesday buying it back.
- Core PCE and Q2 GDP at 08:30 ET, Nvidia after the bell, Warsh at Jackson Hole Friday. Three chances this week for the front end to explain itself.
📌 Fun Fact
The Yield Everyone Watches Is Not a Price Anyone Paid Treasury’s constant maturity series is built from quotes, not trades
The two-year CMT yield is interpolated from a curve fitted to bid-side quotations the New York Fed collects at around 15:30 each trading day. Indicative, not executed. And because the number is read off the curve at a fixed maturity, there need not be a bond outstanding with exactly two years left to run. We have all spent August arguing about a figure that is, strictly speaking, a very well-informed opinion.
Meme of the Day:
Happy trading,
Phil
Less Brain, More Gain
…and may your trades be smoother than a cashmere codpiece
p.s. There are 3 ways I can help you…
- Option 1: Collect Morning Income (Just $12)
A complete guide to the Premium Popper system.
Written to be clear, concise, and immediately actionable.
>> Learn More Here
- Option 2: Collect Weekly Income (Just $12) –
A complete guide to the Tag ‘n Turn system.
>> Learn More Here
- Option 3: Join the Fast Forward Mentorship
>> Join the Fast Forward Mentorship – trade live, twice a week, with me and the crew.
PLUS Monthly on-demand 1-2-1’s
No fluff. Just profits, Tag ‘n Turn Pulse bars, Poppers, and Patterns that actually work.