 Ahoy there Trader! ⚓️
It’s Phil…
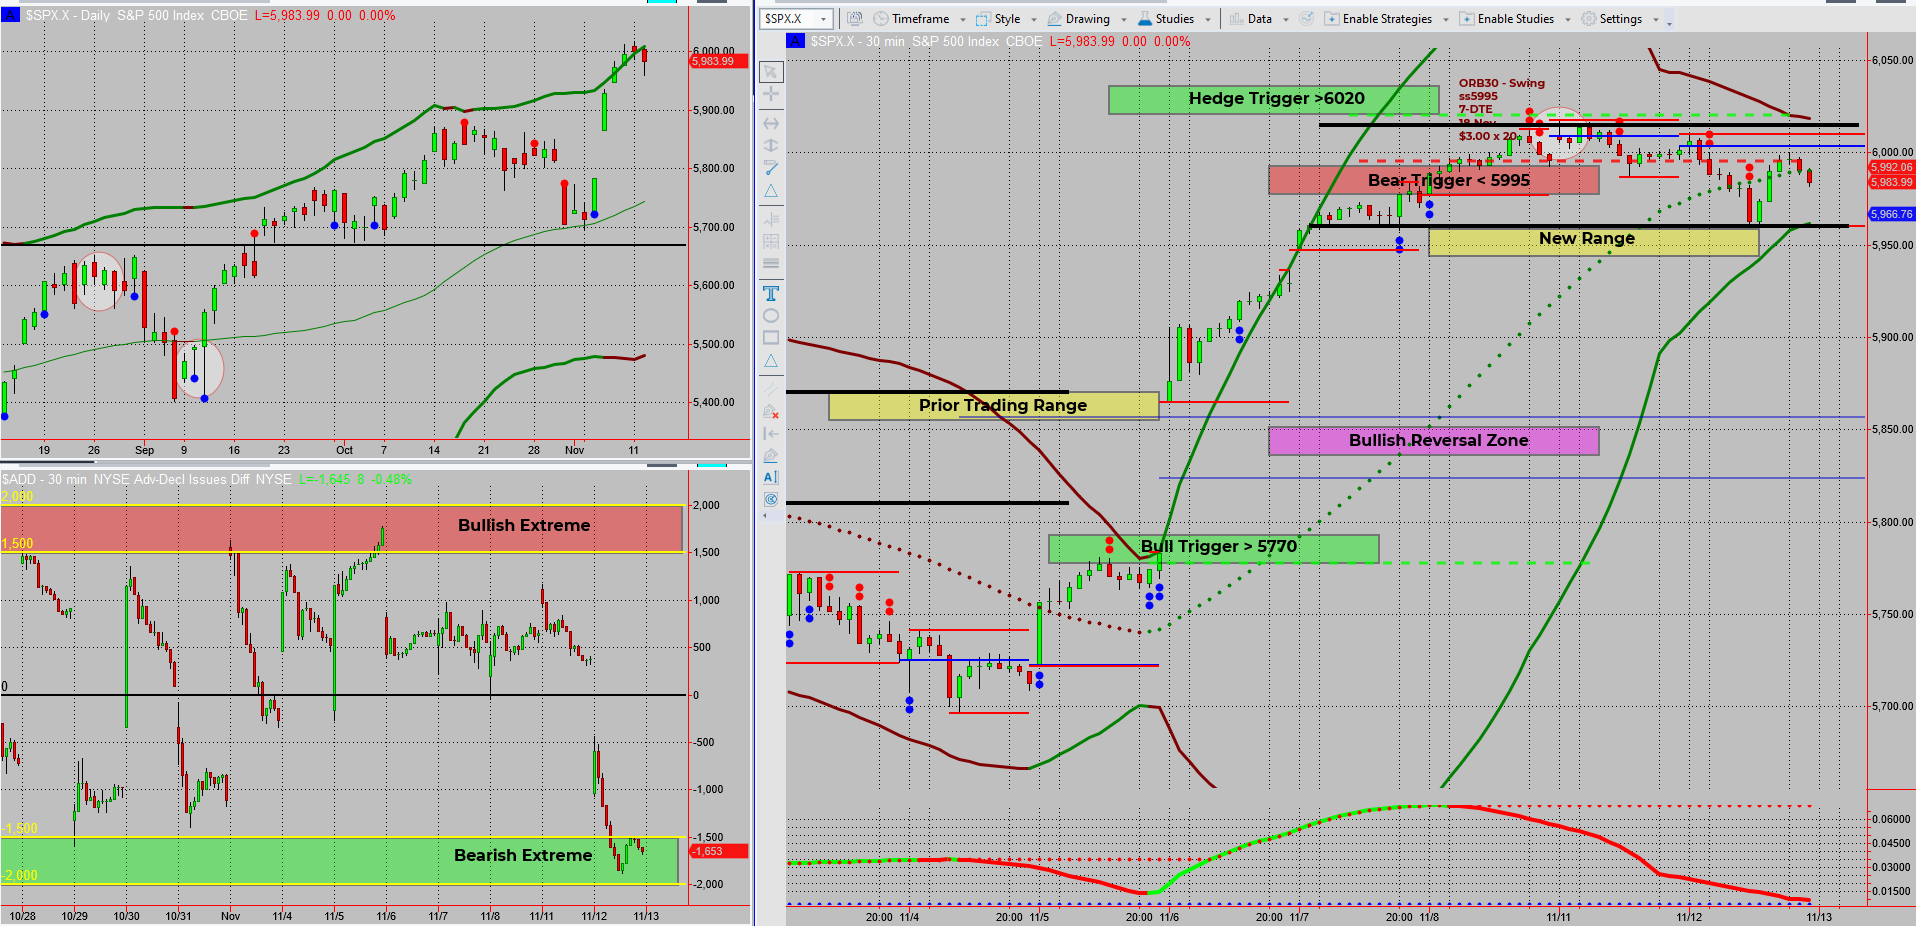
SPX is taking a scenic route, drifting sideways with a touch of bearish flair. The Bollinger Bands have squeezed into a “pinch point,” creating a tidy containment zone that hints at an upcoming breakout. But don’t get too comfy; red flag news from midweek could stir up some serious market action.

This Proven 3-Step “10 min/Day” 6-Figure Unconventional Recession Proof SPX Income System Unlocks $500-$5,000+ Days FAST! …
SPX is behaving as expected, drifting sideways with a bearish tilt. The Bollinger Band width is confirming the anticipated “pinch point,” signaling that prices are treading water. I’m eyeing those band boundaries as a containment zone for this range.
Here’s what we’re seeing:
- Pinched Bands: The Bollinger Bands are squeezed tighter than a vintage ‘80s headband, signaling we’re in for a break—up or down.
- Range-Bound Moves: Until proven otherwise, we’re trading within this zone, ready to pounce at the first sign of a breakout.
- Red Flag Alert: Brace yourselves! The real fun begins mid-week. With key economic news lined up from Wednesday through Friday, we might finally see this market stretch its legs.
- Overnight Drama: Futures are already pushing lower, with Dow Futures making a break through yesterday’s lows. But don’t get too cozy with the bear vibe—markets can flip faster than a gymnast in a final routine.
Eyes peeled for bullish triggers if things change!
In this current market, flexibility is your best friend. I’m watching closely for signs of life beyond the containment zone and prepping for the breakout that could finally kickstart the next trend.
Fun Fact
Did you know the S&P 500, the benchmark index for U.S. stocks, was created in 1957 but traces its roots back to a smaller index first published in 1923? It started with just 233 companies before expanding to the 500-stock power index we know today.
The S&P 500 has become synonymous with the U.S. stock market, but its story began as a humble 233-stock index in 1923. It wasn’t until 1957 that it was expanded to 500 companies and began being calculated by computers—a groundbreaking move at the time. This leap in scope made it a comprehensive reflection of the U.S. economy’s overall health, tracking everything from tech giants to traditional industrial firms. Today, it’s a global benchmark that investors and traders around the world follow closely.
Happy trading,
Phil
Less Brain More Gain
…and may your trades be smoother than a cashmere codpiece
