We Are Bullish – SPX Tag n Turn Fired Off Friday And Remains Bullish Until Bearish
 Ahoy there, Trader! ⚓️
It’s Phil…
Let’s keep it short and sweet today.
We are bullish.
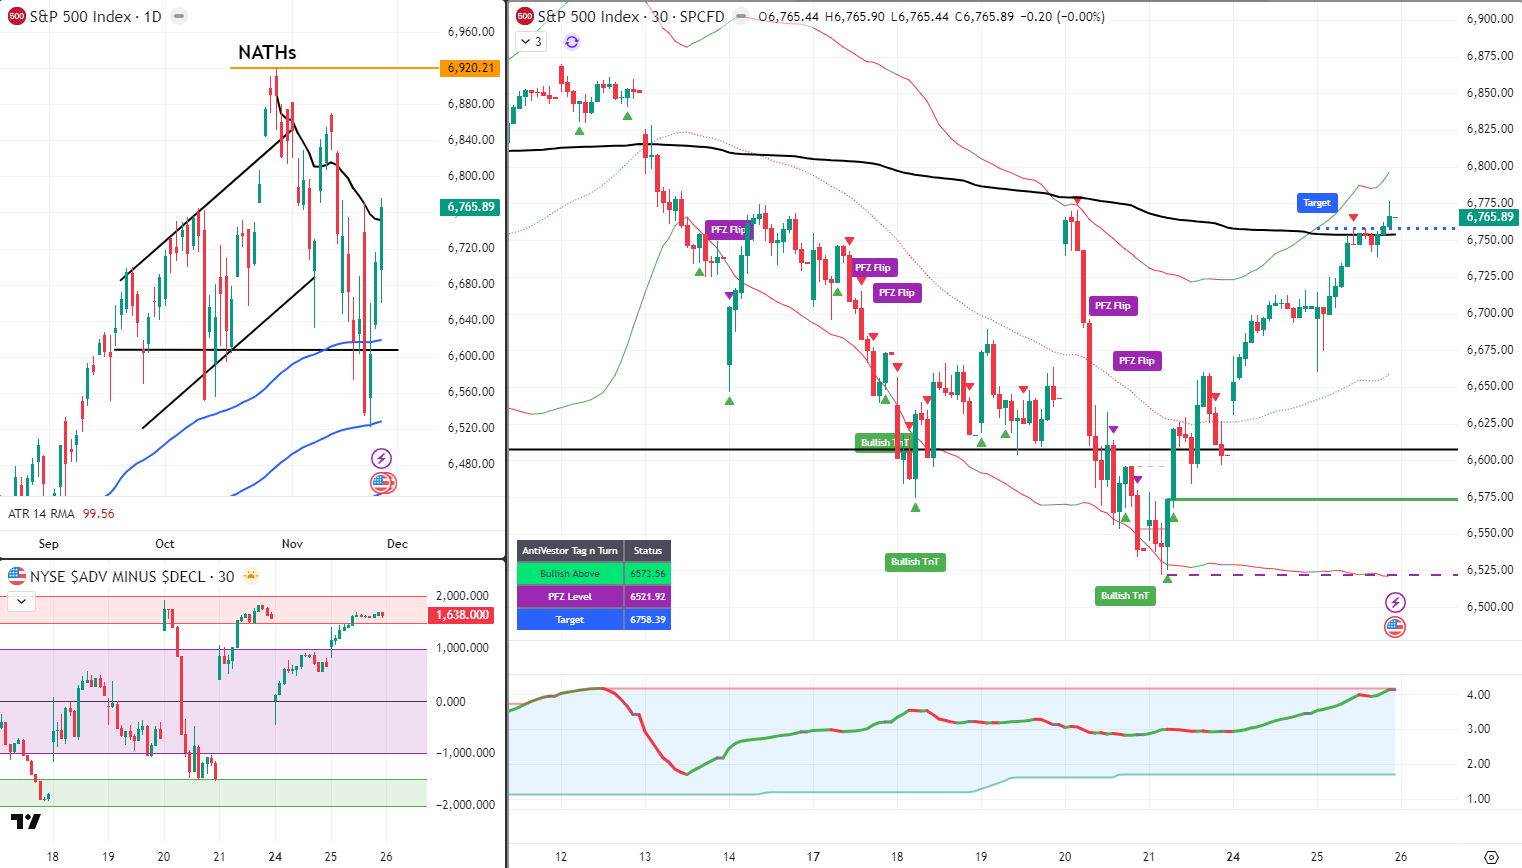
SPX Tag n Turn fired off on Friday and we remain bullish until we are bearish.
And we are a cat’s whisker away from tagging the upper Bollinger Band.
RUT also fired bullish last Friday and has been on a rampage higher, literally hugging the upper Bollinger Band.
There was a brief Tag n Turn to bearish which flipped back bullish just as quick.
In both cases the Bollinger Bands are still fanning out, which is more pronounced on RUT.
One pro tip for determining a strong trending environment is:
One – when price hugs, in this case, the upper Bollinger Band.
Two – when the BB width continues to widen AND the lower BB starts to point upward.
Which is what we are currently seeing on RUT.
So IF this continues we are looking at a strong trending move.
And IF the BB width starts to contract we may be about to pause.
Also as we are back near the middle of the daily range after an attempted break lower – this seems a sensible place for max pain for those bears to be “stopped out.”
So if we are to see a push back to retest lows – from approximately here seems sensible.
Otherwise, back to the highs we go.
Keep scrolling for the Bollinger Band trend strength breakdown…
2 Indexes Bullish. 2 Bands Fanning. 1 Pro Tip Worth Knowing.

SPX Market Briefing:
Wednesday November pre-Thanksgiving reviews bullish stance (SPX Tag n Turn fired Friday remaining bullish until bearish with cat’s whisker from upper Bollinger Band target),
RUT also fired bullish Friday (rampage higher literally hugging upper BB with brief bearish flip that snapped back bullish just as quick),
Bollinger Bands fanning out on both (more pronounced on RUT),
pro tip for strong trending environment (price hugs upper BB, BB width continues to widen AND lower BB starts to point upward – seeing exactly this on RUT),
IF continues = strong trending move (IF BB width contracts = pause incoming),
back near middle of daily range after attempted break lower (sensible max pain zone for bears to get stopped out, retest lows from here or back to highs).
Current Multi-Market Status:
- SPX: Bullish TnT, PFZ 6521.92, Target 6758.39 (nearly tagged at current 6,765)
- RUT: Bullish TnT (flipped back), PFZ 2459.29, Target Pending, current ~2,396, hugging upper BB
Bullish Until Bearish
We are bullish.
SPX Tag n Turn fired off on Friday and we remain bullish until we are bearish.
That’s the systematic approach. No guessing. No hoping. Signal fires, we follow.
And we are a cat’s whisker away from tagging the upper Bollinger Band.
SPX currently at 6,765 with our TnT target at 6758.39 – essentially there. PFZ level sits at 6,521.92 providing the floor.
Current Status: SPX bullish TnT active, target nearly tagged
RUT Rampage
RUT also fired bullish last Friday and has been on a rampage higher, literally hugging the upper Bollinger Band.
When I say hugging, I mean proper bear-hug-your-aunt-at-Christmas hugging. Price glued to that upper band.
There was a brief Tag n Turn to bearish which flipped back bullish just as quick.
Market doing its best impression of someone who can’t decide between pumpkin and pecan pie. Bearish? Nah. Back to bullish. Sorted.
Current Status: RUT bullish rampage, hugging upper BB
Pro Tip – Strong Trending Environment
One pro tip for determining a strong trending environment is:
One – when price hugs, in this case, the upper Bollinger Band.
Two – when the BB width continues to widen AND the lower BB starts to point upward.
This is the bit most traders miss. They watch price. They watch the upper band. Systematic traders watch the lower band.
Which is what we are currently seeing on RUT.
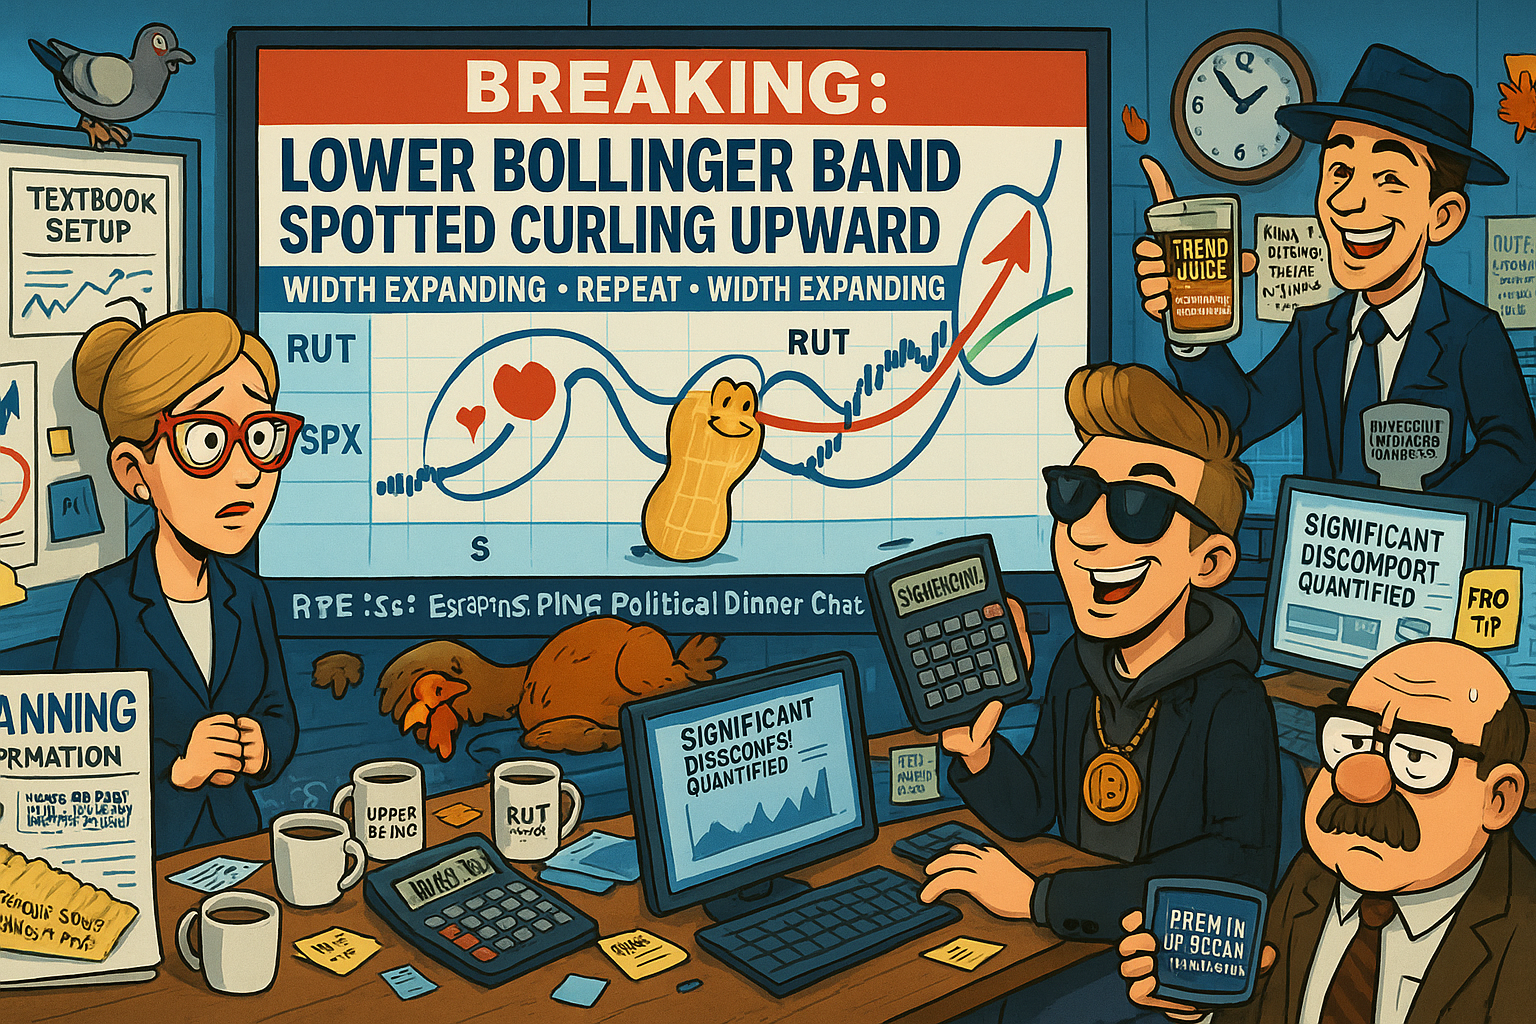
Bands fanning out. Lower BB curling upward. Textbook trend strength confirmation.
In both cases the Bollinger Bands are still fanning out, which is more pronounced on RUT.
SPX showing it too, but RUT’s the poster child right now.
Current Status: RUT showing textbook trend strength signals
What Happens Next
So IF this continues we are looking at a strong trending move.
Continuation pattern. Trend stays strong. We ride.
And IF the BB width starts to contract we may be about to pause.
Contraction = consolidation incoming. Watch for it.
Current Status: Continuation or pause – bands will tell us
Max Pain Zone
Also as we are back near the middle of the daily range after an attempted break lower – this seems a sensible place for max pain for those bears to be “stopped out.”
Middle of range. Bears who positioned for breakdown now sweating. Sensible stop-out zone.
So if we are to see a push back to retest lows – from approximately here seems sensible.
Otherwise, back to the highs we go.
Binary outcome from here. Retest lows or highs. No sideways nonsense.
Current Status: Max pain zone, binary outcome ahead

In Other News…
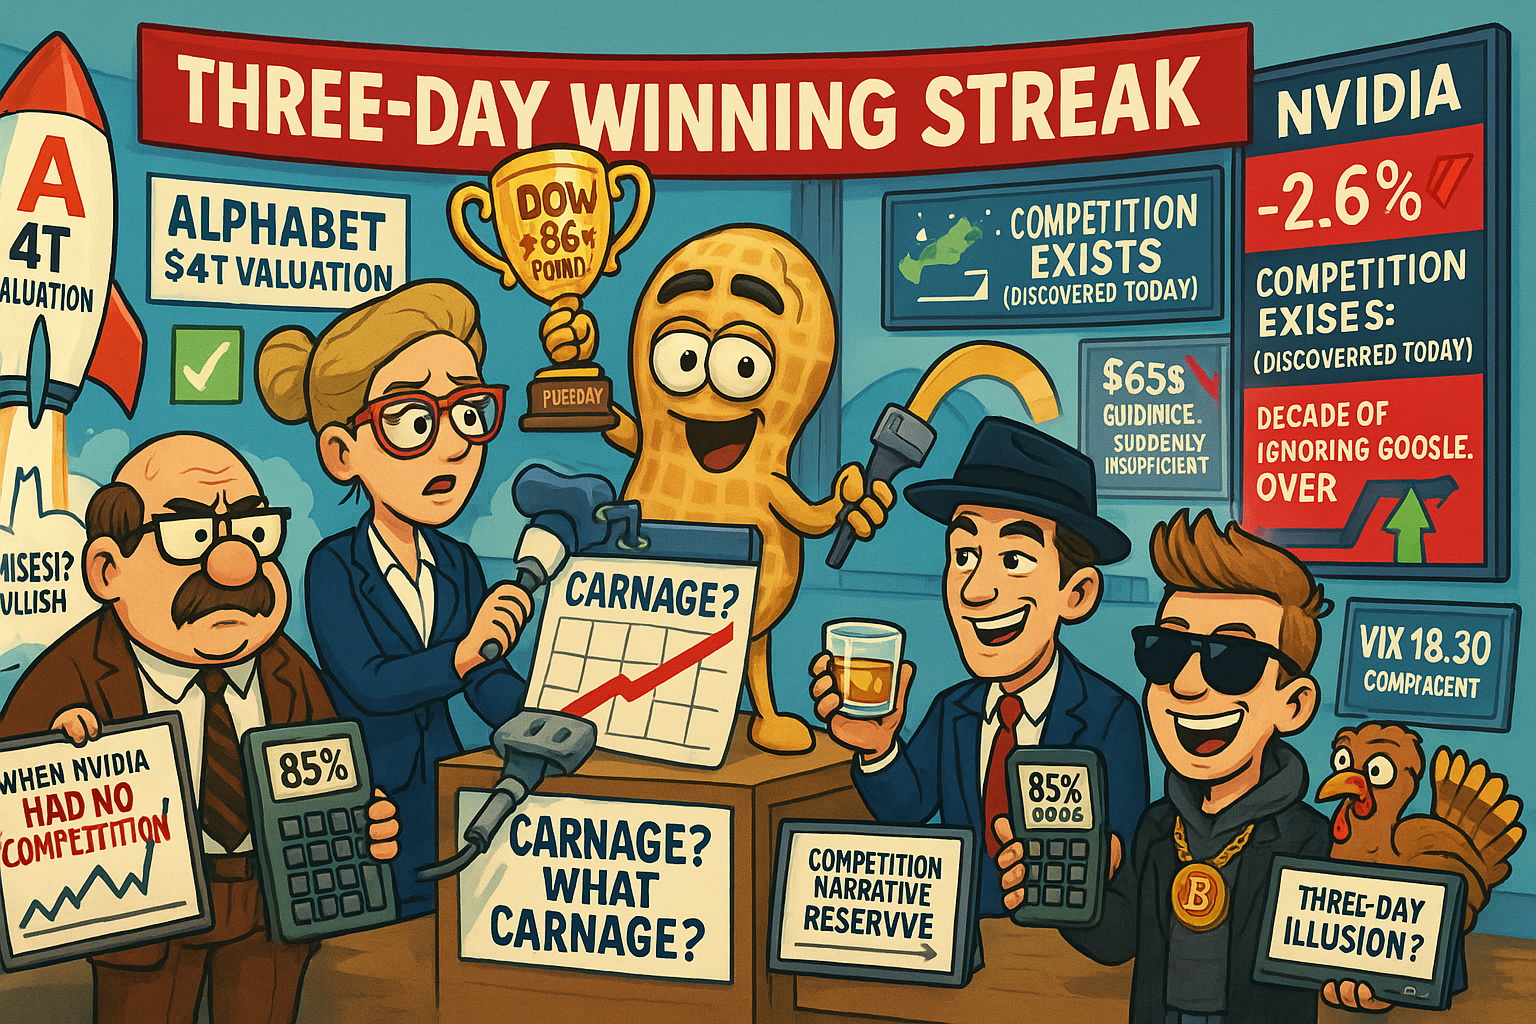
Three-Day Rally: Markets Forget Month of Carnage
85% rate cut odds fix everything. Alphabet approaching $4T. Nvidia discovers competition exists.
Markets extended three-day winning streak as December rate cut probability hit 85%—investors celebrating Fed promising cheaper money solves all problems including November’s massacre. Alphabet hit 13th record this month approaching $4T valuation (up 70% YTD) whilst Nvidia fell 2.6% as Google TPU competition suddenly matters after decade of ignoring it. VIX dropped to 18.30 signaling complacency heading into year-end because apparently forgetting recent panic constitutes confidence.
When Competition Narrative Shifts Overnight
Alphabet’s TPU chip partnership with Meta shifted narrative from “Nvidia monopoly forever” to “Google chips suddenly credible” within 72 hours. Nvidia fell 2.6% as markets processed possibility that $65B quarterly guidance and $500B order book might face actual competition. Magnificent Seven diverging internally—Alphabet records whilst Nvidia stumbles—proving even trillion-dollar companies can rotate against each other.
85% Cut Odds Become Market’s Entire Thesis
Fed December cut probability at 85% becomes sole explanation for three-day rally despite nothing fundamental changing. Curve steepening with 10-year at 3.94% signals easing confidence whilst oil struggles at $58 and gold holds $4,158 below October’s $4,379 peak. Thanksgiving week volume typically light meaning three days of gains potentially illusion created by thin liquidity.
☕ Hazel’s Take
Three-day rally erases memory of November carnage, 85% cut odds justify everything, Alphabet records whilst Nvidia discovers competitors. When VIX “complacently” drops to 18.30 heading into holiday week, probably acknowledging thin volume rally not conviction change.
—Hazel, FinNuts
Expert Insights:
The Observation: Most traders fixate on price relative to the upper Bollinger Band during uptrends. That’s surface level. The real tell is what the lower band is doing.
The Fix: When the lower BB starts pointing upward during a move higher, you’re looking at genuine trend strength, not just a pop. The bands aren’t predicting – they’re confirming. And systematic traders don’t need predictions. We need confirmation. Watch the lower band. It’s telling you what the crowd doesn’t see.
Rumour Has It…
The Financial Nuts team reports from the newsroom…
Percy’s been tracking the Bollinger Band width on his notepad all morning, muttering something about “fanning formations” and “textbook setups.” Three pages of lower band angles already calculated.
Hazel pointed out that RUT’s rampage higher looks like someone trying to escape a family dinner conversation about politics. “Just keeps hugging that upper band and refusing to come down.”
Mac labelled his latest glass “UPPER BB HUG – CONTENTS UNDER PRESSURE” whilst Kash ran the numbers on max pain zones, concluding that bears positioned for breakdown are currently experiencing what he technically termed “significant portfolio discomfort.”
Wallie summed it up from the grumpy corner: “Price hugs band. Width fans out. Lower band curls up. That’s not a rumour – that’s a trend. Even I can see it.”
This is entirely made-up satire. Probably!
Breaking scoops courtesy of the Financial Nuts Newswire-because who needs sanity?
Fun Fact:
Since 1928, the S&P 500 has finished Thanksgiving weeks positive 60% of the time with an average return of 0.28% – double a typical week’s 0.14% return. In presidential election years, the numbers jump to 75% positive with an average return of 0.88%.
[Source: Bank of America – via Inc.com – “Thanksgiving Is Great for the Stock Market” ]
Happy trading,
Phil
Less Brain, More Gain
…and may your trades be smoother than a cashmere codpiece
p.s. There are 3 ways I can help you…
- Option 1: The SPX Income System Book (Just $12)
A complete guide to the system.
Written to be clear, concise, and immediately actionable.
>> Get the Book Here
- Option 2: Full Course + Software Access – 50% off for Regular Readers – Save $998.50
Includes the video walkthroughs, tools for TradeStation & TradingView, and everything I use daily. Plus 7 additional strategies
>> Get DIY Training & Software
- Option 3: Join the Fast Forward Mentorship – 50% off for Regular Readers – Save $3,000
>> Join the Fast Forward Mentorship – trade live, twice a week, with me and the crew. PLUS Monthly on-demand 1-2-1’s
No fluff. Just profits, pulse bars, and patterns that actually work.
