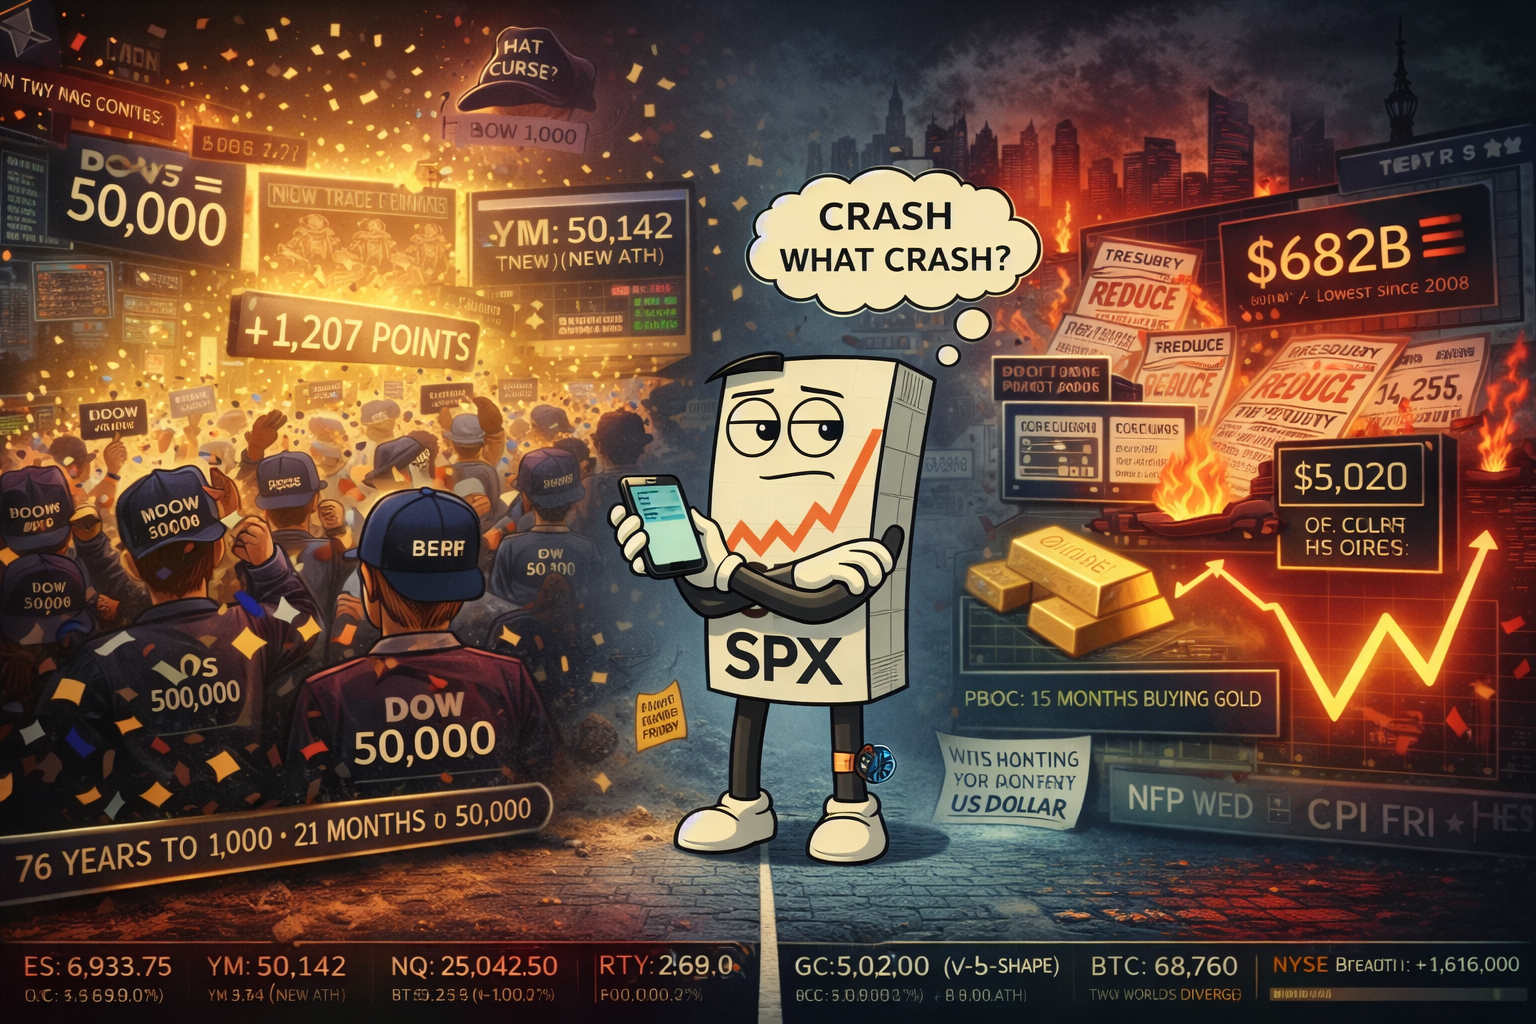
Crash What Crash – Friday’s 1,207 Point Dow Rip Cracks Historic 50K And Nobody Saw It Coming
 Ahoy there, Trader! ⚓️
It’s Phil…
Well, what a weekend to wake up to. On Friday the Dow cracked 50,000 for the first time in history with a face-ripping 1,207-point rally and I wasn’t even in the building. Crash what crash. Eye roll.
As it turns out I didn’t trade on Friday – and whoosh, we get the stonks move. That’s the game sometimes. You sit on your hands waiting for the pattern and the market delivers the move without you.
SPX broke back into the range we’ve been discussing with a straight-line move and no V-shape. Unlikely I would have taken a bull swing on Friday even if I was watching. RUT is very much the same and back at the upper range boundary.
This is where the discretionary override to use the larger range gets me kicked in the shins as I wait for that pattern to play out versus being mechanical 100% and taking the rough with the smooth. I think on balance, having the occasional override works out nicely and saves me more headaches than it creates. Personal preference and horses for courses.
And now this morning – Beijing drops a bombshell ordering banks to reduce US Treasury holdings. Gold’s giving a lovely V-pattern which suggests further moves higher. Bitcoin looks a little dead cat bounce-ish. And the Nasdaq? Also a bit dead cat bounce-ish if we’re being honest.
The only index that looks unfazed by Friday’s rally is the Dow with that new all-time high being cracked. With NFP being pushed to the second week of the month, I’m wondering if this could be a case of buy the rumour sell the news.
Onwards to a new day and a new week.
Keep scrolling – China just fired a financial shot across the bow…
Dow 50,000. China Dumps Treasuries. Gold V-Shapes. And Your Override Costs You A Shin Bruise.
Market Briefing:
Monday 9 Feb opens new week reviewing Friday’s historic Dow 50,000 milestone (first ever close above 50K, +1,207 points, +2.47%, 129-year-old index), didn’t trade Friday (whoosh we get the stonks move, crash what crash, eye roll),
China drops Monday bombshell ordering banks to reduce US Treasury holdings (Bloomberg confirms, $682B lowest since 2008, down from $1.32T peak, yields jumped 4bp to 4.25%, dollar dropped 0.2%, directive excludes state reserves),
SPX straight-lines back into range (no V-shape, unlikely would have taken bull swing, discretionary override gets kicked in shins, horses for courses), RUT back at upper range boundary (same story, pattern waiting), gold gives lovely V-pattern ($5,020, PBOC buying 15th consecutive month, suggests further moves higher),
Bitcoin dead cat bounce-ish ($68,760, worst week since FTX, $3.2B realised losses Thursday, Fear & Greed Index hit 5 lowest ever),
Nasdaq also dead cat bounce-ish (still -10.02% from NATHs),
NFP delayed to Wednesday (buy the rumour sell the news?),
CPI Friday, earnings week tests old-economy (Coca-Cola, Ford, McDonald’s, Cisco).
Current Multi-Market Status:
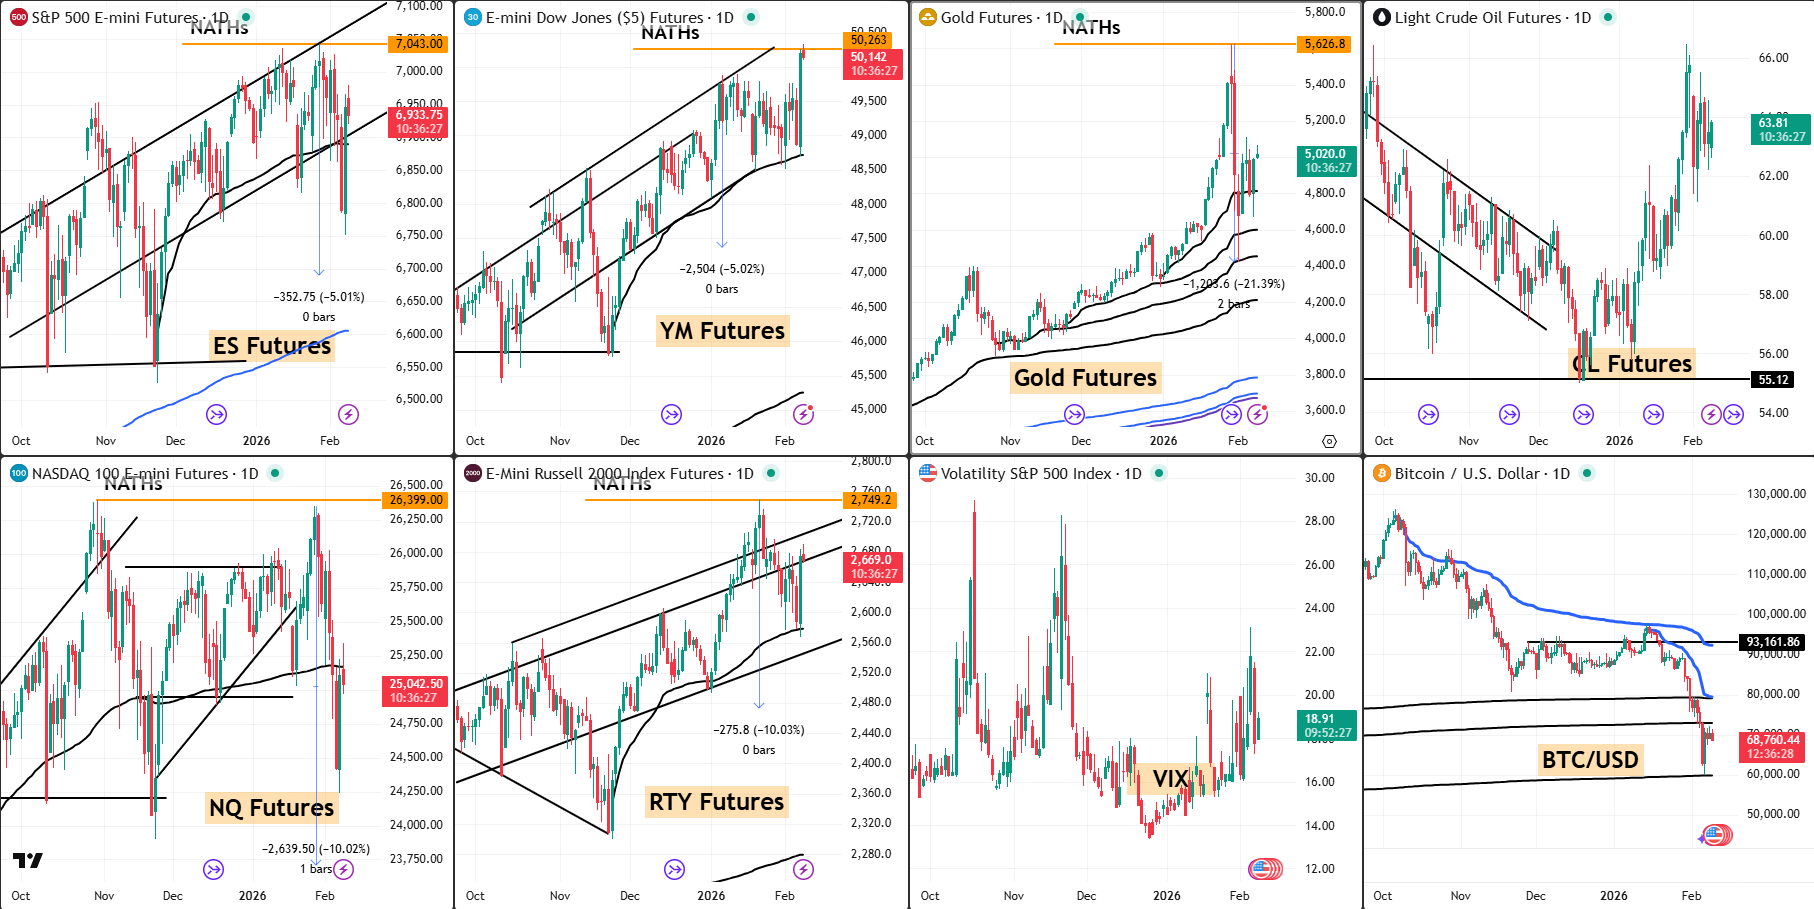
- ES: 6,933.75 (NATHs 7,043) – down 352.75 pts (-5.01%)
- YM: 50,142 (NATHs 50,263) – NEW ALL-TIME HIGH cracked!
- NQ: 25,042.50 (NATHs 26,399) – down 2,639.50 pts (-10.02%)
- RTY: 2,669.0 (NATHs 2,749.2) – down 275.8 pts (-10.03%)
- GC: 5,020.0 (NATHs 5,626.8) – V-shape recovery from lows
- CL: 63.81
- VIX: 18.91 – easing but elevated
- BTC/USD: 68,760 (was 93,161) – dead cat bounce territory
- NYSE Advance-Decline: +1,616,000 (strongly positive breadth Friday)
SPX Tag ‘n Turn – Straight-Line Back Into Range
AntiVestor Tag ‘n Turn Status:
| Status | |
|---|---|
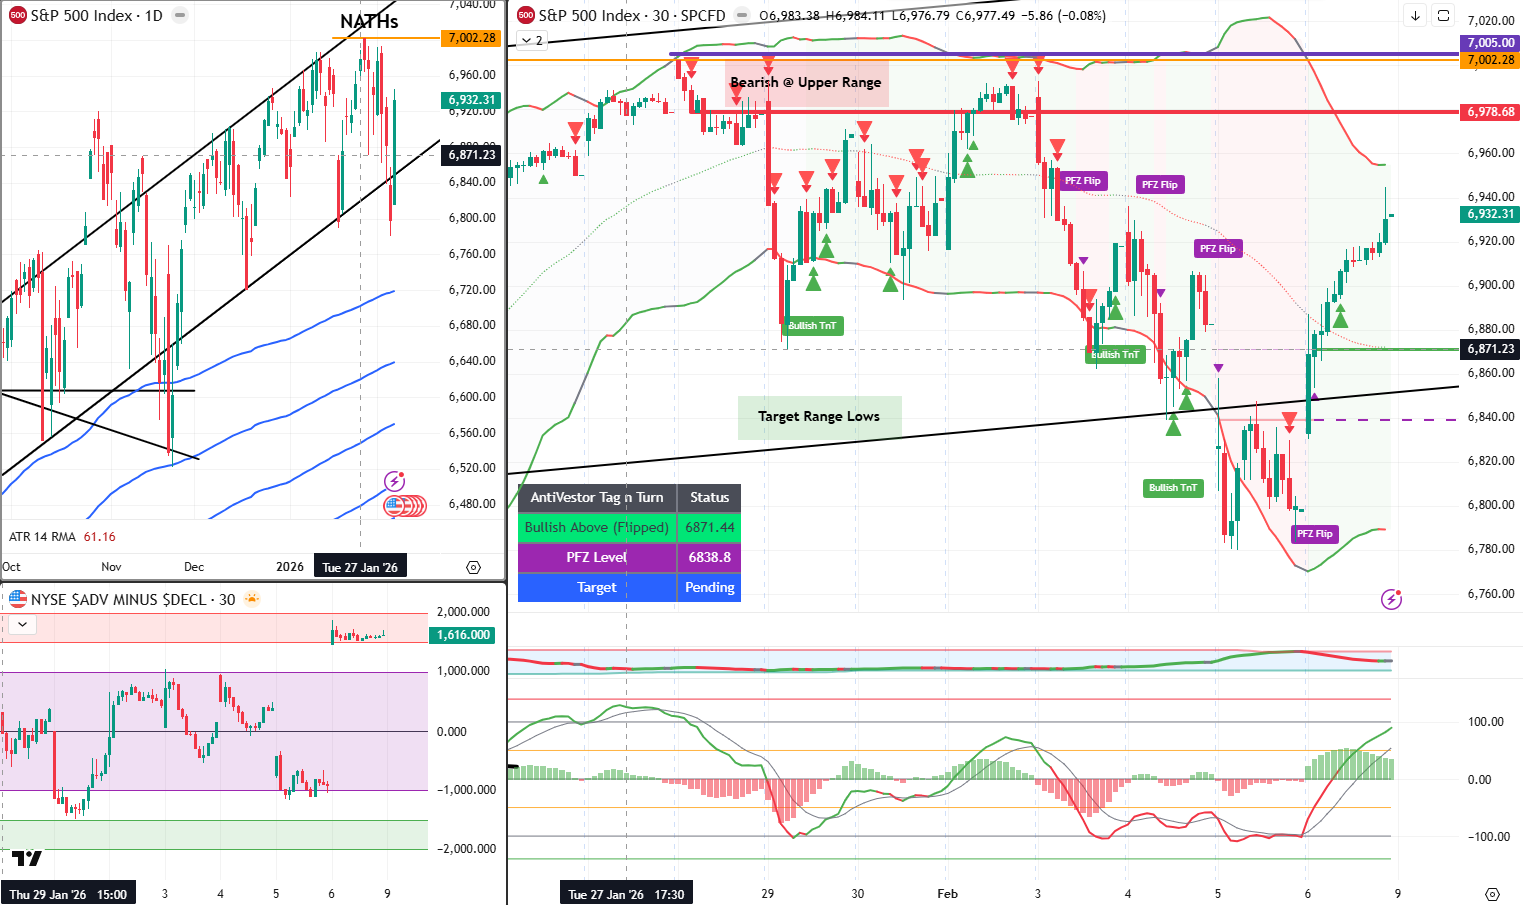
| Bullish Above (Flipped) | 6,871.44 |
| PFZ Level | 6,838.8 |
| Target | Pending |
SPX broke back into the range with a straight-line move on Friday. No V-shape at the lows. The 30-minute chart shows “Bearish @ Upper Range” still marked at the 6,978/7,005 zone and the “Target Range Lows” around 6,838-6,840 held beautifully before that rip higher.
Multiple PFZ Flips visible across the week tell the story of the flip-flop we’ve been navigating. The bullish flip happened and price pushed straight back up through 6,871 and into the 6,930s.
The discretionary override to use the larger range rather than mechanically flipping means I waited for a pattern that didn’t set up before the move happened. That’s the trade-off. On balance, the override saves more headaches than it creates – but when the market straight-lines without you, your shins know about it.
Price now sitting at 6,932 on the S&P cash close – right at the NATHs resistance zone. The question is whether this straight-line rally has legs or whether it’s the same range-bound behaviour that’s been defining these markets since October.
RUT Tag ‘n Turn – Back At Upper Range Boundary
AntiVestor Tag ‘n Turn Status:
| Status | |
|---|---|
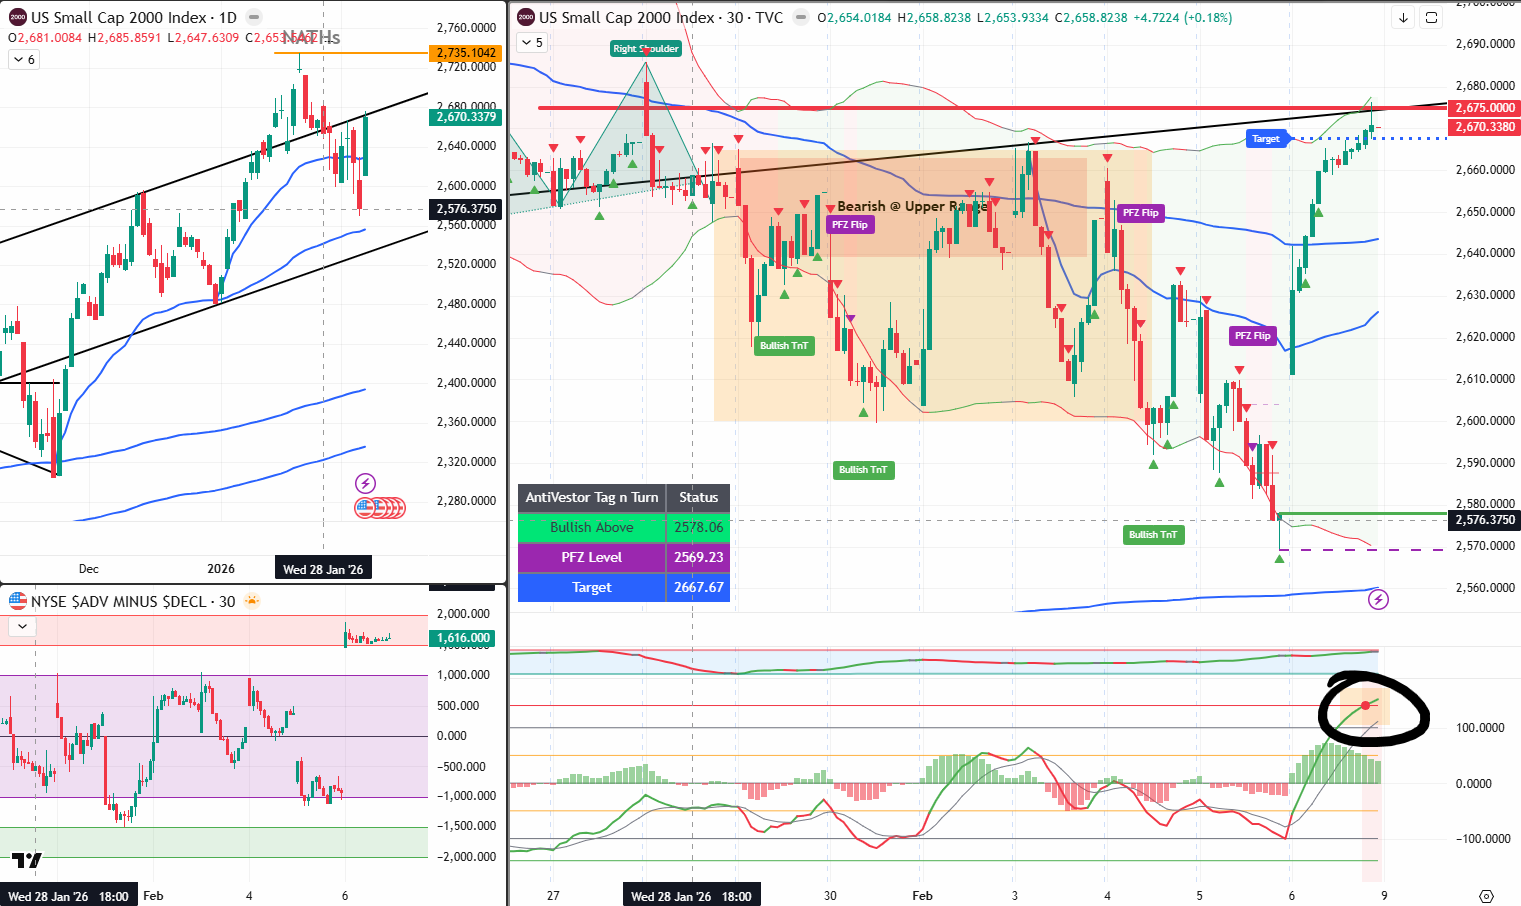
| Bullish Above | 2,578.06 |
| PFZ Level | 2,569.23 |
| Target | 2,667.67 |
RUT is very much the same story. Price ripped back to the upper range boundary at 2,669 and the right shoulder pattern on the 30-minute is visible with the target line up at 2,670.
The MACD-v is circled at the bottom of the chart showing a momentum extreme. Price has pushed up from the “Bearish @ Upper Range” zone through the PFZ Flip and is now pressing against resistance.
That head and shoulders we’ve been tracking continues to define the short-term battlefield. Make or break time again at the upper boundary.
This Week’s Economic Calendar
A loaded week after last week’s data vacuum:
| Day | Release | Forecast | Previous |
|---|---|---|---|
| Mon 9 Feb | Nothing | – | – |
| Tue 10 Feb | Core Retail Sales m/m | 0.4% | 0.5% |
| Tue 10 Feb | Retail Sales m/m | 0.4% | 0.6% |
| Wed 11 Feb | Avg Hourly Earnings m/m | 0.3% | 0.3% |
| Wed 11 Feb | Non-Farm Employment | 70K | 50K |
| Wed 11 Feb | Unemployment Rate | 4.4% | 4.4% |
| Thu 12 Feb | Unemployment Claims | 222K | 231K |
| Fri 13 Feb | Core CPI m/m | 0.3% | 0.2% |
| Fri 13 Feb | CPI m/m | 0.3% | 0.3% |
| Fri 13 Feb | CPI y/y | 2.5% | 2.7% |
NFP delayed from last week’s government shutdown now drops on Wednesday. CPI lands on Friday the 13th. Markets have been flying blind and now they get hit with everything at once. Buy the rumour, sell the news?
China’s Treasury Bombshell
Breaking this morning: Beijing ordered commercial banks to limit US Treasury purchases and pare existing holdings. Bloomberg confirmed the directive citing concerns over “concentration risks and market volatility.”
The numbers tell the story. China’s holdings now sit at $682 billion – the lowest since 2008 and down from a $1.32 trillion peak. Over 14 years they’ve reduced more than $500 billion in US debt whilst steadily increasing gold reserves. The PBOC has been buying gold for 15 consecutive months.
The directive excludes state reserves but the signal is unmistakable. Yields jumped 4 basis points to 4.25%. The dollar dropped 0.2%. The 30-year climbed to 4.87%.
This isn’t a sudden exit – it’s a gradual recalibration. But when the world’s third-largest foreign holder of Treasuries says “we’re reducing,” the bond market listens. India and Brazil have already been lowering exposure. The de-dollarisation drip continues.
The Two Worlds Divergence
Friday showed it perfectly and today confirms it. Two worlds are diverging:
World 1 – Old Economy + Hard Assets: Dow 50,000. Gold V-shape recovery. Equal-weight S&P hit all-time high. Industrials, materials, energy, staples all printed fresh records. Coca-Cola, Ford, McDonald’s reporting this week.
World 2 – Tech + Crypto: Nasdaq dead cat bounce-ish. Bitcoin clinging to $69K after worst week since FTX. Software stocks cratered. Ethereum below $2,000. Fear & Greed Index hit 5 – the lowest ever recorded.
The rotation from tech into value continues to accelerate. Q4 beat rate at 79% with 13.6% EPS growth across 291 companies. The market is rewarding boring, punishing exciting. Sound familiar?
AI-BotView
 Beep-Beep, Trader
It’s Cache-AI-Bot,
Three observations from the machine:
1. The Dow 50,000 milestone has a mixed historical track record. When the Dow first closed above 1,000 on 14 Nov 1972, it declined 13% over the following year. When it cracked 10,000 on 29 Mar 1999, the tech bubble burst 12 months later. But Dow 30,000 in Nov 2020 led to a 19% gain the following year. Round numbers aren’t inherently bearish or bullish – but they do tend to coincide with peak optimism, and peak optimism rarely lasts.
[Source: Motley Fool – “The Dow Hit 50,000. Here’s What History Says Happens Next” – fool.com, 9 Feb 2026]
2. China’s Treasury reduction is a drip, not a flood – but drips erode. Holdings down from $1.32T to $682B over 14 years. Belgium’s Treasury holdings have quadrupled since 2017 to $481B (widely believed to include Chinese custodial accounts). So the headline reduction may overstate the actual pullback. But the directive signals intent, and intent shapes expectations. Yields up, dollar down despite higher rates – unusual combination suggesting foreign selling pressure specifically.
[Source: Bloomberg – 9 Feb 2026]
3. Gold V-shape versus Bitcoin dead cat bounce tells you everything about current risk appetite. Gold reclaims $5,020 with PBOC buying for 15 consecutive months. Bitcoin at $68,760 after $3.2B in realised losses Thursday and Fear & Greed at 5 (lowest ever). When the traditional safe haven rallies and the “digital gold” narrative collapses, institutional money is telling you exactly where it wants to be. The rotation story isn’t just equities – it’s cross-asset.
Expert Insights:
When China reduces Treasury holdings and yields rise despite a weakening dollar, it’s an unusual signal worth understanding. Normally, higher yields attract dollar demand. When both move against each other – yields up, dollar down – it typically indicates foreign selling pressure rather than domestic repricing.
For context, China has been diversifying for over a decade. The headline number ($682B) understates their total exposure when Belgian custodial accounts are included. But the directive matters more than the amount – it tells other central banks that the world’s second-largest economy is actively reducing dollar dependency.
For systematic traders, this creates a wider volatility range across multiple asset classes. Wider ranges mean more premium to sell. The Poppers don’t care about geopolitics – they care about premium, and elevated VIX plus cross-asset volatility delivers exactly that. [Source: Bloomberg, Yahoo Finance reporting on China Treasury directive, 9 Feb 2026]
In Other News…
Dow Hits 50,000, Immediately Faces Existential Threat from Chinese Banks
Historic milestone lasts approximately twelve hours before Beijing rattles the bond market.
Wall Street celebrated Dow 50,000 Friday with a 2.47% surge, then spent the weekend discovering China has opinions about Treasury holdings. Beijing’s directive to banks sent yields climbing and the dollar falling simultaneously—a combination that typically means “foreign selling pressure” in polite terms and “someone’s exiting” in honest ones.
The Milestone Nobody Gets to Enjoy
Dow 50,000 arrived Friday. S&P +1.97%, Nasdaq +2.18%, VIX collapsed 18.4%. Equal-weight S&P hit all-time highs, meaning the average stock is thriving whilst mega-caps drag the headlines. By Monday premarket, futures slipped and the celebration became a memory. Historic achievements now come with 48-hour expiration dates.
The Treasury Tremor
China’s bank directive pushed 10-year yields up 4bp to 4.25%, 30-year to 4.87%—whilst the dollar fell. Rising yields with falling dollar screams foreign selling. When your largest creditor starts reorganising their Treasury exposure, probably worth noting. Gold crossing back above $5,000 suggests others already have.
The Quiet Revolution
Industrials, materials, energy, staples—all fresh records. Nasdaq lost 1.8% on the week despite Friday’s bounce. Software stocks remain in freefall after Alphabet and Amazon’s combined $385B capex shock. The rotation from “things that might work” to “things that definitely exist” accelerates.
 ☕ Hazel’s Take
Jobs report delayed until Wednesday because the government remains partially broken. 79% earnings beat rate suggests companies are fine—it’s just their stocks that aren’t. When milestones and threats arrive within the same news cycle, savour the highs quickly.
—Hazel, FinNuts

Rumour Has It…
Breaking from the Financial Nuts newsroom where Monday morning has arrived with a bang:
Percy burst through the doors waving a “DOW 50,000” baseball cap he’d apparently ordered online at 4am on Saturday. “It’s a collector’s item!” he announced to nobody in particular. His pigeons were already wearing matching tiny hats. Hazel pointed out they’d been available since Friday afternoon and he’d paid triple on eBay.
Hazel herself had spent the weekend building a “CHINA TREASURY REDUCTION RESPONSE PROTOCOL” which included 63 pages of contingency plans, a Mandarin phrasebook, and a detailed flowchart that ultimately concluded with “monitor and wait.” Mac called it “the most elaborate way to do nothing since the last government shutdown.”
Kash was found staring at two screens simultaneously. Left screen: Bitcoin at $69K. Right screen: Gold at $5,020. “So the digital gold is dead and the actual gold is alive?” he muttered. “Maybe I should have just bought actual gold.” Nobody had the heart to tell him the NFT collection wasn’t gold either.
Mac raised his Monday morning whisky (medicinal, naturally) and proposed a toast: “To the Dow at 50,000 – a number so large it makes my bar tab look responsible!”
Wallie was heard grumbling from behind his newspaper: “The Dow first hit 1,000 in 1972 and it took 50 years to reach 50,000. In my day, that kind of patience was called ‘investing.’ Now they call it ‘being late.'”
Meanwhile, the AI-Bot ran some quick calculations and announced: “When the Dow hit 1,000 it dropped 13% the following year. When it hit 10,000 the tech bubble burst. Perhaps we should be cautious about celebrations.” Percy’s pigeons immediately removed their hats.
This is entirely made-up satire. Probably!
Breaking scoops courtesy of the Financial Nuts Newswire-because who needs sanity?


Fun Fact:
Happy trading,
Phil
Less Brain, More Gain
…and may your trades be smoother than a cashmere codpiece
p.s. There are 3 ways I can help you…
- Option 1: The SPX Income System Book (Just $12)
A complete guide to the system.
Written to be clear, concise, and immediately actionable.
>> Get the Book Here

- Option 2: Full Course + Software Access – 50% off for Regular Readers – Save $998.50
Includes the video walkthroughs, tools for TradeStation & TradingView, and everything I use daily. Plus 7 additional strategies
>> Get DIY Training & Software
- Option 3: Join the Fast Forward Mentorship – 50% off for Regular Readers – Save $3,000
>> Join the Fast Forward Mentorship – trade live, twice a week, with me and the crew. PLUS Monthly on-demand 1-2-1’s
No fluff. Just profits, pulse bars, and patterns that actually work.