The Only Entry Signal You Need
 Ahoy there, Trader! ⚓️
It’s Phil…
You’re overcomplicating entries.
Right now, thousands of traders are staring at charts covered in indicators, drawing lines that only make sense to them, waiting for a “feeling” that tells them when to pull the trigger. Most of them will lose money today.
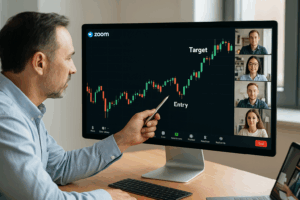
But here’s what nobody tells you about entries: there’s one signal, one candle, one mechanical measurement that tells you exactly when to trade. And it fires in the first two hours of every trading day.
No interpretation required. No subjective judgment. Just a binary yes or no.
This is the 5% rule.
Why Most Entry Strategies Fail
Traditional approaches rely on subjectivity. Support and resistance? Ten traders will draw ten different lines. Pattern recognition? That’s just confirmation bias wearing a fancy name. Gut feel? That’s gambling.
The problem isn’t that traders are stupid. The problem is they’re using tools that can’t be measured, can’t be repeated, and can’t be backtested.
And the data proves it. Over 80% of retail traders lose money. Brokers in the UK and Europe are legally required to publish this statistic. It’s not a scare tactic – it’s documented reality.
But here’s what’s interesting: the traders who win consistently aren’t using more indicators. They’re using fewer. They’re not making more decisions. They’re making one decision, mechanically, at the same time every day.
The First Two Hours Matter Most
The first two hours of the trading day – from 9:30 to 11:30 Eastern – account for roughly 35% of daily volume. This is when institutions execute their major orders. This is when the day’s directional bias gets established. And this is when one specific candle formation tells you everything you need to know.
After 11:30? The signal quality degrades. Noise increases. You’re better off walking away.
Which means if you know what to look for, you can be done trading before lunch.
The 5% Rule: What Is a Pulse Bar?
The signal I’m about to show you isn’t based on patterns or feelings. It’s based on a simple mathematical threshold that measures conviction.
A pulse bar is a 30-minute candle that closes in the top or bottom 5% of its range.
That’s it. No interpretation. No artistic license. Just math.
Here’s why this matters: when a candle closes in the extreme of its range, it’s telling you something specific. Buyers or sellers showed up with conviction. They pushed price, and they held it there through the close.
Bullish pulse bar: Closes in the top 5% of its range. Price opened, moved around, and then buyers drove it to the highs and kept it there. That’s conviction.
Bearish pulse bar: Closes in the bottom 5% of its range. Sellers took control and didn’t let go.
This isn’t about predicting where price will go. It’s about measuring who showed up with force.
How to Identify Pulse Bars Manually
You don’t need expensive software to find pulse bars. Here’s the manual method:
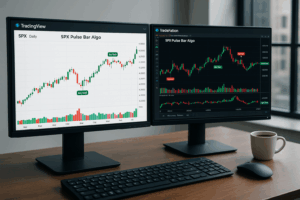
Step 1: Set up a 30-minute chart. I use TradingView, but any platform works.
Step 2: Customize a Fibonacci retracement tool. Set your levels to 0%, 5%, 95%, and 100%. You only need to do this once.
Step 3: When a 30-minute candle closes in the first two hours of the trading day, apply the fib tool from the low to the high of that candle. The tool will show you the 5% zones at the top and bottom.
Reading the signal:
- If the close is inside the top 5% zone → bullish pulse bar
- If the close is inside the bottom 5% zone → bearish pulse bar
- If it’s anywhere in between → no signal, no trade, wait for the next candle
This is the power of objective criteria. There’s no debate. There’s no “well, it looks kind of bullish.” Either the close is in the 5% zone or it isn’t.
Why Only the First Two Hours?
After the opening session, institutional order flow slows down. The conviction signals become less reliable. Noise increases. False signals creep in.
That’s why we only look for pulse bars in the first four 30-minute candles of the day: 9:30, 10:00, 10:30, and 11:00. If nothing fires by 11:30, you’re done for the day.
And honestly? That’s the best part.
The Complete Process
Step 1: Check the first 30-minute candle at 10:00am Eastern. Apply your custom fib tool. Did it close in the top or bottom 5%? If yes, you have a pulse bar. If no, wait for the next candle.
Step 2: If you get a pulse bar, you know your direction. Bullish pulse bar means put credit spread. Bearish pulse bar means call credit spread. Set up the trade using an at-the-money structure.
Step 3: Walk away. The trade is placed. Time decay is working in your favour. You don’t need to watch the charts. Come back at the end of the day, or let it expire.
That’s the entire system for this setup.
Software vs. Manual: You Don’t Need Automation
I use software that identifies pulse bars automatically. It also applies additional filters – things like average true range, time of day, and directional bias from the higher timeframe swing. And it calculates what I call “dynamic pulse bars” which adapt the 5% threshold based on current volatility.
But here’s the thing: you don’t need the software to trade this. The manual method works perfectly well. The software just makes it faster and adds some filtering on top.
The Results Speak for Themselves
In 2025, my community closed with a 95.3% win rate – 61 winners out of 64 trades. On the RUT Premium Poppers, we hit 97.4% – 37 out of 38 in a 30-day window.
Real results from real traders:
- Jared grew his account by 37.4% since starting
- Allan posted 8 wins and 2 losses in his first 10 days, up 19.5%
These aren’t cherry-picked unicorn results. These are real traders posting real trades in my Slack community every single day.
And the common thread? They stopped overcomplicating.
They went from stacking 27 indicators and drawing subjective lines to waiting for one signal, in the first two hours, and walking away.
The Transformation
That’s the shift: from chart zombie to systematic trader. From all-day screen time to 15 minutes and done. From hoping to following a process.
The pulse bar doesn’t care about your opinions. It doesn’t care about the news. It doesn’t care what you think should happen. It just measures conviction.
And when you combine that measurement with a credit spread that pays you to wait, you’ve got an edge that compounds. Not overnight. Not with one trade. But trade after trade, week after week, with mechanical consistency.
The pulse bar tells you when. The credit spread handles the rest. And time decay does the heavy lifting while you live your life.
VIDEO
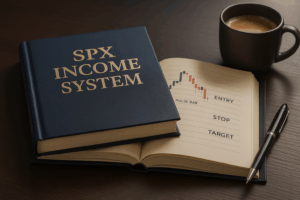
What’s Next?
The pulse bar is one core setup from the SPX Income System. There are six more money-making patterns that build on this foundation – but they all start the same way: with a mechanical signal that removes subjectivity from the equation.
Next up: What happens when a trade doesn’t go your way? Because here’s the thing with credit spreads – a losing trade isn’t always the end of the story.
Want to Go Deeper?
I post my pre-market analysis and trade debriefs on this blog every single day. You can see this system in action, live.
Drop a comment below with your questions. Or check out the SPX Income System to learn all seven setups.
Sources
- Broker loss statistics: FCA and ESMA regulatory disclosures (legally mandated)
- Volume distribution data: NYSE market data, institutional trading studies
- Win rate data: Antivestor community Slack, verified broker statements (2025)
- Student results: Posted with permission from community members
Related Reading
Happy trading,
Phil
Less Brain, More Gain
…and may your trades be smoother than a cashmere codpiece
p.s. There are 3 ways I can help you…
- Option 1: The SPX Income System Book (Just $12)
A complete guide to the system.
Written to be clear, concise, and immediately actionable.
>> Get the Book Here
- Option 2: Full Course + Software Access – 50% off for Regular Readers – Save $998.50
Includes the video walkthroughs, tools for TradeStation & TradingView, and everything I use daily. Plus 7 additional strategies
>> Get DIY Training & Software
- Option 3: Join the Fast Forward Mentorship – 50% off for Regular Readers – Save $3,000
>> Join the Fast Forward Mentorship – trade live, twice a week, with me and the crew. PLUS Monthly on-demand 1-2-1’s
No fluff. Just profits, pulse bars, and patterns that actually work.