Nasdaq Throws Hissy Fit. Attempts Breakout. Bitcoin Still Asleep.
 Ahoy there, Trader! ⚓️
It’s Phil…
What a bloody ride.
Gold up then down. Indexes gap lower then climb all night. Then climb all day. Except Uncle Russell, who looked at all that bullish enthusiasm and said “nah, I’m good down here.”
Meanwhile Nasdaq’s throwing a hissy fit because it’s been missing all the moves. Now it’s attempting another breakout whilst every bro’s favourite store of wealth – Bitcoin – remains fast asleep on the sofa.
The indexes aren’t just divergent anymore. They’re schizophrenic. Up one day, down the next, each doing their own thing with zero regard for what the others are doing.
The old normal was correlation. The new normal is chaos.
But here’s the thing that matters: the bigger picture consolidations are still holding. Nothing new is developing. And until something actually breaks, the same thing is likely to keep happening.
Which means more of this. Joy.
Scroll down for the systematic breakdown – including why flat is still the smartest position on the board…
Market Briefing:
Multi-Market Status
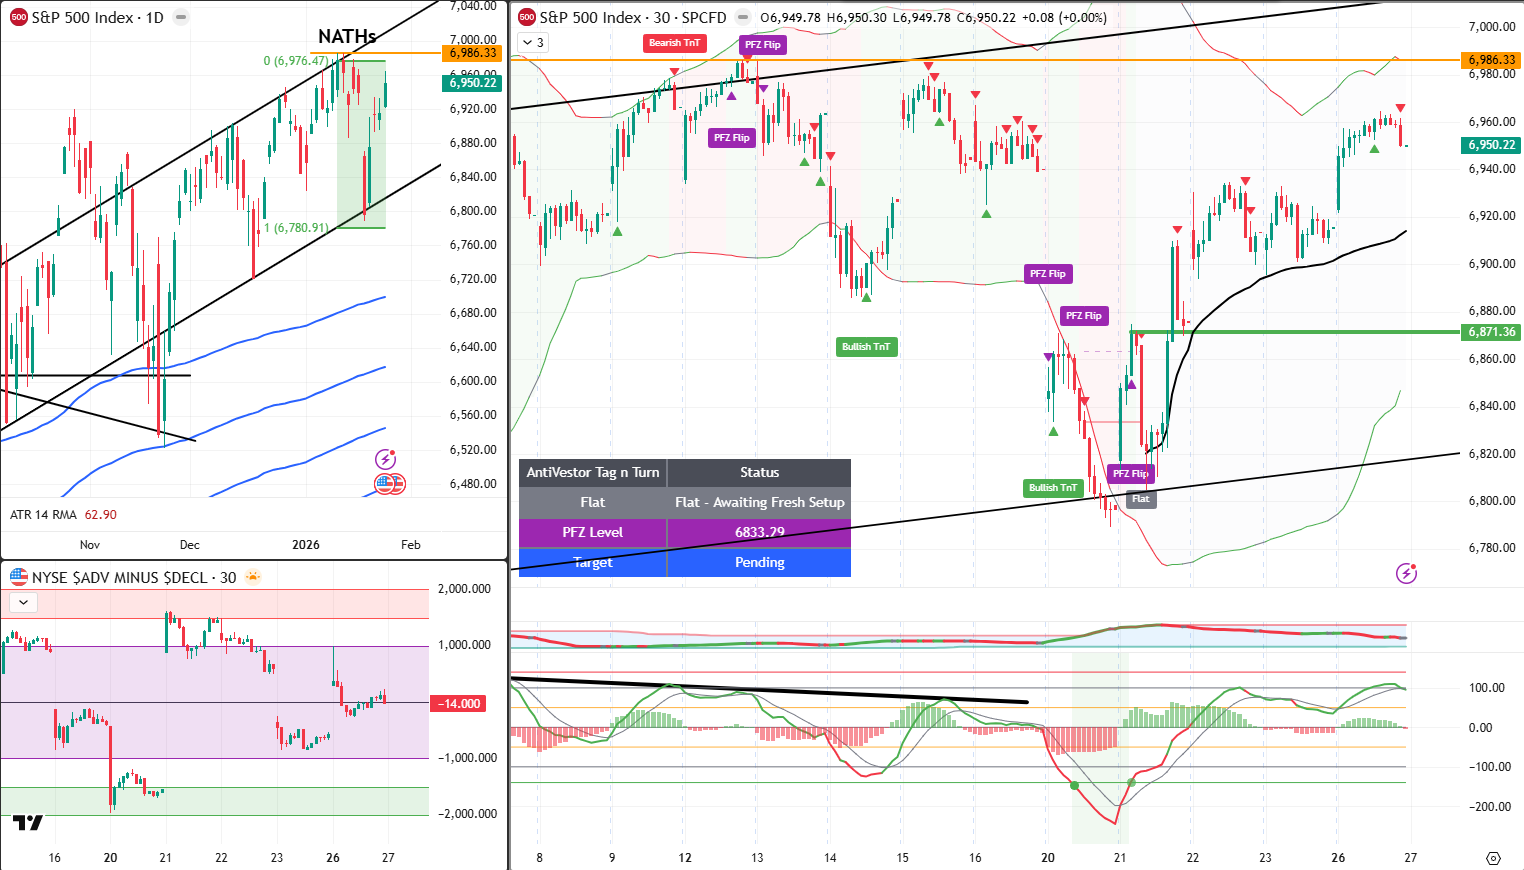
SPX: Flat – Awaiting Fresh Setup. PFZ Level 6833.79. Target pending. Price holding the rising VWAP for those still discretionary bullish. Once again approaching new all-time high territory. The system says wait. The price action says “maybe.” We wait.
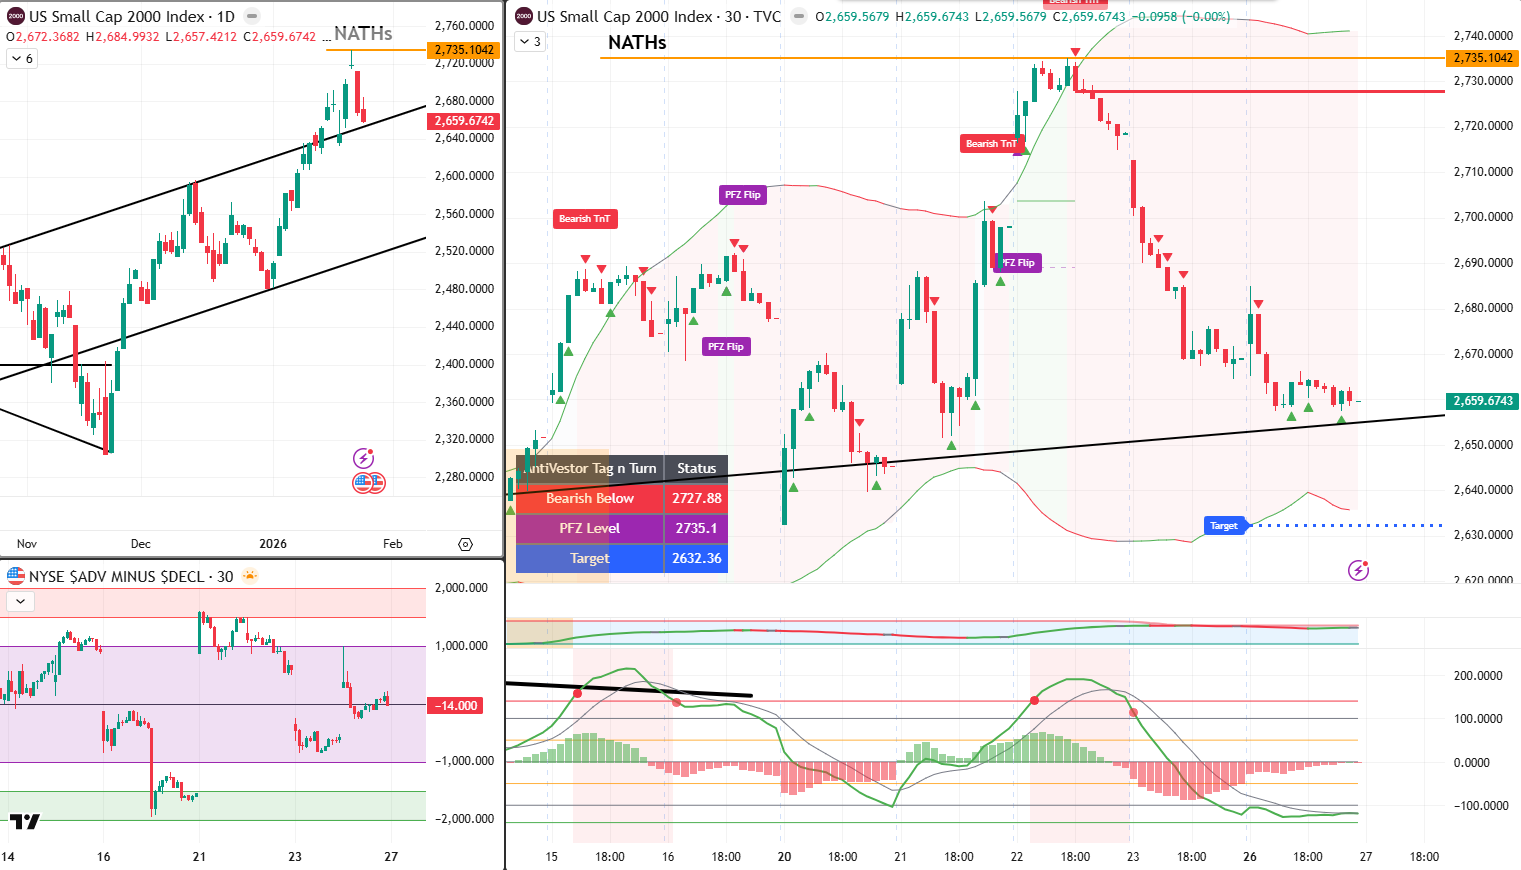
RUT: Bearish Below 2727.88. PFZ Level 2735.1. Target 2632.36. Bear mode firmly activated but momentum has exhausted for the moment. Price resting on the outside of the upper rising channel we noted last week. Make or break time. Again.
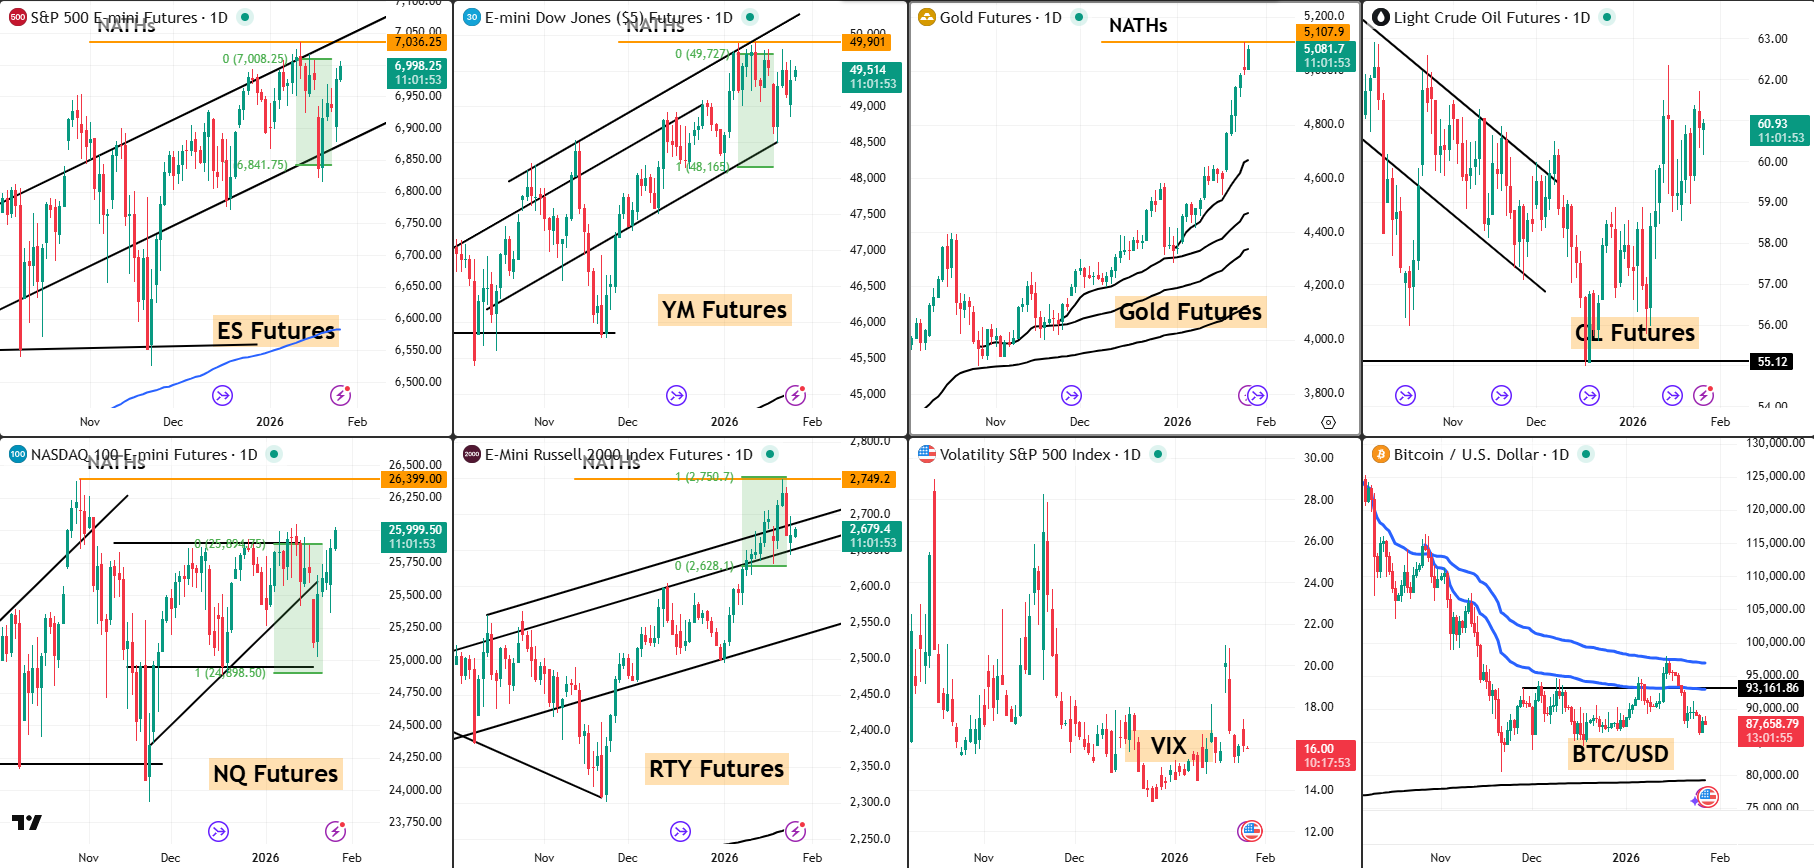
ES Futures: 6,998.25 – back above the gap, testing highs. Climbed all night, climbed all day.
NQ Futures: 25,999.50 – the hissy fit index. Attempting another breakout because it’s been left out of too many moves. Whether this one sticks is another question entirely.
YM Futures: 49,514 – following along, nothing special to report.
RTY Futures: 2,679.4 – the holdout. Pushed back lower whilst everyone else rallied. Held cash session lows. Classic Russell stubbornness.
Gold: Up then down. Not back up overnight. Taking a breather after the $5,000 excitement.
VIX: 16.00 – steady, unbothered, watching the chaos unfold.
Bitcoin: $87,658 – still asleep. Bros waiting. And waiting. And waiting.
The Schizophrenic Market Condition
Let’s be honest about what’s happening here:
Monday: Gap lower. Rally all day. Last Week: Rally. Then reverse. Then rally. Then reverse. The Week Before: Same thing.
Each index is doing its own thing. SPX rallies whilst RUT drops. Nasdaq attempts breakouts whilst Dow consolidates. There’s no leadership, no clear direction, no correlation.
This is the new normal. At least until something breaks the bigger picture ranges.
What’s holding:
- SPX still within its rising channel
- RUT still within its larger consolidation (now testing the upper channel from outside)
- NQ still within its range despite the breakout attempts
- Gold still elevated but consolidating after $5,000
What would change things:
- SPX breaking above NATHs with conviction
- RUT breaking below 2632 target zone
- NQ actually following through on a breakout
- Any of the bigger consolidation structures failing
Until then? Same thing. Different day.
The RUT Make or Break Zone
Uncle Russell deserves special attention today.
Whilst everyone else was rallying, RUT pushed back lower and held the cash session lows. The bear momentum that drove last week’s decline has exhausted for now, but price is resting right on the outside of that upper rising channel.
Two scenarios from here:
Scenario A – Break Back In: Price pushes back above the channel, negates the bearish structure, heads back towards ATHs. Bear TnT gets invalidated.
Scenario B – Reject and Continue: Price uses the channel as resistance, bounces lower, continues towards the 2632 target. Bear TnT plays out.
We don’t predict. We wait and see which scenario develops. The system already has us positioned bearish below 2727.88. The market will tell us if that’s right or wrong.
Premium Popper Update
Whilst the indexes played their schizophrenic games, the Poppers kept doing their job:
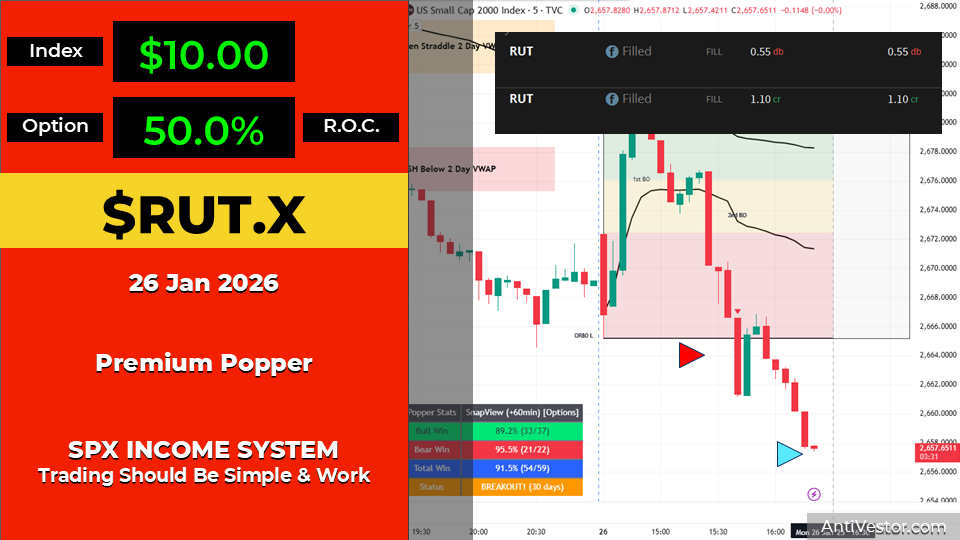
RUT Premium Popper #1: 50% ROC on a $10 index move. Classic first breakout setup.
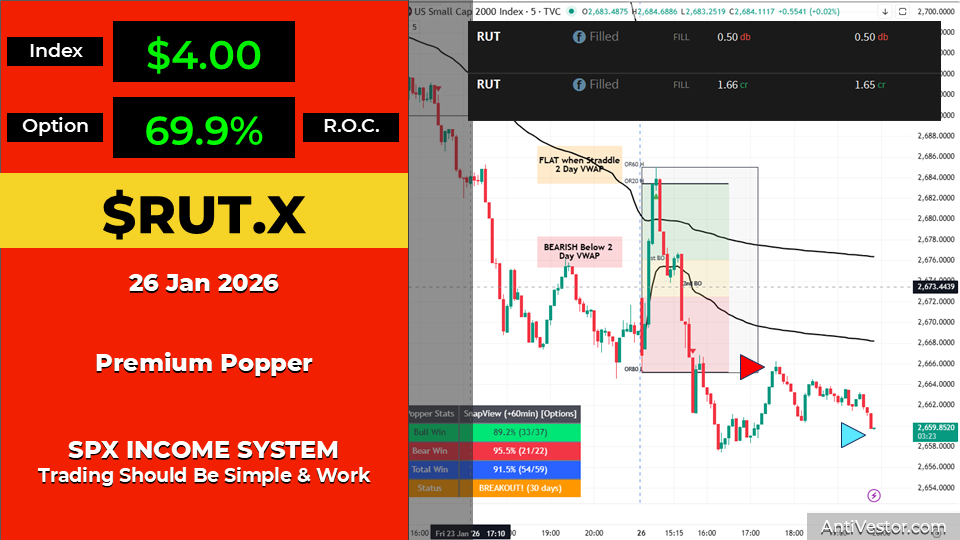
RUT Premium Popper #2: 69.9% ROC on a $4 index move. Bearish below 2-day VWAP entry.
Other community members pulled both RUT and SPX scalps throughout the session.
Popper Stats (30-day rolling):
- Bull Win: 89.2% (33/37)
- Bear Win: 95.5% (21/22)
- Total Win: 91.5% (54/59)
When the indexes can’t make up their minds, systematic scalping keeps traders sane. Profits don’t care about market direction.
Pop Pop.
The Week Ahead (Economic Calendar)
Wednesday 28 Jan:
- 2:00pm – Federal Funds Rate (Forecast: 3.75%, Previous: 3.75%)
- FOMC Statement
- 2:30pm – FOMC Press Conference
- Tesla, Microsoft earnings
Thursday 29 Jan:
- 8:30am – Unemployment Claims (Forecast: 206K, Previous: 200K)
- Meta, Apple earnings
Friday 30 Jan:
- 8:30am – Core PPI m/m (Forecast: 0.2%, Previous: 0.0%)
- 8:30am – PPI m/m (Forecast: 0.2%, Previous: 0.2%)
Fed expected to hold. But it’s the language that matters. Any shift in tone with this market volatility could create fireworks.
Expert Insights
The Divergence Dilemma
When major indexes stop moving together, it typically signals one of two things: either a rotation is underway between sectors/styles, or the market is searching for direction without conviction.
The current divergence – RUT weakness whilst SPX/NQ attempt new highs – suggests large caps are being supported whilst small caps face selling pressure. This often precedes broader market weakness, as small caps tend to lead both rallies and declines.
However, divergence can persist for weeks before resolving. The key isn’t predicting which way it resolves, but ensuring your systematic approach works regardless of direction.
That’s why scalping strategies like Premium Poppers thrive in these conditions – they profit from volatility itself rather than requiring directional conviction.
[Source: Market structure observation – index correlation analysis]
In Other News…
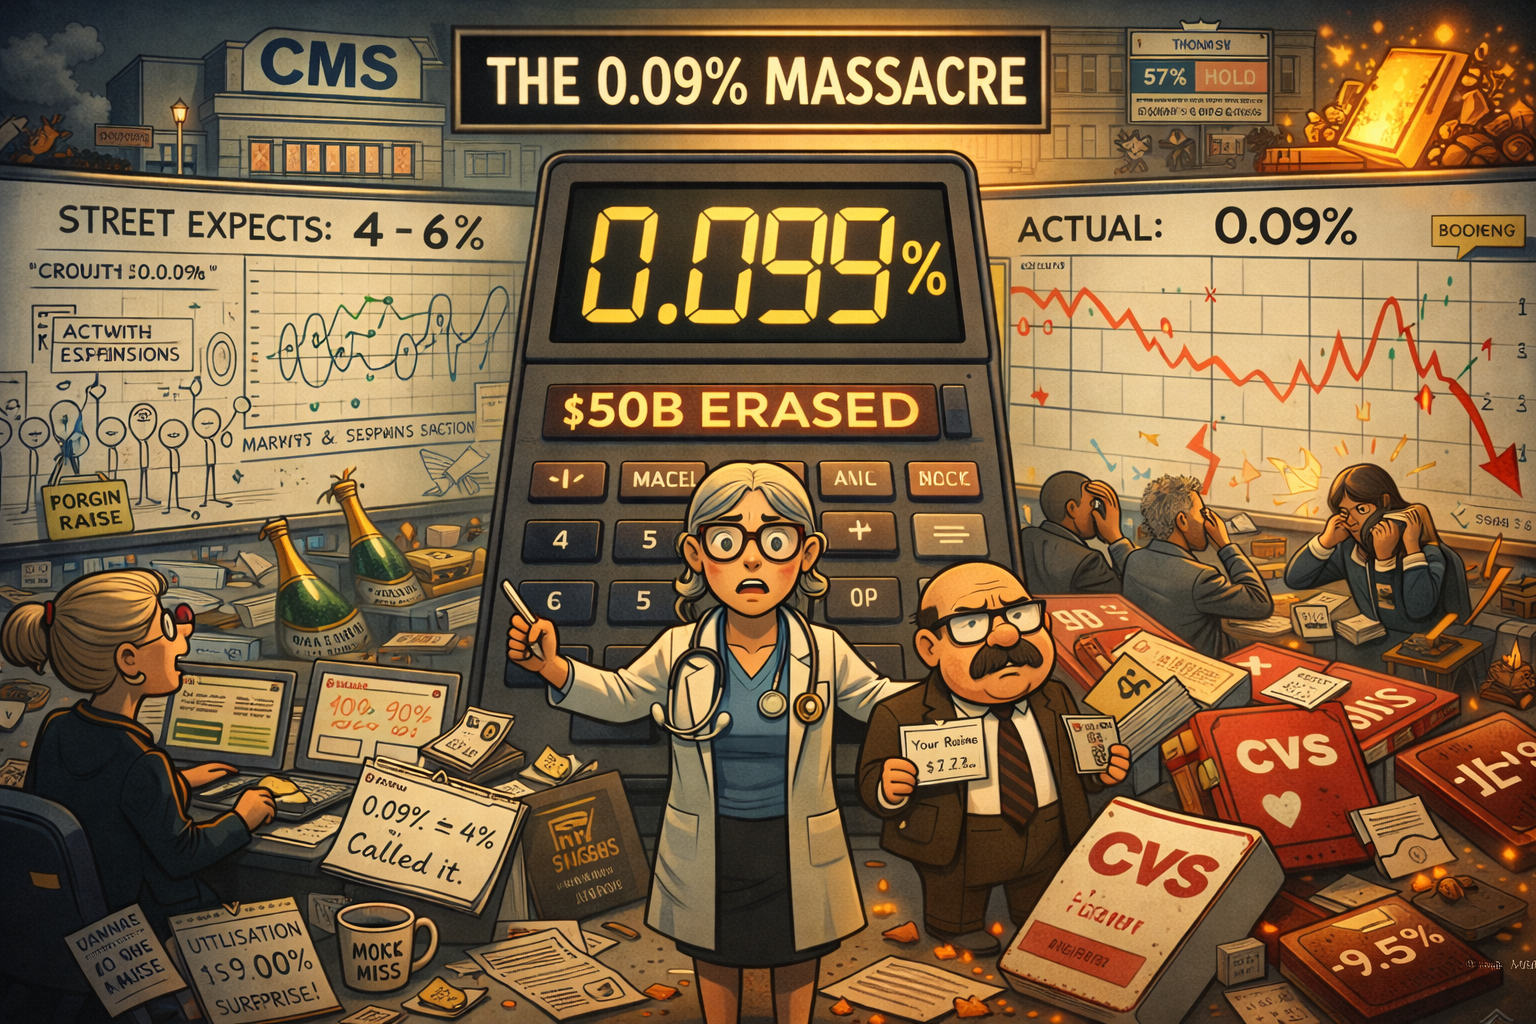
Healthcare Insurers Lose $50B After Government Offers 0.09% Instead of 4-6%
CMS delivers pay rise equivalent to finding 9p in the sofa cushions.
Wall Street discovered Tuesday that government maths and Street expectations inhabit entirely different realities. CMS proposed a 0.09% Medicare Advantage payment increase for 2027—the market expected 4-6%. The resulting healthcare massacre erased $50 billion before breakfast whilst gold quietly crossed $5,102.
The 0.09% Catastrophe
UnitedHealth crashed 8.5%, Humana plunged 12%, CVS dropped 9.5%—all because someone in Washington decided “near-zero” counted as a pay increase. Street analysts expecting 4-6% growth now face the awkward task of explaining how they missed by roughly 5,900%. Rising utilisation and coding restrictions apparently weren’t priced in.
Gold’s Quiet Victory Lap
Record $5,102 whilst everything burns. When precious metals rally during Fed meetings, tariff escalations, and 70%+ shutdown odds, the message isn’t subtle. Small caps outperforming the S&P by 7 percentage points suggests investors prefer companies too small for Washington to notice.
✈️ The Earnings Confessional
Boeing reports expecting -$0.37 EPS because nothing says “recovery” like negative earnings. GM and American Airlines join the confessional today. Three-quarters of companies beating estimates so far, though “beating lowered expectations” remains the participation trophy of corporate achievement.
☕ Hazel’s Take
When the government’s idea of support is 0.09% and gold’s response is record highs, probably worth noting who’s reading the room correctly. Fed decides Wednesday; shutdown odds above 70%. At least someone’s buying something—it’s just all shiny and doesn’t require congressional approval.
—Hazel, FinNuts
Rumour Has It…
The Financial Nuts Newsroom is dealing with its own divergence issues…
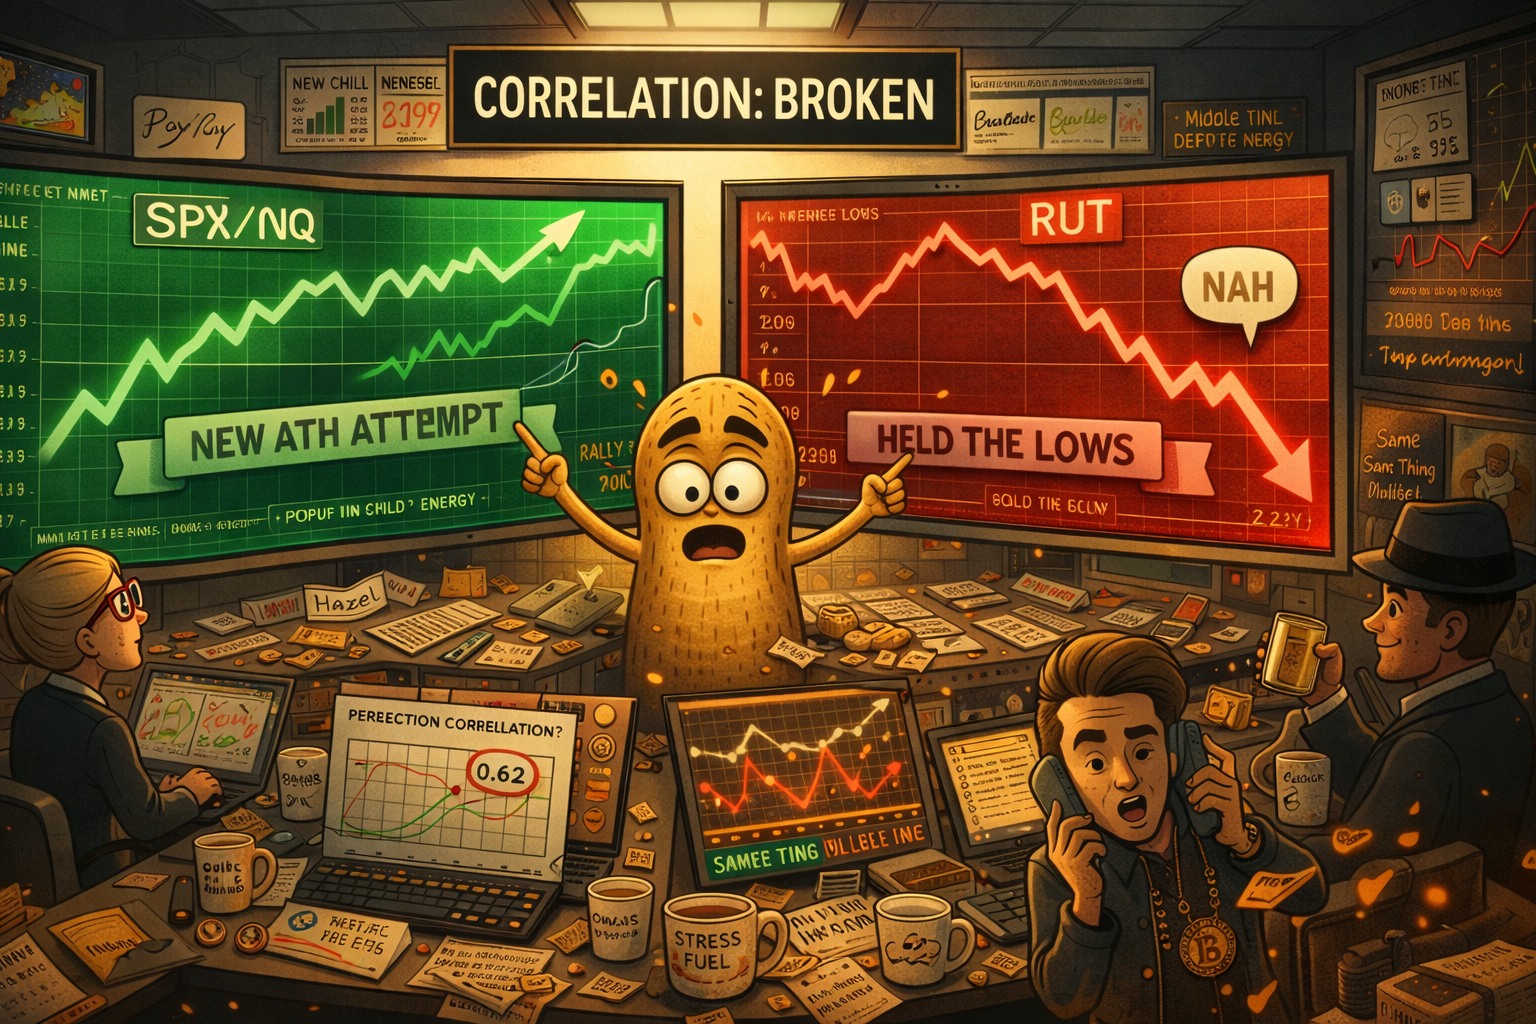
Percy is standing between two monitors, one showing SPX at new highs, the other showing RUT in the dumps. “They’re supposed to move together! That’s literally the whole point of correlation!”
Hazel doesn’t look up from her spreadsheet. “Correlation broke down three weeks ago. Keep up.”
Mac is nursing something amber. “Nasdaq’s throwing a tantrum because it missed every move for a month. Now it wants to break out whilst Bitcoin sleeps. Classic middle child energy.”
Kash has phones on both ears. “The Poppers don’t care about correlation. Two wins. 50% and 70%. That’s all I need to know.” He pauses. “Also, why is everyone calling about health insurers? What did I miss?”
Wallie is drawing channels on his RUT chart. “Make or break zone. Again. Always with the make or break zones. Can’t we just have a nice clean trend for once?”
The team exchanges glances. They know the answer is no.
This is entirely made-up satire. Probably!
Breaking scoops courtesy of the Financial Nuts Newswire-because who needs sanity?
Fun Fact:
The average correlation between S&P 500, Nasdaq, and Russell 2000 over the past decade has been approximately 0.85. During the current January period, that correlation has dropped to approximately 0.62 – a significant divergence from historical norms.
Extended periods of low inter-index correlation typically resolve in one of two ways: either all indexes converge on a new direction (often the direction the “leader” was heading), or the divergence signals broader market stress that eventually triggers correlated selling.
The last time we saw similar divergence levels was late 2018, just before the December selloff brought everything back into (downward) correlation.
[Source: Index correlation analysis – historical market data]
Happy trading,
Phil
Less Brain, More Gain
…and may your trades be smoother than a cashmere codpiece
p.s. There are 3 ways I can help you…
- Option 1: The SPX Income System Book (Just $12)
A complete guide to the system.
Written to be clear, concise, and immediately actionable.
>> Get the Book Here
- Option 2: Full Course + Software Access – 50% off for Regular Readers – Save $998.50
Includes the video walkthroughs, tools for TradeStation & TradingView, and everything I use daily. Plus 7 additional strategies
>> Get DIY Training & Software

- Option 3: Join the Fast Forward Mentorship – 50% off for Regular Readers – Save $3,000
>> Join the Fast Forward Mentorship – trade live, twice a week, with me and the crew. PLUS Monthly on-demand 1-2-1’s
No fluff. Just profits, pulse bars, and patterns that actually work.