Another Go/No-Go Session as Market Tests Both Bias Triggers
 Ahoy there, Trader! ⚓️
It’s Phil…
Déjà vu? Not quite – but today’s session feels a lot like yesterday’s.
We’ve got a fresh mechanical bear trigger from a late-day Tag ‘n Turn setup. But much like the previous session, price action is telling us a different story.
Let’s walk through what I’m looking for.
⬇️⬇️⬇️ – keep scrolling for more in-depth analysis – ⬇️⬇️⬇️
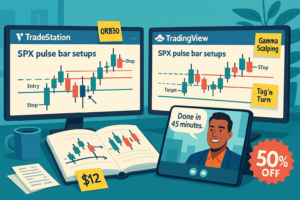
One Chart. One Setup. Daily SPX Income Locked In.
No indicators. No guesswork. Just pulse bar profits on repeat.
SPX Market Briefing
Yesterday’s session started with a bearish bias. But by the end of the day, the market voided the setup via the hedge trigger – and since I wasn’t positioned bearish, it was a clear signal to flip bullish.
Same playbook again today.
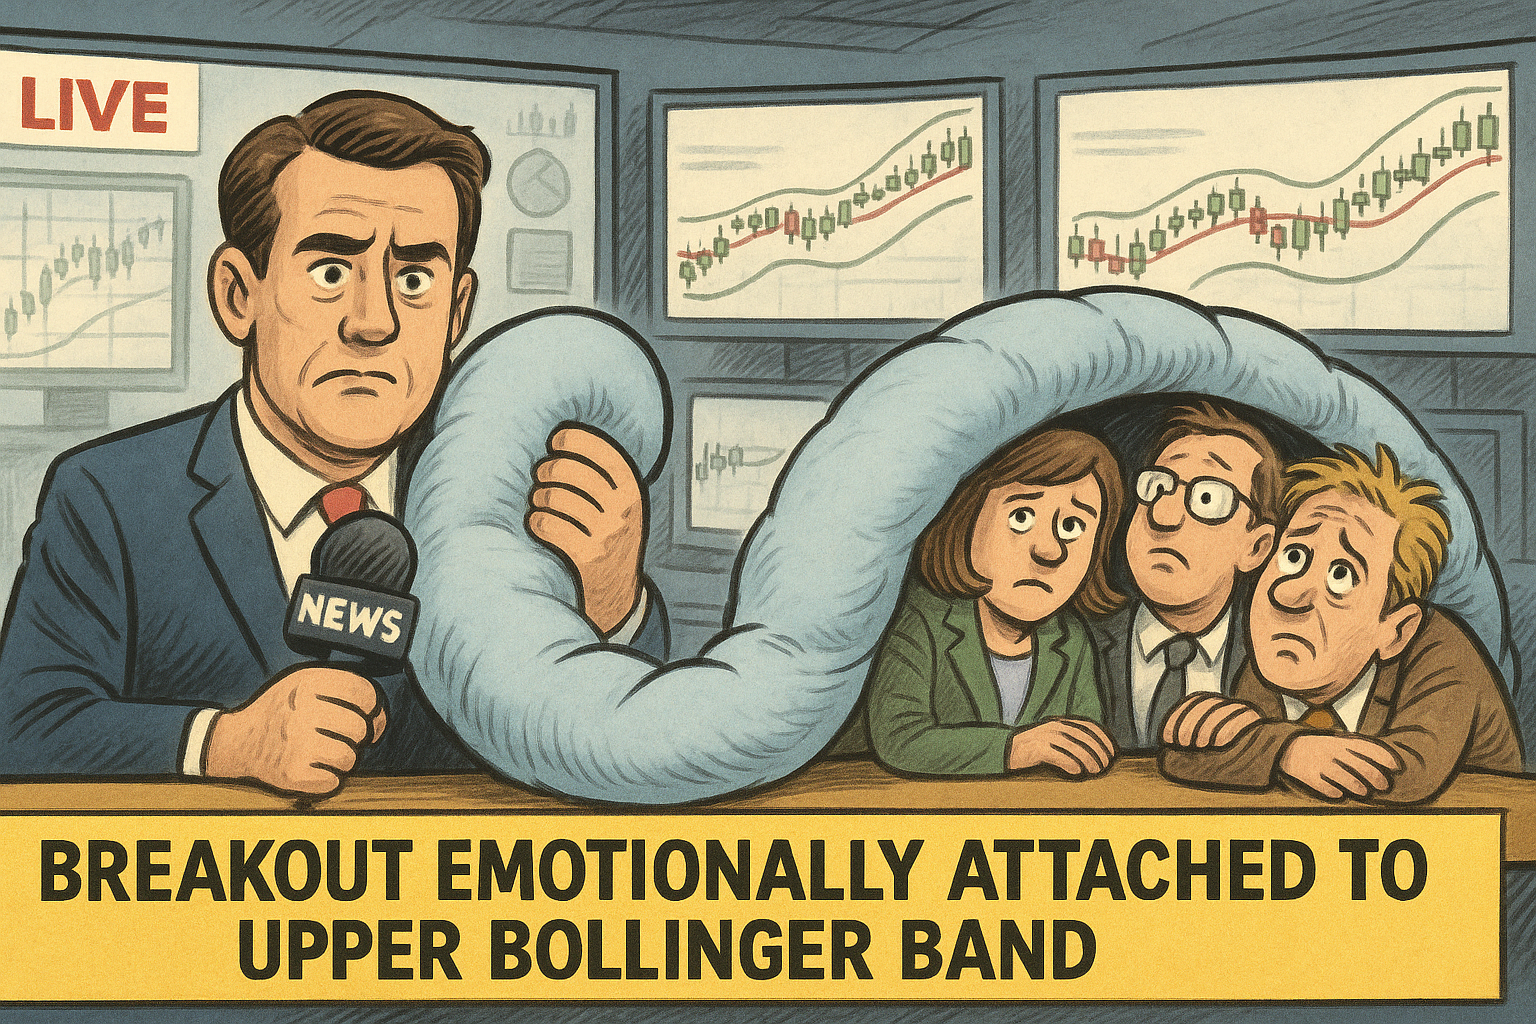
I entered yesterday bullish and didn’t babysit the charts. Today, I’m starting with a bearish mechanical trigger, but futures are holding up. There’s also a post-breakout continuation in play that’s clinging to the upper Bollinger Band – a strong sign of bullish trending momentum.
Bollinger himself suggested this as one of the most reliable signs of strength.
So what’s the move?
-
Bearish trigger? Yes.
-
Bear entry? Not yet.
-
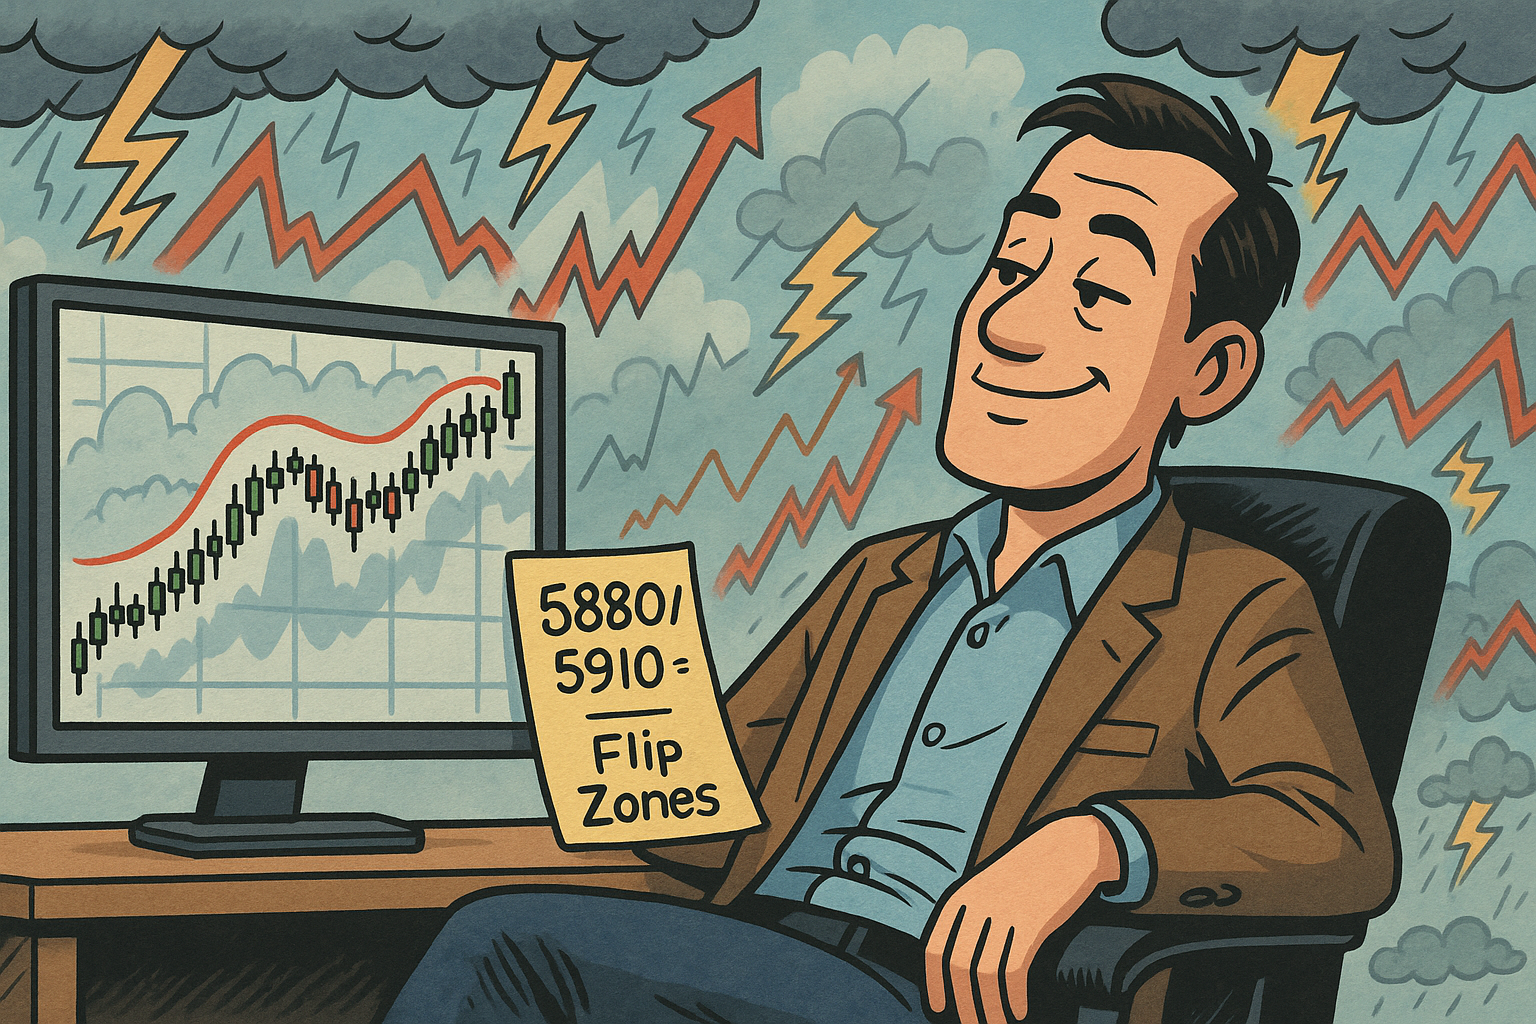
I’ll defer bearish entries unless price breaks below the 5880 area, with a v-shaped entry.
-
If price stays above 5910, I’ll resume bullish activity as needed.
This is shaping up to be another go/no-go decision day – no need to guess, no need to jump early.
Let price make the choice. I’ll respond when it does.

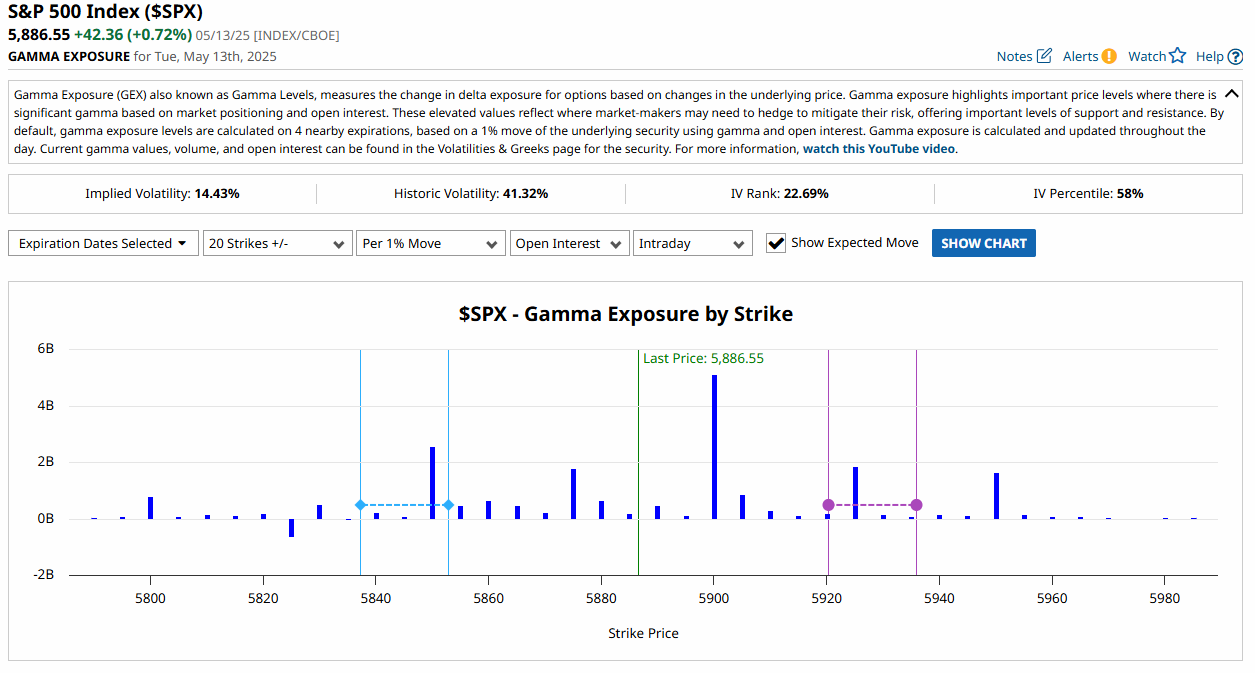
GEX Analysis Update
- 5900 is looking like the key GEX level again.
Expert Insights:
Mistake: Taking every mechanical setup without confirming price action
Fix: Use price structure (like Bollinger Band holds) to confirm trend integrity
Mistake: Jumping in without clear invalidation levels
Fix: Predefine bull/bear flip zones – today: 5880 and 5910
Mistake: Over-monitoring slow sessions
Fix: No need to stare at charts – mechanical setups do the heavy lifting
Rumour Has It…
Bollinger Band Declared Emotional Support Tool
Sources say traders have begun using the upper Bollinger Band like a weighted blanket. “As long as we’re above it,” one trader whispered from beneath a desk, “I feel safe.”
Psychologists confirm it’s become a market-wide security blanket, replacing support/resistance zones in all therapy sessions.
This is entirely made-up satire. Probably!
Breaking scoops courtesy of the Financial Nuts Newswire-because who needs sanity?
Fun Fact
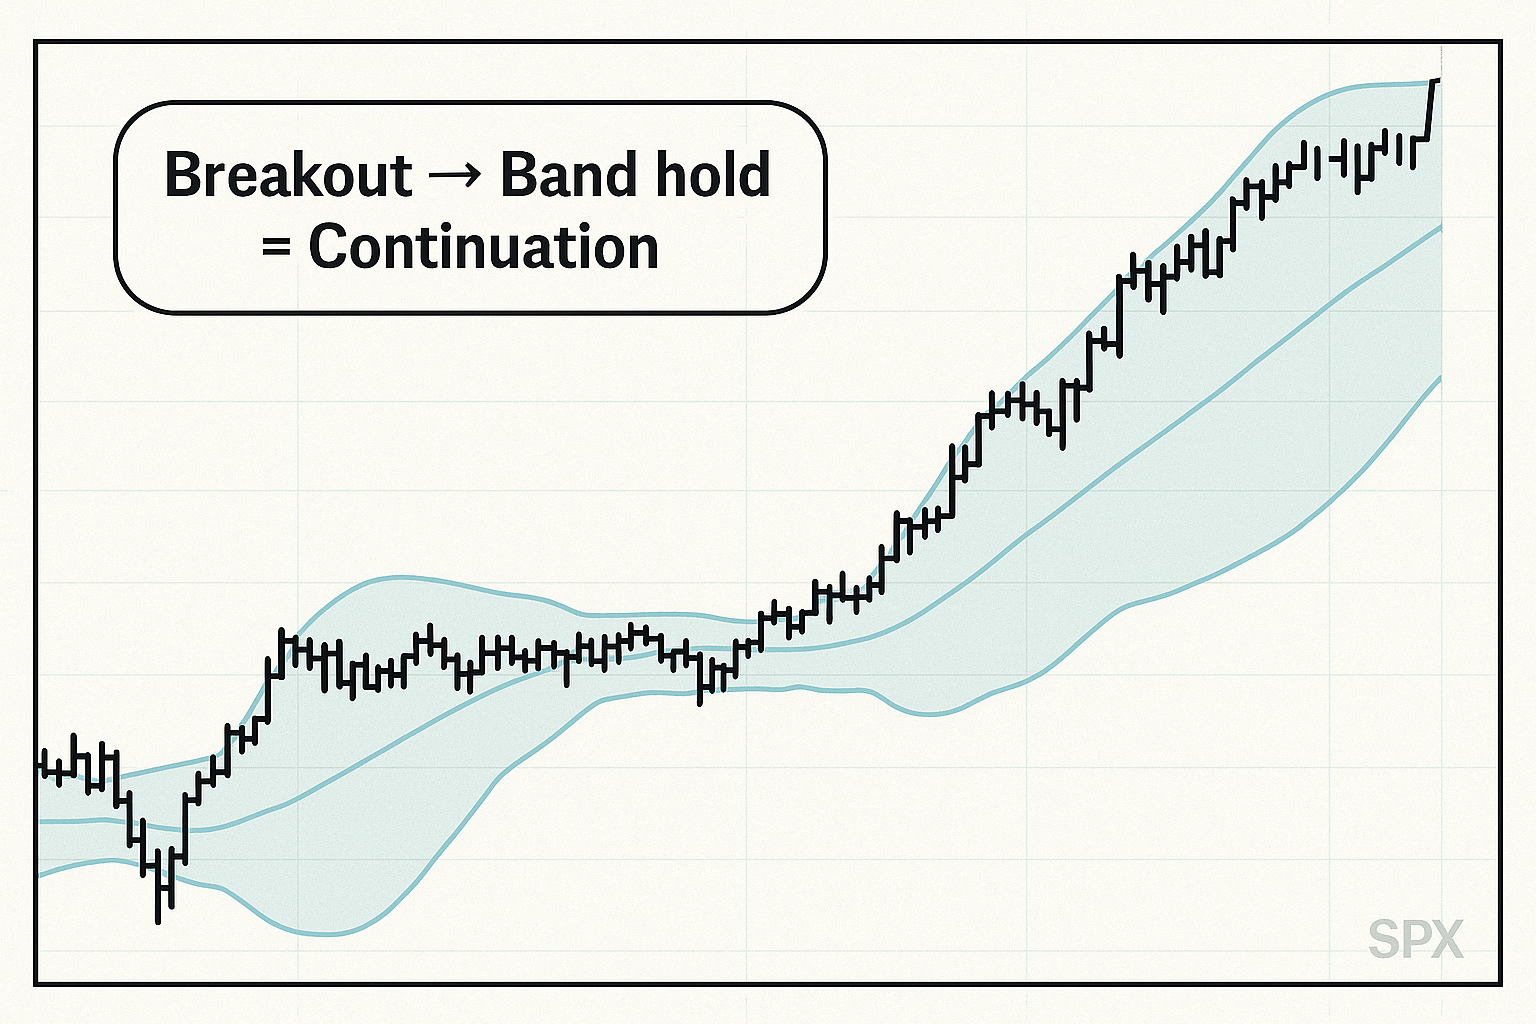
John Bollinger designed his bands in the early 1980s – not just to spot reversals, but also to identify sustained breakouts.
When price hugs the upper band after a breakout, it’s often signalling continuation, not exhaustion. It’s a feature of trend momentum, not a warning of collapse.
Today’s chart is textbook.
The system gives us the setup. But the context? That’s where discretion adds juice to the edge.
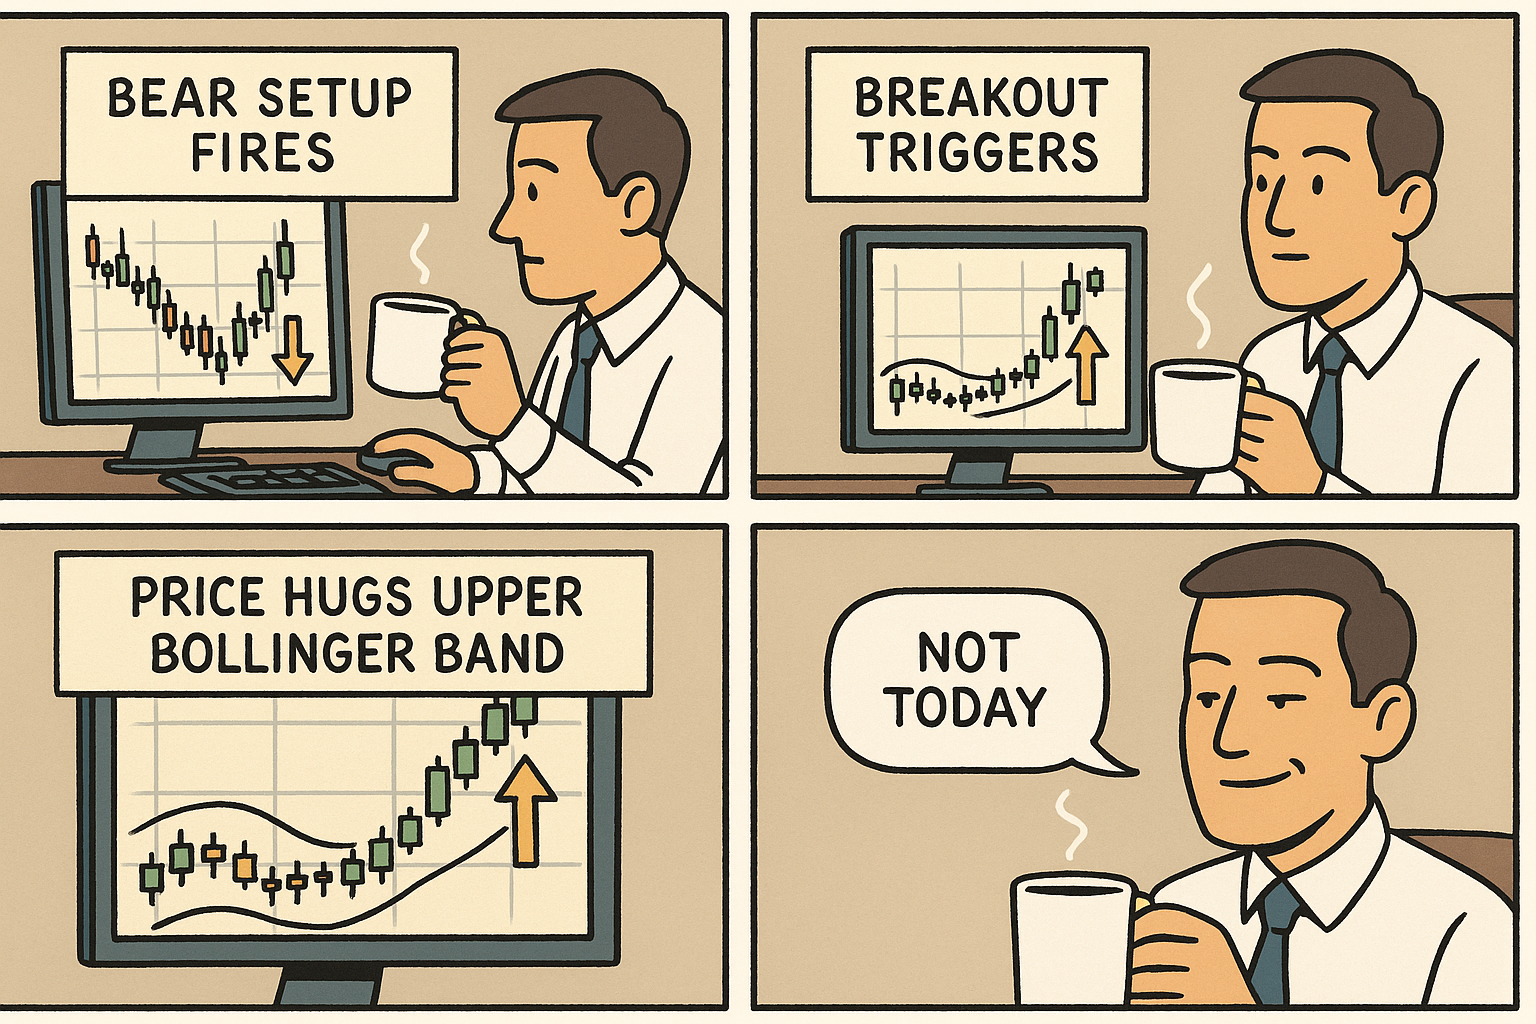
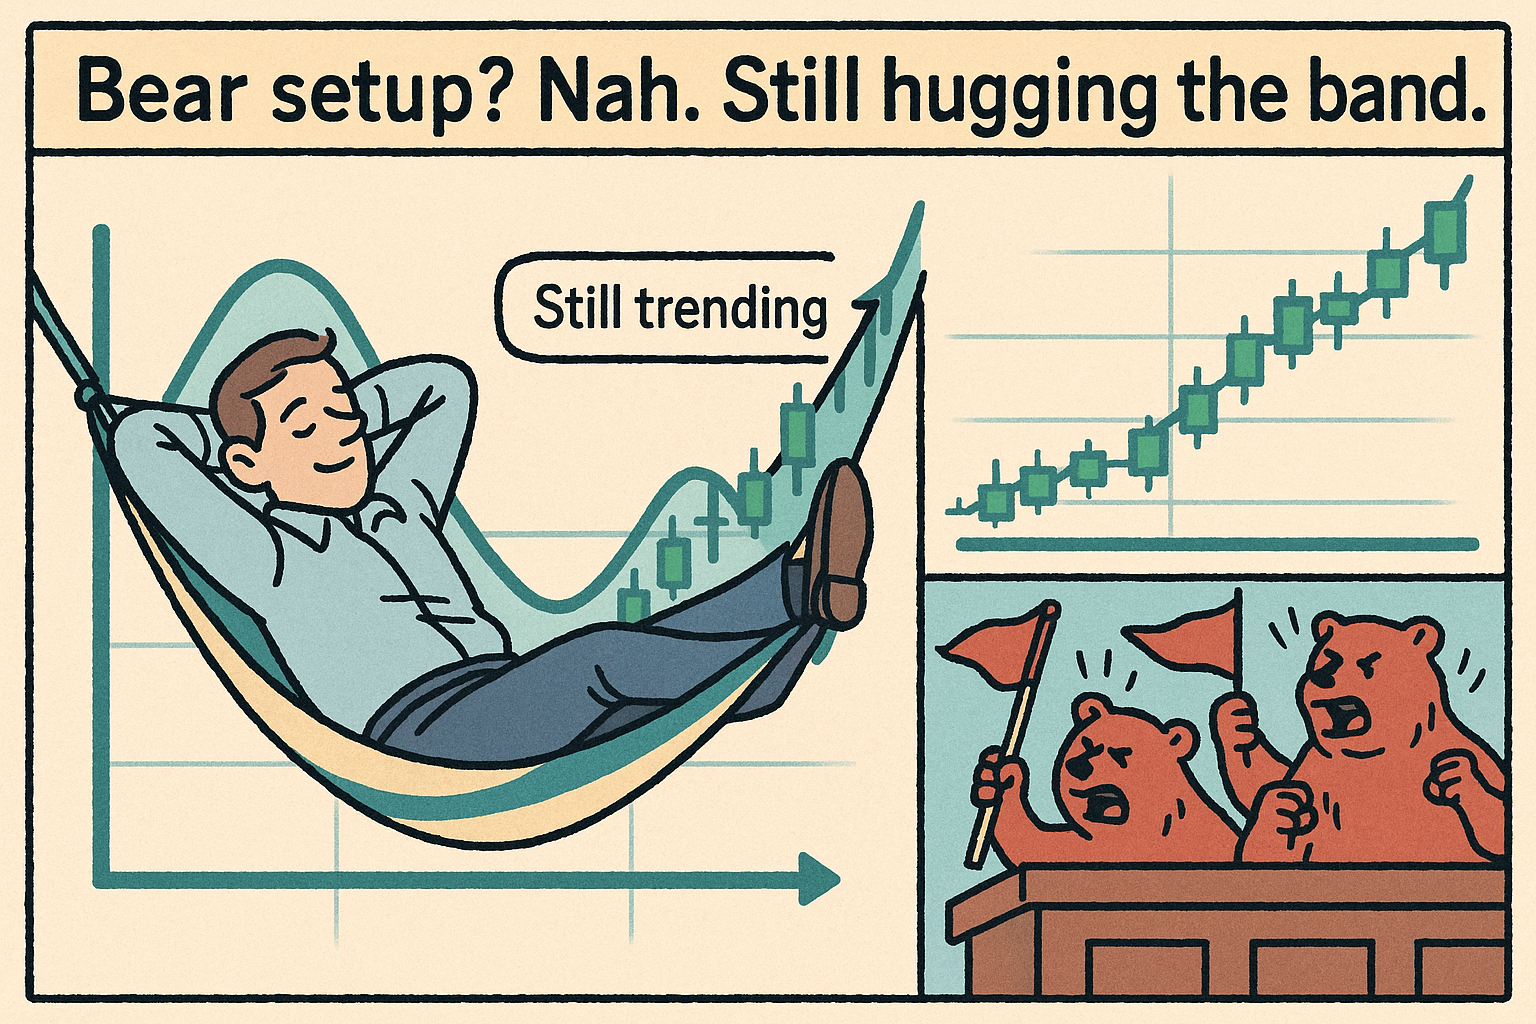
Meme of the Day
“Bear setup? Nah. Still hugging the band.”
Happy trading,
Phil
Less Brain, More Gain
…and may your trades be smoother than a cashmere codpiece
p.s. There are 3 ways I can help you…
- Option 1: The SPX Income System Book (Just $12)
A complete guide to the system.
Written to be clear, concise, and immediately actionable.
>> Get the Book Here
- Option 2: Full Course + Software Access – 50% off for Regular Readers – Save $998.50
Includes the video walkthroughs, tools for TradeStation & TradingView, and everything I use daily. Plus 7 additional strategies
>> Get DIY Training & Software
- Option 3: Join the Fast Forward Mentorship – 50% off for Regular Readers – Save $3,000
>> Join the Fast Forward Mentorship – trade live, twice a week, with me and the crew. PLUS Monthly on-demand 1-2-1’s
No fluff. Just profits, pulse bars, and patterns that actually work.