One of My 6 Money Making Patterns: Upper Range → Lower Range.
 Ahoy there, Trader! ⚓️
It’s Phil…
After a wee bit of flipping and flopping as we toy with the new all-time highs, a decision seems to have been made. We are now looking at what could (finally) be the bear swing.
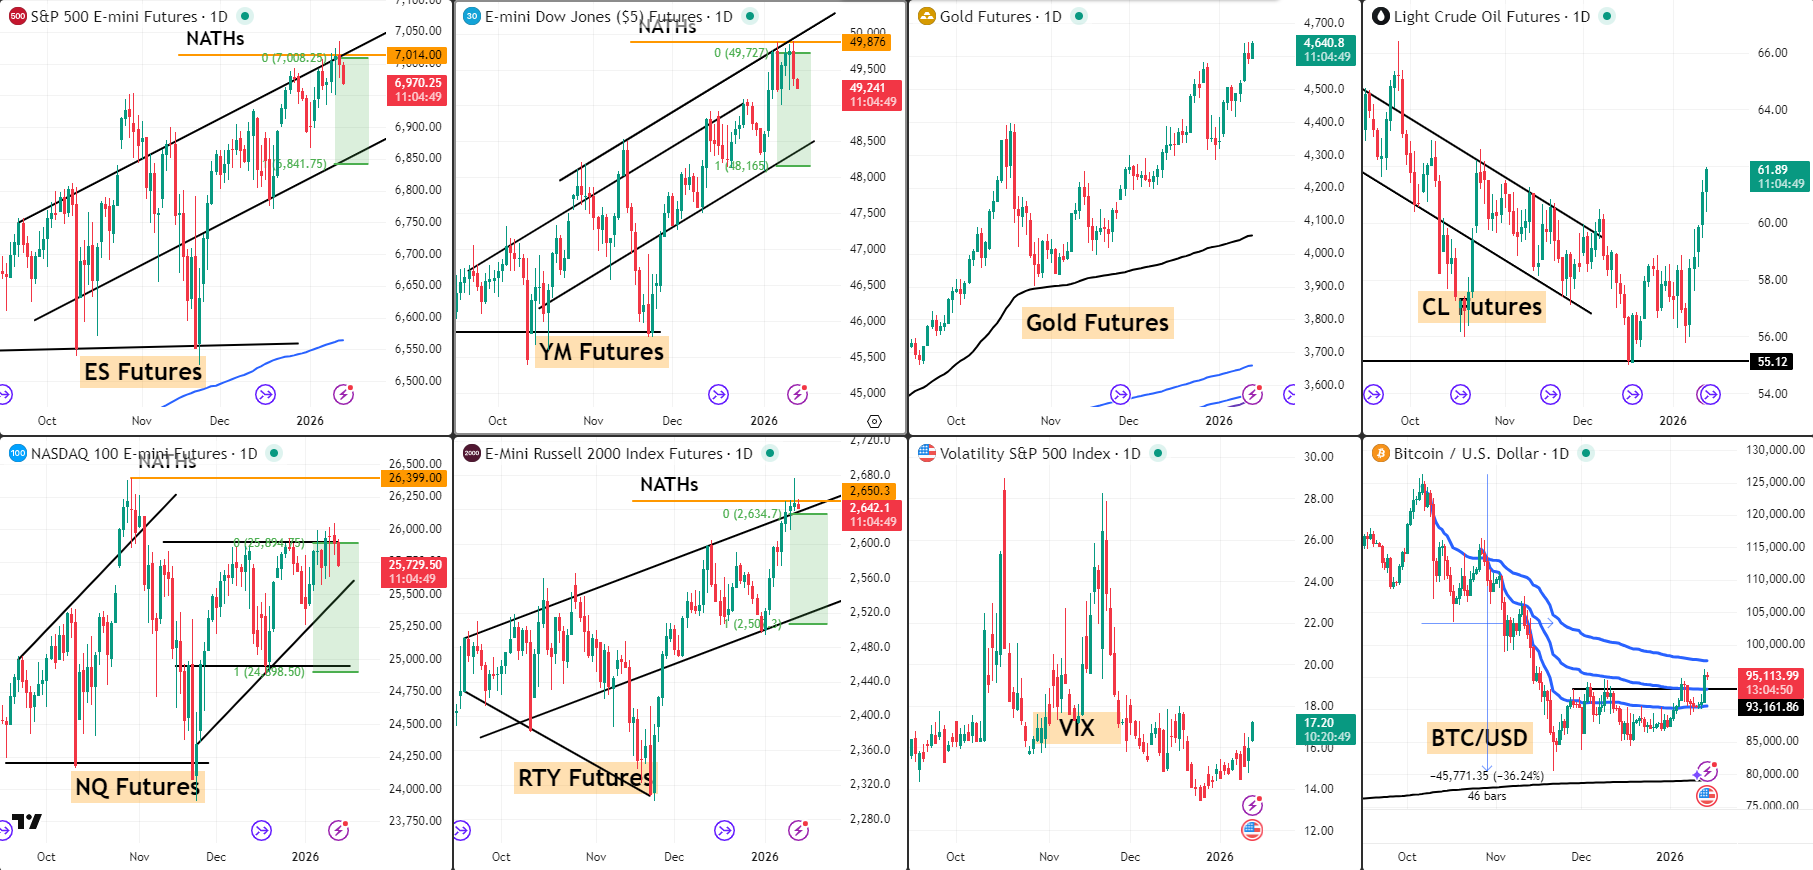
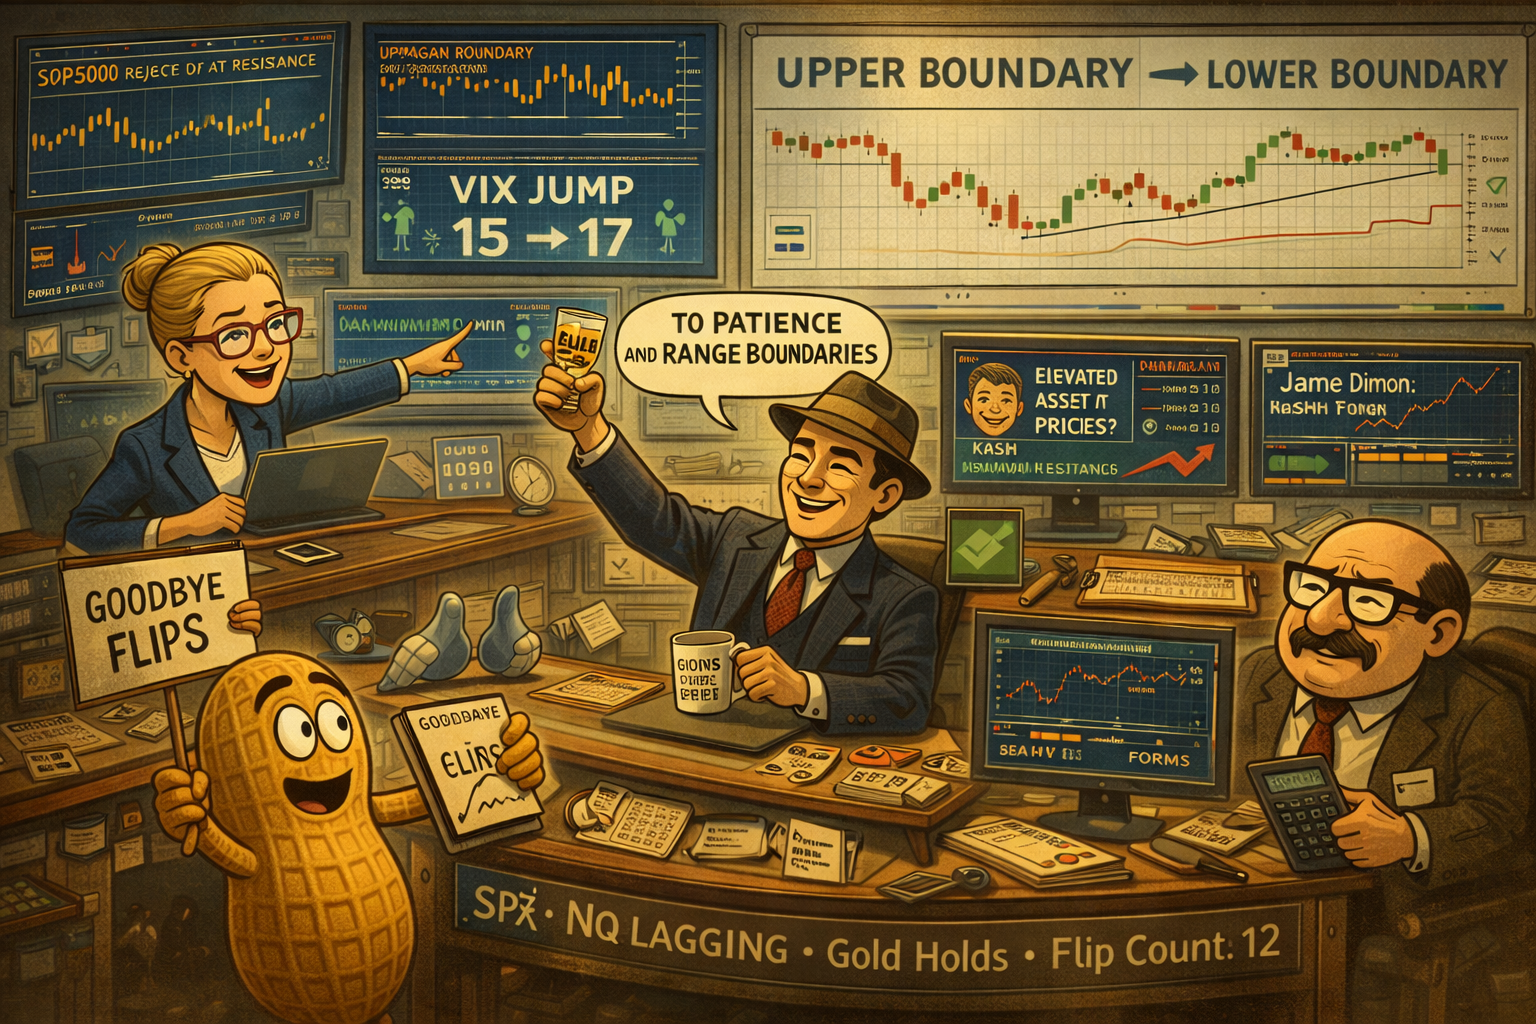
As you can see on the daily charts, we also seem to have banged right up against the upper boundary levels of the consolidation zone we updated on Monday’s group calls.
Nasdaq is leading the bear charge – having not even participated in the recent bull moves.
And this is typical.
One of my 6 Money Making Patterns: when we’re at the upper end of the range, price is expected to move to the lower end of the range.
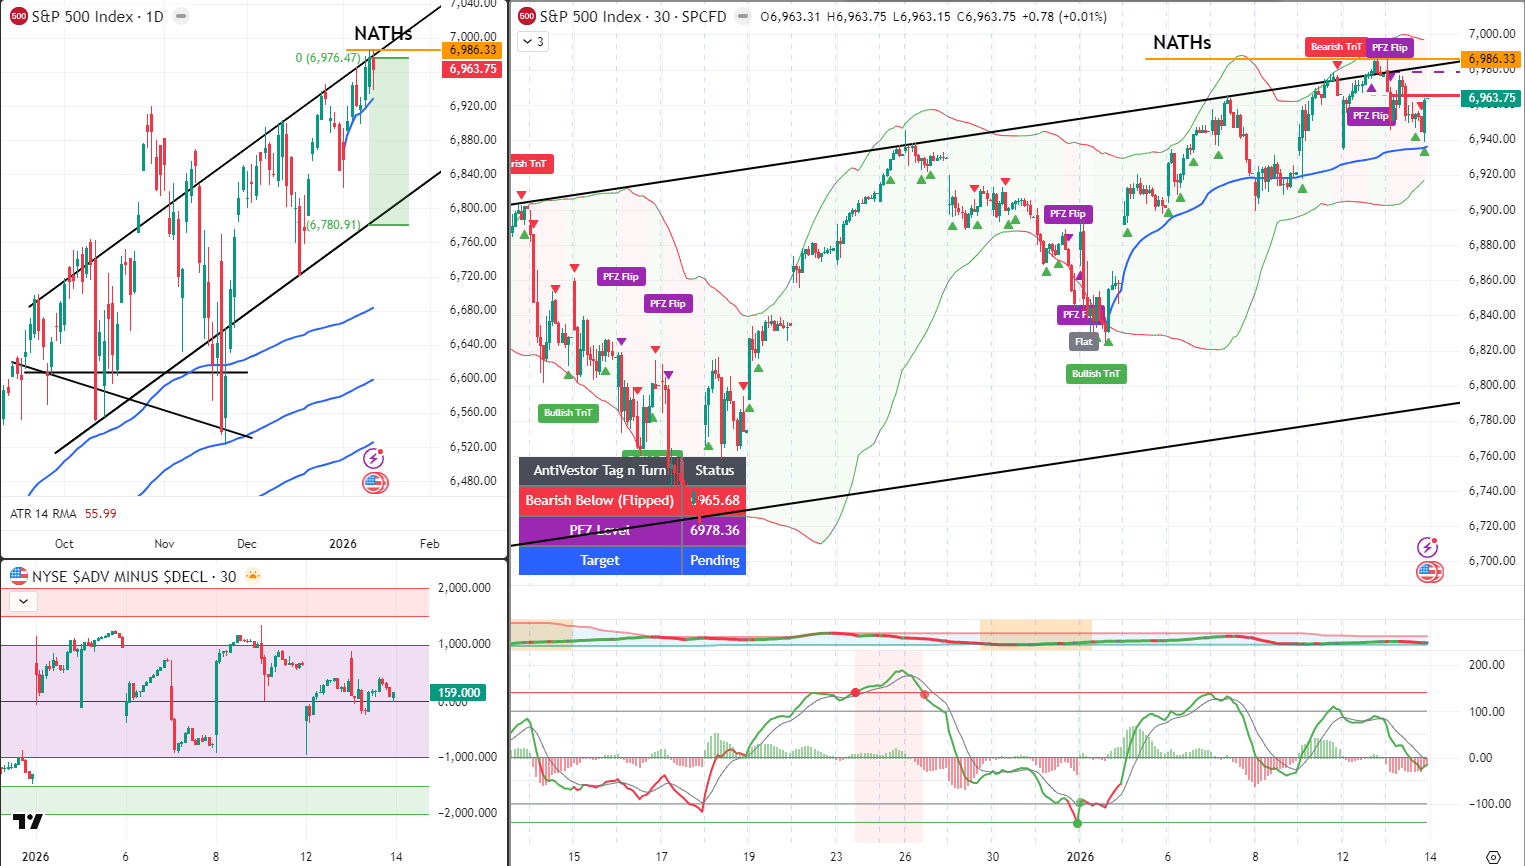
Over on SPX and RUT we can see the details of the flipping and flopping with the Tag n Turn setup. The system is once again bearish having realised a few small losses along the way.
We are now back to waiting to see what unfolds. Given the already-moving overnight moves on futures – the bear is again looking good.
Upper boundary hit. Nasdaq leading down. Systematic patience rewarded.
Range boundaries exist for a reason. Price respects them. So should we
Market Briefing:
The market gave the bulls every opportunity-but they hesitated.
SPX and RUT both touched their upper consolidation boundaries.
Then paused.
Then backed off.
The Tag n Turn flipped back to bearish. After a few minor scratches, it’s now ready to ride the next range move.
Meanwhile, NQ continues its own anti-social game.
It didn’t participate in the recent highs.
It’s lagging.
Again.
This isn’t a sudden bear collapse.
It’s a slow, systematic withdrawal of bullish conviction.
Until the bear roars properly, it’s paper cuts and scalp trades.
Nasdaq – Leading the Bear Charge
NQ never even joined the recent bull party. Whilst ES, YM, and RTY were pushing NATHs, Nasdaq lagged. Now it’s leading the move down. Classic rotation – the laggard becomes the leader in the opposite direction.
Current: 25,729.50 | NATHs: 26,399 | Gap: -2.5%
SPX – Bear TnT Active
After all the flipping, the system has settled bearish. Price hit the upper consolidation boundary and rejected.
| TnT Status | Level |
|---|---|
| Bearish Below (Flipped) | 6,965.68 |
| PFZ Level | 6978.36 |
| Target | 6800 |
| Current | ~6,963.75 |
Price banged against the upper boundary we identified on Monday’s group call. Classic range behaviour – upper boundary → expect move to lower boundary.
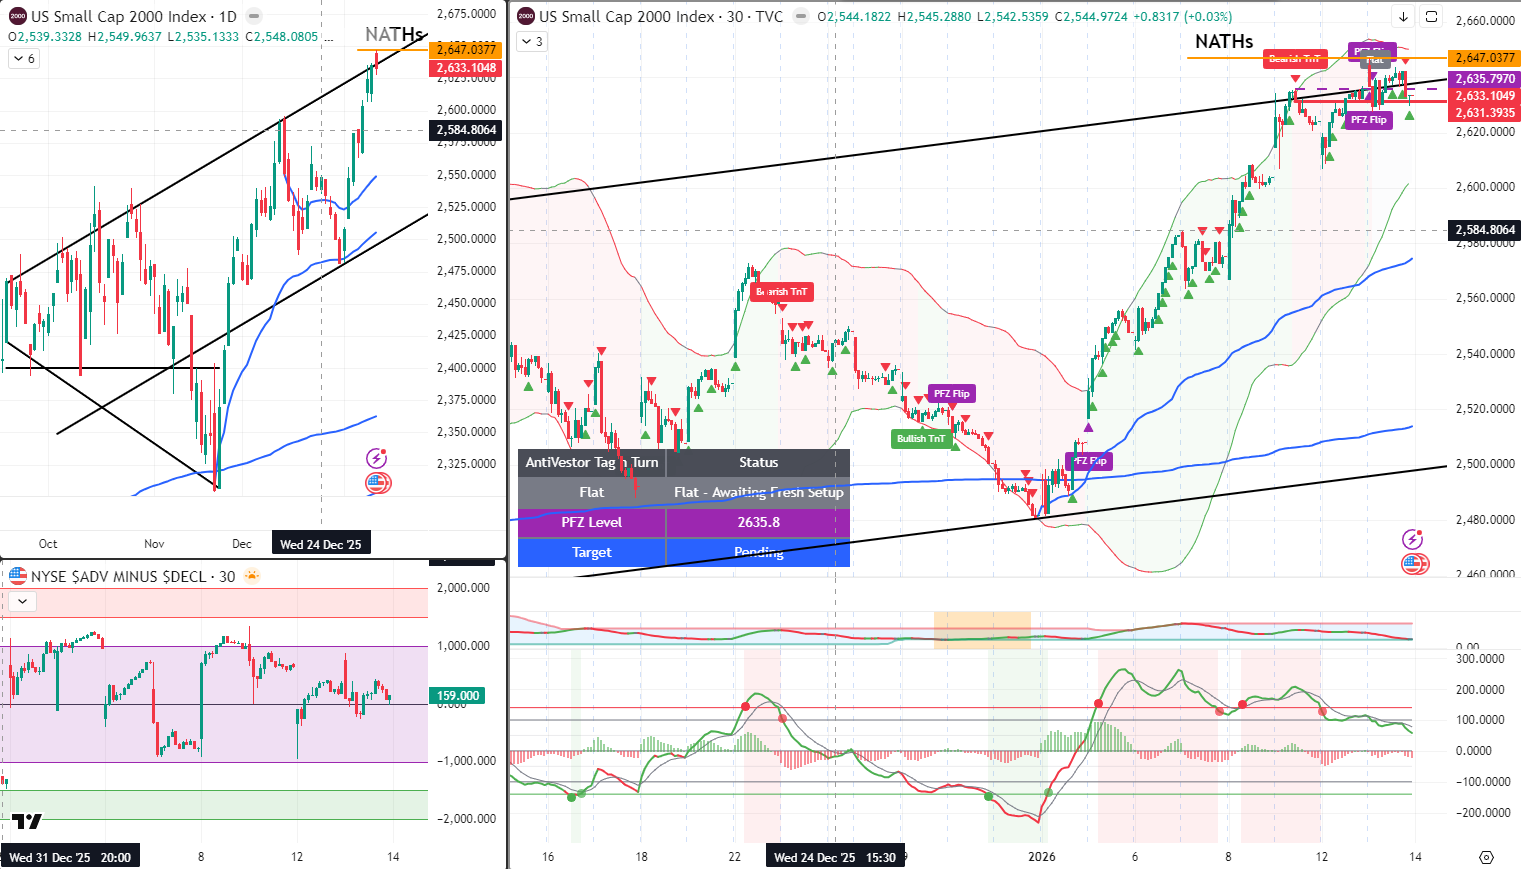
RUT – Flat, Awaiting Fresh Setup
RUT sitting flat whilst the system awaits a fresh setup signal.
| TnT Status | Level |
|---|---|
| Bearish Below (Flipped) | 2633 |
| PFZ Level | 2635 |
| Target | 2500 |
| Current | ~2630 |
6 Money Making Patterns: Range Boundaries
This is one of the core systematic patterns:
At upper range → expect move to lower range At lower range → expect move to upper range
Price hit the upper consolidation boundary. The next expected move? Down toward the lower boundary. Not prediction – pattern recognition based on decades of price behaviour.
Yesterday’s CPI / JPM Recap
CPI came in as expected (0.3% MoM, 2.7% YoY). Core beat expectations (0.2% vs 0.3% expected).
JPM beat earnings ($5.23 vs $5 expected) but Dimon warned about “potential hazards—including from complex geopolitical conditions, the risk of sticky inflation and elevated asset prices.”
Stock fell despite the beat. Market didn’t like the “elevated asset prices” warning from the biggest bank CEO.
PPI Today
| Time (ET) | Event |
|---|---|
| 8:30am | PPI (November + delayed October) |
The shutdown messed up the data schedule. Today’s release includes both months. Could move markets if it surprises in either direction.
[Source: BLS]
Expert Insights:
Range-bound markets reward patience and punish impatience.
The flipping and flopping we’ve seen over the past week is classic behaviour at range boundaries. Price tests the upper limit. Fails. Tests again. Fails again. Eventually, the path of least resistance becomes clear.
Nasdaq never participating in the recent push higher was the tell. When the weakest index refuses to join a rally, it often signals the rally is running out of steam. Now NQ is leading down – classic rotation.
Dimon’s warning about “elevated asset prices” landed yesterday. The biggest bank CEO telling the market that prices are stretched tends to get attention. JPM beat earnings but the stock fell. That’s the market telling you something.
For systematic traders, none of this requires prediction. Upper boundary hit → expect move to lower boundary. Lagging index leads reversal → confirms direction. VIX jumped from 15 to 17 → volatility waking up.
The bear swing is forming. Patience through the flipping pays off now.
In Other News:
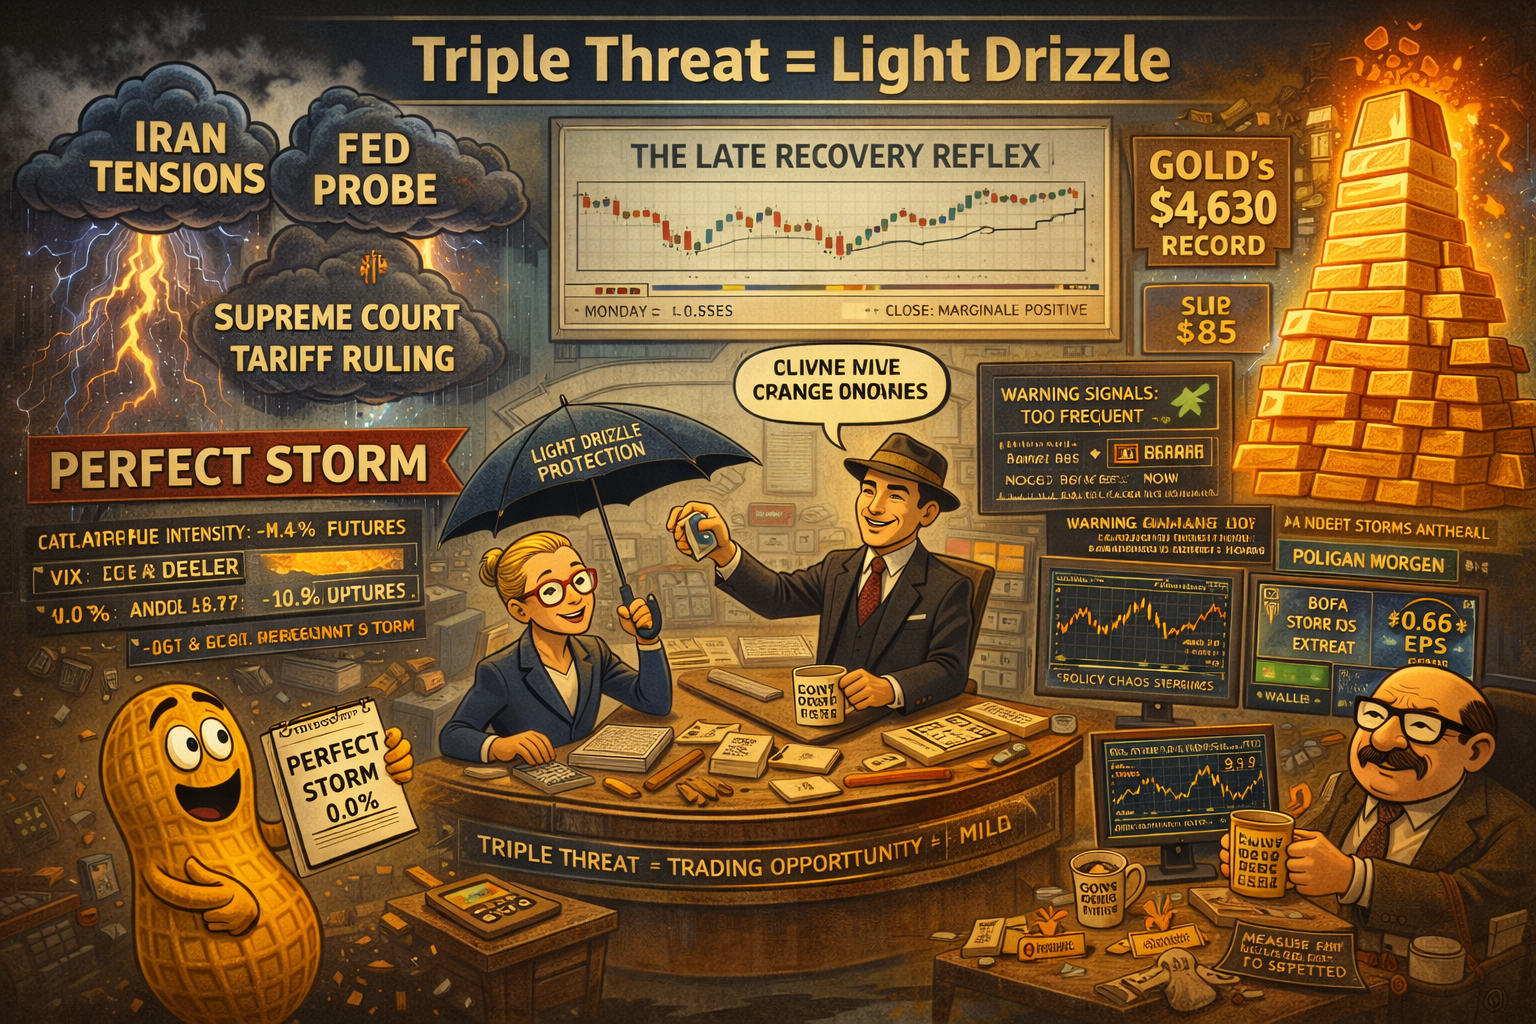
“Perfect Storm” Arrives, Markets Decline 0.4%
Triple threat = Iran, Fed probe, Supreme Court. Gold hits $4,630. VIX climbs to 16. Crisis intensity: mild.
Futures slid 0.4% as “perfect storm” of Iran tensions, Fed probe, Supreme Court tariff ruling tested markets—crisis declared despite percentage moves suggesting light drizzle not catastrophe. Gold broke $4,630 record, silver hit $85, VIX jumped to 16.0 from 15.2 proving precious metals and volatility gauge treating threats seriously whilst equities shrug. Monday’s late recovery clawed back 0.8% losses demonstrating buying-the-dip reflex survives institutional framework collapse.
JPMorgan Beats, Threat “Weighs”
JPMorgan crushed estimates with $5.23 EPS, guided $103B NII for 2026 but credit card rate cap threat “weighs” proving solid fundamentals irrelevant during policy chaos. BofA, Wells Fargo, Citi report today, Goldman and Morgan Stanley tomorrow all facing identical paradox: excellent results overshadowed by executive branch setting lending rates. Sector demonstrates strength whilst markets focus on political uncertainty because apparently actual performance secondary to pronouncements.
⚖️ Supreme Court Tariff Ruling: Binary Catalyst #3
Markets now juggling Iran military tensions, Fed independence probe, and Supreme Court tariff decision creating triple threat analysts calling perfect storm. Options flow shows heavy hedging into volatility catalysts suggesting some participants noticed risks everyone else ignoring. Credit spreads stable whilst supposedly watching Supreme Court proving systemic threats priced casually.
Gold’s Daily Record: Becoming Routine
Gold’s $4,630 record and silver’s $85 surge represent another day, another precious metals high—warning signals so frequent they’ve become background noise. Dollar weakness supports commodities whilst Treasury curve steepens on rate cut bets creating contradictory signals where everything bullish and bearish simultaneously. Defensive shift accelerating as gold miners surge but equity futures only down 0.4% suggesting flight to safety very measured.
☕ Hazel’s Take
Perfect storm declared, futures down 0.4%, gold records routine, JPMorgan beats ignored for threats. When triple catalysts create “perfect storm” producing mild decline and institutional warnings becoming daily occurrence, probably acknowledging risk appetite survives anything including simultaneous geopolitical, monetary, and trade crises.
—Hazel, FinNuts
Rumour Has It:
Breaking from the Financial Nuts newsroom: The team observed markets finally making a decision after days of indecision.
“So the flipping has stopped?” Percy asked hopefully.
“Appears so,” Hazel confirmed. “Upper boundary rejected. Bear swing forming.”
Mac studied the charts. “Nasdaq never even joined the party. Now it’s leading down.”
“Classic rotation,” Wallie noted. “The laggard becomes the leader.”
Kash pulled up the Dimon quote. “‘Elevated asset prices.’ The biggest bank CEO just told everyone prices are stretched.”
“JPM beat earnings and the stock fell,” Percy observed. “That’s… not normal, is it?”
“It’s the market telling you something,” Mac replied. “Beat expectations, fall anyway? That’s exhaustion. That’s ‘good news already priced in.'”
“VIX jumped from fifteen to seventeen,” Hazel added. “Volatility waking up.”
“So we’re finally bearish?” Percy asked.
“We’re finally at the upper boundary with a rejection and systematic confirmation,” Mac corrected. “The system says bearish. We follow the system.”
He raised his morning whisky. “To patience. To range boundaries. To the laggard leading the reversal.”
This is entirely made-up satire. The range boundaries and VIX moves are very real.
Fun Fact:
The January Barometer: 88.7% Accuracy
Devised by Yale Hirsch in 1972, the January Barometer states “as the S&P 500 goes in January, so goes the year.” The indicator has registered only seven major errors since 1950 for an 88.7% accuracy ratio. Bear markets began or continued when Januarys suffered a loss.
We’re fourteen days into January 2026. Still two weeks to go. And that makes this month’s direction genuinely important for what’s coming.
Yale Hirsch – the founder of the Stock Trader’s Almanac back in 1968 – discovered that January’s direction predicts the full year’s direction with 88.7% accuracy since 1950. Seven errors in 75+ years.
That’s not a pattern.
That’s a law of market behaviour.
When January finishes down, bear markets tend to follow.
When January finishes up, the year tends to follow.
Right now we’re sitting at the upper consolidation boundary with a bear swing forming. If this develops into a meaningful January pullback, the Barometer starts flashing warning signals.
If bulls reclaim control and push to new highs, the Barometer stays green.
Either way, what happens in the next two weeks matters more than most traders realise.
The January Barometer doesn’t tell you what WILL happen – it tells you what historically HAS happened 88.7% of the time.
And for systematic traders, that’s edge enough.
[Source: Stock Trader’s Almanac, Jeffrey Hirsch, originally devised by Yale Hirsch 1972]
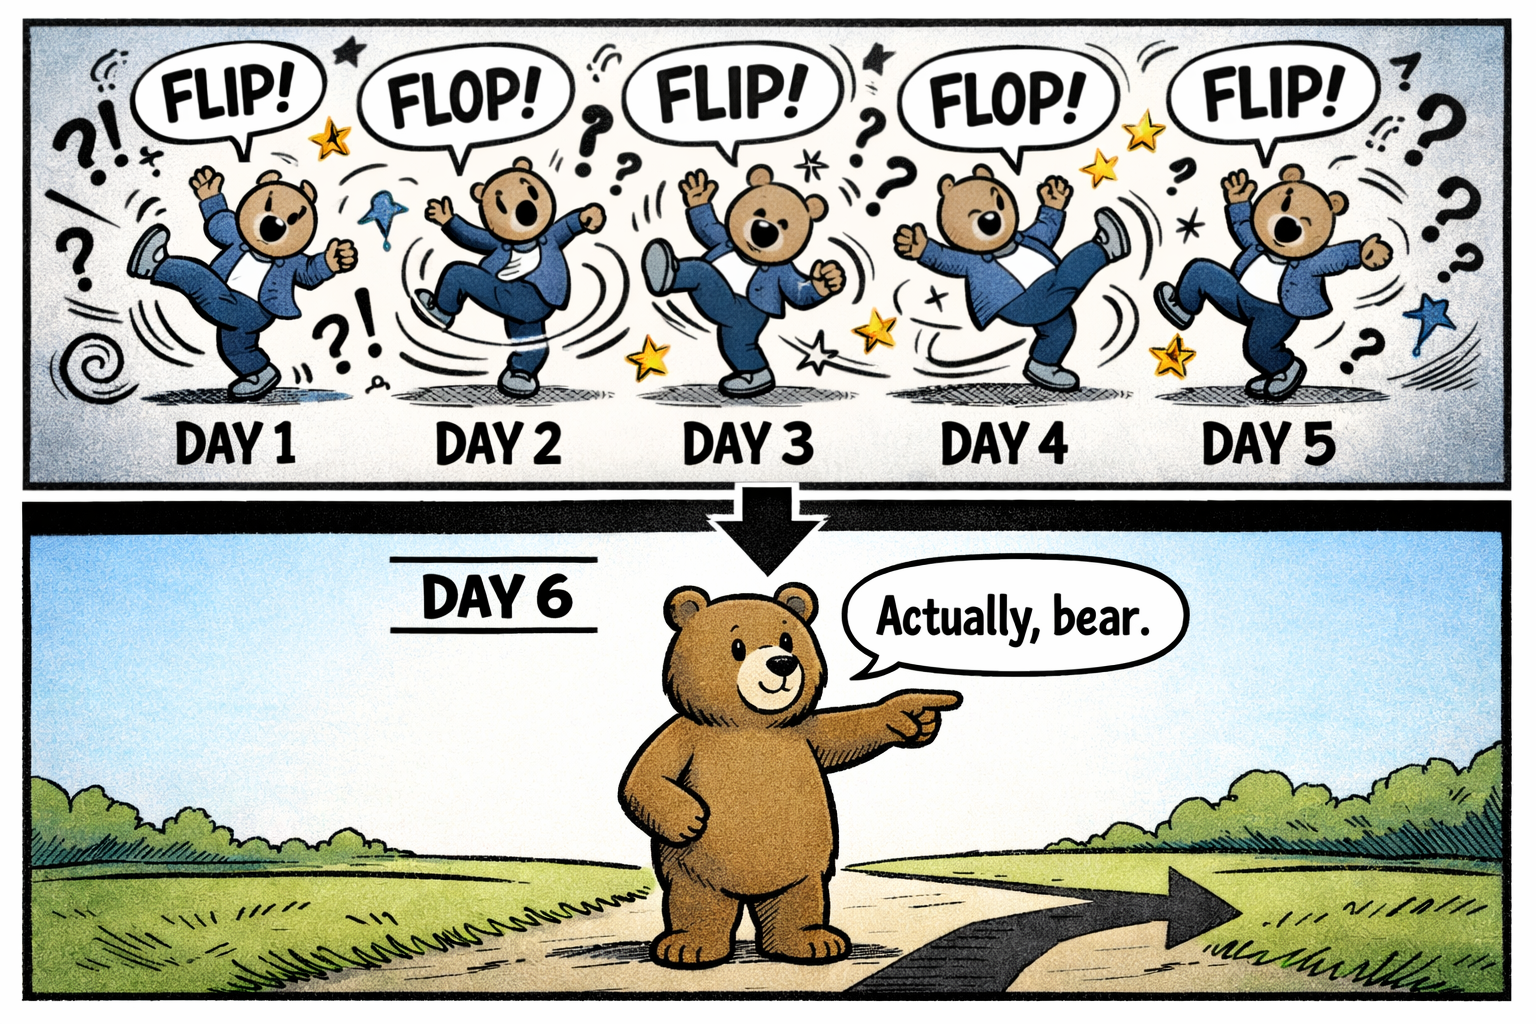
Meme of the Day:
“Market for 5 days: flip flip flip flip flip Market today: ‘Actually, bear.'”
Happy trading,
Phil
Less Brain, More Gain
…and may your trades be smoother than a cashmere codpiece
p.s. There are 3 ways I can help you…
- Option 1: The SPX Income System Book (Just $12)
A complete guide to the system.
Written to be clear, concise, and immediately actionable.
>> Get the Book Here

- Option 2: Full Course + Software Access – 50% off for Regular Readers – Save $998.50
Includes the video walkthroughs, tools for TradeStation & TradingView, and everything I use daily. Plus 7 additional strategies
>> Get DIY Training & Software
- Option 3: Join the Fast Forward Mentorship – 50% off for Regular Readers – Save $3,000
>> Join the Fast Forward Mentorship – trade live, twice a week, with me and the crew. PLUS Monthly on-demand 1-2-1’s
No fluff. Just profits, pulse bars, and patterns that actually work.