This is how NOT to draw trend lines correctly
Before looking at how to draw a trendline for trading stocks, we must first consider how not to draw trend lines.
Mistake #1
Firstly, any two points of reference can be connected to create a trendline.
While it is true that technically you do have a trendline bit simply Connecting any two points does not mean that you have a tradable trendline.
You can see on this chart below that if you can easily connect any two swing highs or swing lows (see the price action article for more price action information)
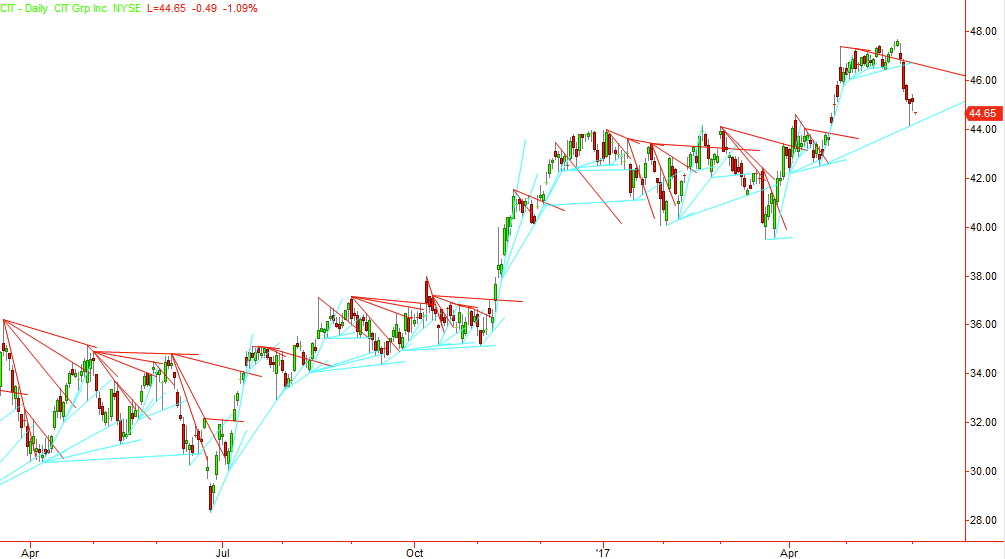
What you should be able to determine is that connecting just two points of reference, called swing highs and swing lows is very confusing and really doesn’t tell you anything about the stock chart or price behaviour with any clarity as to what to do next.
Mistake #2
The second mistake that most traders make when trying to draw trendlines correctly is to use candlestick charts or bar charts when drawing them because you would often being using the extreme high or the extreme low for the day.
Using the close price gives you a much better reference point and switching over to the line on close chart type will allow you to see reference points to use of drawing trendlines that you simply would never have otherwise considered.
Which you can see definitively on this next chart.
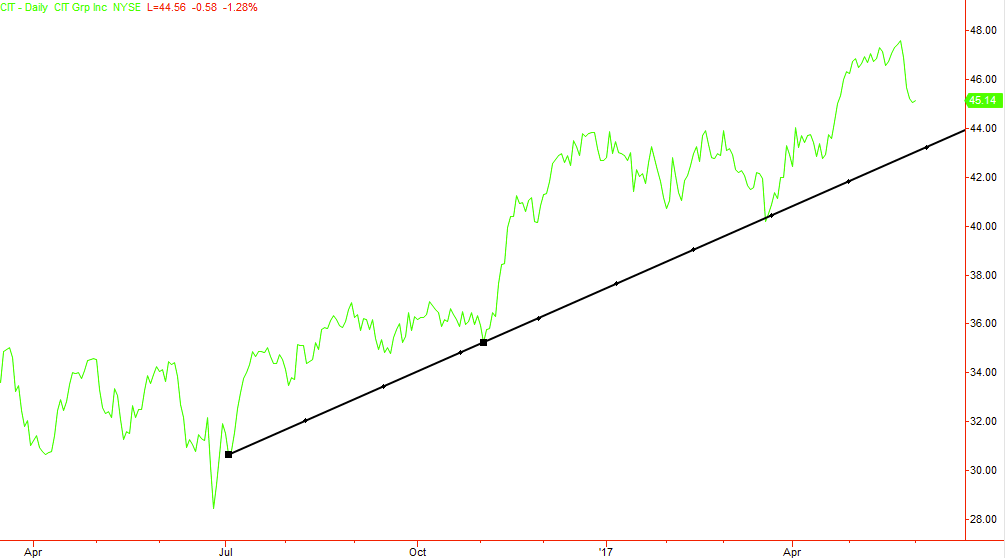
This is how to draw the correct trend line in trading
Rule 1 – Use a line on close chart to more accurately draw your trendline
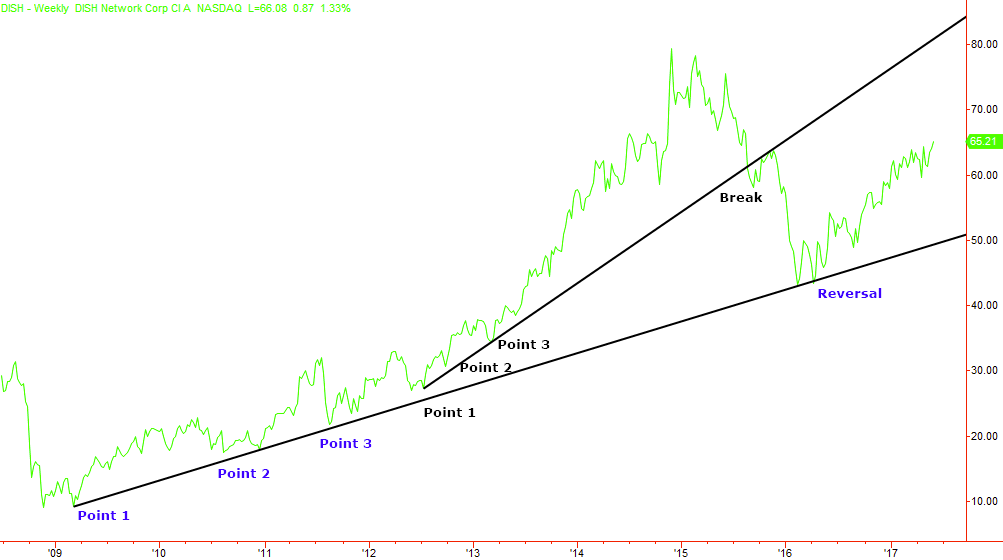
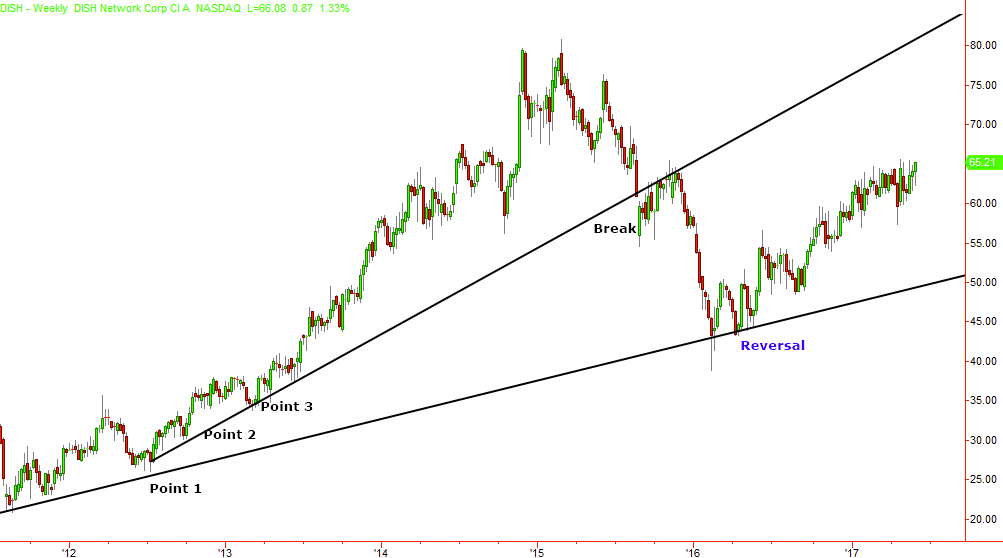
Rule 2 – Use 3 or more swing highs or swing lows as your point of reference
This article could end here with those two profound rules but what I have learnt from more than 20-years of trading and reading price charts to trade Stocks, Forex, Futures and Stock Options is that the simplicity of it works amazingly well.
A point to consider is one which you may have noticed in one of the charts above is that you do not need to see a trend to use trend lines.
By knowing how to draw a trend line correctly your ability to spot and correctly draw different types of patterns will also greatly improve.
Drawing your trendline from left to right
Practically, you draw a trendline from a swing high (or swing low) on the left and connect it to a higher swing high (or swing low) to the right and of course, you would use the line on close chart to draw your trendline correctly as we have already explained.
What you can see on the chart below is the trendline drawn from one of the lowest swing lows and then connecting to the next higher swing low to the right.
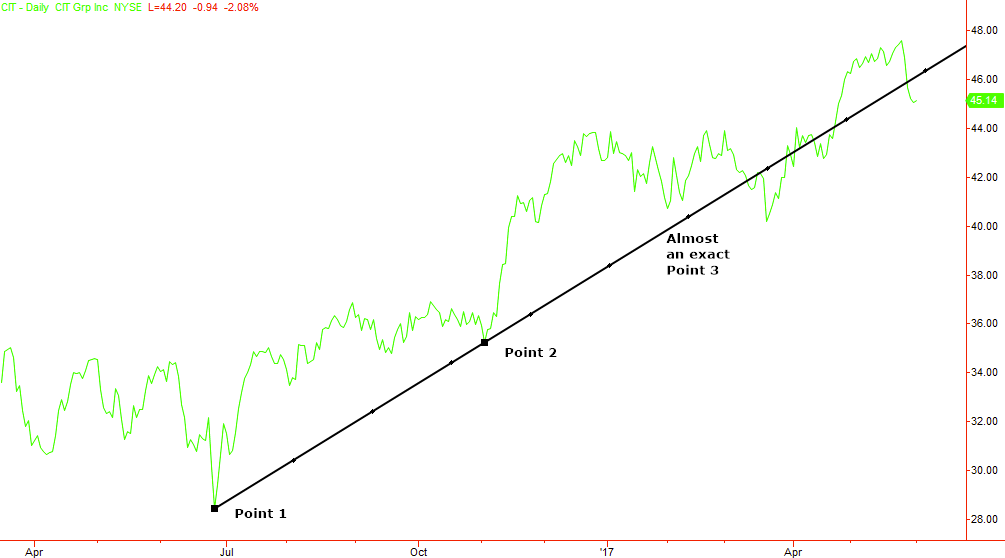
The third connection point is almost touching the trendline. Most of the time this will be good enough.
However, my keen trading eyes spot something interesting which is where the lesser know and talked about way to draw trendlines comes in extremely handy.
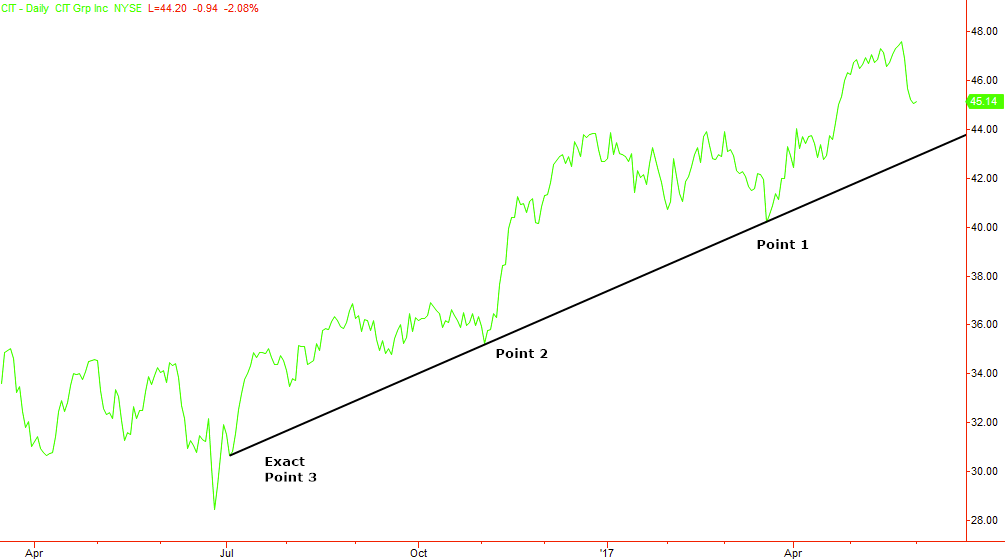
Drawing your trendline from right to left
Yup, you read that correctly.
This time you can start from the rightmost swing low and move left to a lower swing low.
Continuing to extend the trendline to the left you can see that there is an exact connection for a point 3.
This for me gives me my minimum requirement and an even more accurately connected 3 points.
More importantly, this trendline version has not been breached and the uptrend is still in effect.
Whereas on the traditional left to right trendline the uptrend is looking like it is starting to falter or at least doubt the validity of the trendline.
Which way should you draw your trendline?
I use both myself and when you start to use trendlines in this way drawing them both ways you will start to draw them in your mind’s eye before you actually start using the drawing tool on your chart.
Until then try both ways to ensure you have the most accurate trendline you can possibly draw with the information you have.
Trendline trading strategy secrets revealed #1 – Perfect Parallels
OK, so that is a little over sensationalised but there are some trendline tips and tricks that have been discovered (by yours truly) beyond simply using a line on close chart to draw your trendlines.
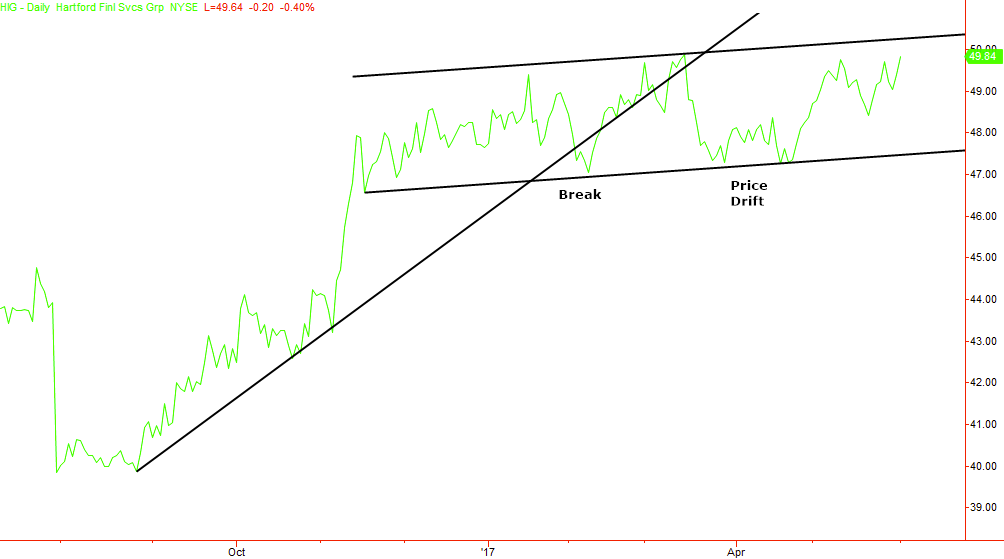
This first trendline tip, which is also the one I most commonly use myself, is to draw a parallel trendline.
Should price look like it is contained or between two boundaries you can take the now correctly drawn trend line using the line on close chart and duplicate it.
I do this because you now have what I consider the most accurately drawn trendline possible and you can take advantage of potential market symmetry.
In the image above this duplicate the trend-line process allows me to take the accuracy of the original trend line and use that to even more accurately draw a small consolidation pattern, in this case, it could be called a price channel as the lines are sloping upward slightly.
You may also notice that I do not need to see multiple touches or connection points because I already have the accuracy from the original trend line, I can use just one swing high (or low) or use the line of best fit
What you will start to note when you apply this particular trendline trick is that you can leave these simple and yet most accurately drawn trendlines on the charts and know with confidence that you can use them today, tomorrow, next week.
Sometimes a stocks price will move back to these accurately drawn trendlines in a few months or a few years and still, you can have confidence in using them to trade with.
This is, as far as I am concerned, how you draw trend channels correctly.
How to use trend lines in trading
At its most basic there are two ways to trade use trendlines as a part of a trading system. The third way to use trendlines is to help with price patterns and general pattern recognition
1 – Trendline Breakouts
2 – Trendline Reversals
3 – Price & pattern recognition.
This third way to use trendlines is to help with price patterns and general pattern recognition which won’t be explored in this article in any detail. Generally speaking, price patterns have their own rules and trading strategy around the pattern being used.
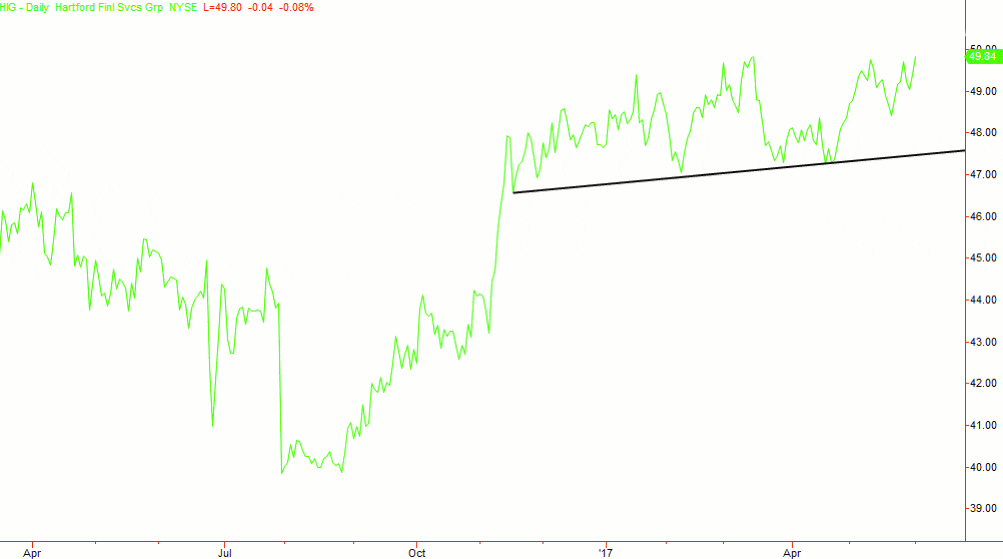
What is a trendline break or breakout strategy?
A trendline break is, as the name suggests when the stock prices move past your now correctly drawn trend line.
A trendline breakout strategy is when you use that pattern to trade the stock that you are looking at.
On the stock chart below you can see highlighted a trendline break.
As the stock prices move below the trendline, thus breaking the trendline, prices pull back slightly without moving back above the trendline.
A simple trendline break strategy would be to use this pullback as a safe way to enter short into the stock and profit from prices moving lower.
The pullback after the trendline break will often be the confirmation of a trendline breakout at the same time.
Targets or price projections for this pattern can be a shallower trendline as seen in this chart (assuming there is one available) or a price extension using Fibonacci (which is a long discussion for a different day and article)
What is a trendline reversal or reaction strategy?
In this situation, a simple trendline reversal strategy is just the opposite of the trend line break.
The stock price will move towards your correctly drawn trendline and essentially reverse back away from it.
This is where moving back to the candlestick charts would be fine for further assessment.
A simple trendline reversal strategy would be to enter in the direction of the established trend when you see candles with large wicks and small bodies.
Sidebar – these can have lots of different and fanciful names like hammers or doji’s. Personally, I do not care what they are called these days. Big spikes are all I’m looking for.
Trendline reversal targets can be as simple as looking for a move back to the recent and previous highs (or lows for a downtrend).
In this example, which has been quite a large move down, I would look up and left from the reversal point and look for the previous logical stopping point.
This is where the previous breakpoint was. This has been covered several times on the site and I will forgo a lengthy explanation here
Both of these simple methods to trade trendlines can obviously be used together to make a more robust and well-rounded trendline trading system
Trendline trading strategy secrets revealed #2 – Trendline targets
There are a few different situations you can use trendlines to aid with price targets. There are of course many methods of targeting but these 3 specifically address the use of trendlines.
1 – Ranges & consolidation patterns
2 – Established trend continuations (reversals)
3 – Trendline breaks and double slope TLs
xxx 3 examples
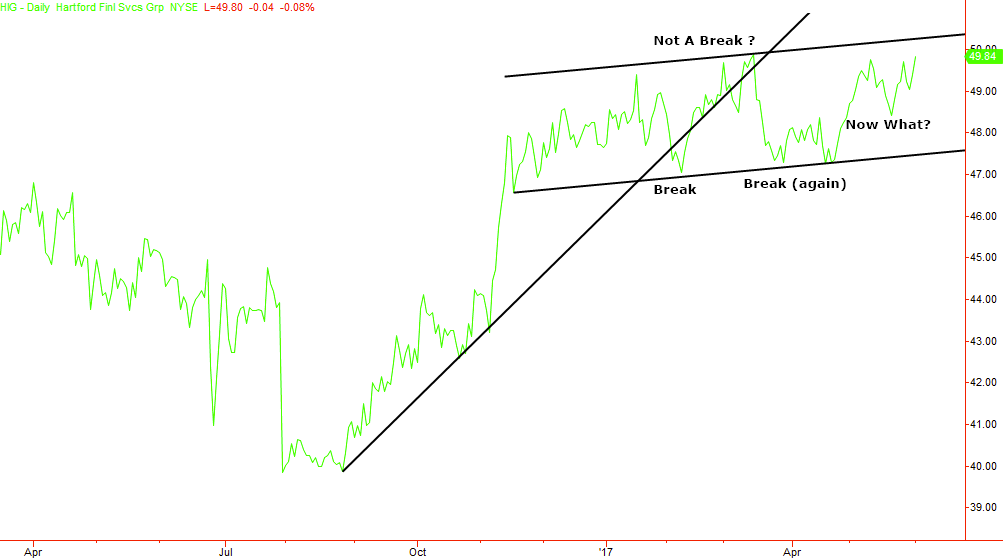
The price drift problem with trendlines and what you can do about it
One of the bigger problems that catch newer traders out when trading trendline breakouts is what I call price drift.
This price drift can happen when you are evaluating the validity of a trendline breakout and price moves past the trendline but you are perhaps not patient enough to wait for a trendline breakout confirmation, such as a pullback after the breakout.
Jumping into a new stock position too soon without waiting for any type of confirmation could mean you endure an immediate snap back in price.
What can often develop is the evolution of price action, which is something that I rarely see talked about in trading circles and certainly not in any of the popular trading textbooks.
The textbooks will always talk about and around the perfect example but will ALWAYS fail to talk about how to go about trading the pattern or system being explained AND take into consideration the real-time markets in which price movement is in constant evolution.
This means that price can move past the trendline and make it appear that a breakout is developing but without confirmation price drift means that the pattern can evolve into something else with a different name.
In this next stock chart price broke down through the trendline and then transitioned from trending to ranging eventually confirming a well-defined range.
You may also note, on the chart below, that price didn’t move below the original breakpoint (previously described as a pullback above).
Another more conservative way to seek confirmation of a trendline break would be to wait for another push past this first push through the trendline.
This is sometimes referred to as trading the second pullback and will dramatically reduce the number of false starts which is the whole point of a conformation.
In this chart, because there was no confirmation of the trendline break price drift eventually developed and even further evolved into a different phase of the movement.
Conclusions
Should you only be trading with trend lines?
Yes and no.
You should definitely consider using trendlines as a part of your overall trading strategy.
However, and as with any trading strategy you decide to use. You should master that element of your trading before moving on to other methods.
Give yourself a minimum of 3 months trading with trendlines before you decide if they are going be a long term part of your trading routine.
In my case, trendlines are not the primary way I trade but they supplement how I trade regularly.
I love to layer methods as additional evidence to support any trading decisions that I make. Layering them on top of my base set of trading criteria, just like you might add salt to food to give it a little bit more flavour.
Trendlines can be used exclusively should you choose to but I would suggest adding them to flavour your trading when needed.