Before we get into the meat and potatoes of support and resistance, I will be focusing my examples on stocks support and resistance but these methods can equally be applied on forex (which I spent 12-yrs days trading and swing trading) or index futures (which I’ve been trading since 2001) or any market you care to trade with a chart based trading system.
With that said, let’s get started.
What is support and resistance in trading?
In stock market technical analysis the terms support and resistance are used when a stocks price moves down to a lower level and then goes no further (at least temporarily) in this example it is often called support.
The opposite is also true in that when a stock price moves to a higher level and then goes no further (at least temporarily). This is often called resistance.
These support and resistance levels are often interchangeable with other terms such as supply and demand levels, levels of interest.
Most commonly, I refer to these points on the charts as logical stopping points.
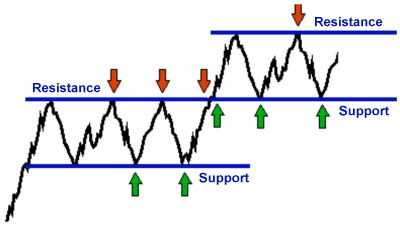 Support is therefore a price level where the demand is such that people are prepared to buy that lower price and prevents the prices from moving any lower.
Resistance is therefore a price level where supply is such that people are prepared to sell that higher price and prevents the prices from moving any higher.
In this illustration, we could easily be talking about a stock price or the price of an Xbox or the latest iPhone. You get my point (hopefully). This is a fundamental truth in business and not just the stock market.
Support and resistance in trading uses this fundamental principle in a graphical form on the charts.
Later we will look at this as well as how these principles can be used to trade and profit from stocks using support and resistance levels.
However, with this definition of support and resistance, it is also worth noting that we will be focusing on when we see multiple occurrences of the same level being touched as this will help us start to develop a tradable strategy around support and resistance.
Previously, we have also looked at when there are a series of higher support levels or lower resistance levels in succession.
Those can be connected with trendlines and have been discussed in this article.
In essence, they are both very similarly interpreted and can be traded in similar ways.
What is a support level in stocks? & What is a resistance level in stocks?
A support level in stocks or a resistance level in stocks (as touched on above) are price levels on the charts where there is enough trading interest in prices that a barrier is created (at least temporarily)
What makes a support or resistance level in stock tradable is when a stocks price gets to these levels multiple times.
In The #1 guide to trading with trendlines (with-examples) article, I stated that any two points on the chart can be connected and with horizontal levels, this is also true.
Seeing 3 or more “touchpoints” starts to make a level interesting to consider using it as a level to trade from.
This is when I can consider a replaceable pattern having evolved and as such makes support and resistance tradable.
How to find support and resistance levels
 The first step always for me is to have a quick way to scan for opportunities that are starting to be interesting for me as soon as today. (I don’t want to waste my time looking at hundreds of charts unnecessarily see this article for more – How to find the best stocks every day on demand)
Now that I have a chart in front of me, I similarly do not want to waste time marking off every support level or resistance level on the chart.
How to draw support and resistance levels in stocks like a professional
You will start with the “eyeball test”. All this means is that you will quickly and visually scan the char for the following rule conditions.
Rule 1 – Look for 3 or more touchpoints
Rule 2 – Start with where the price is now and look left across the chart
If price is not at an interesting level right now I’m not interested in spending any further time looking at that stock or even attempting to divine some mystical understanding which may cause me to place a trade.
My logic which has worked well for the last 20+ years is this
Price has stopped here previously, there is a good chance it will do so again. Until something new happens.
At that point, you can get your fancy drawing tool out and connect the dots.
Once you have “eyeballed” Rules 1 & 2 and seen that price is at an interesting support or resistance level simply draw a horizontal line to mark the spot.
I typically like to flick over to the line on close chart.
Rule 3 – Use the line on close chart to define as an exact level as you can. (just like with the trendlines)
You will often see a significantly clearer indication of where and how you should plot your support and resistance level lines without the candlestick chart clutter.
Support and resistance zones
It is worth noting that sometimes and likely most of the time you will not see and exact to the penny multiple touch support or resistance level and thats just fine.
Most of the time you will have a support and resistance zone. This zone could be quite wide or narrow and in both cases it is just fine.
At the early stages of your trading career, you may stay away from these wide vague levels. There are lots of more specific and well defined levels you can use.
Levels of interest: What makes a level more interesting than others?
A significant shift in supply and demand that causes not just a move away from a price level, but to also accelerate away.
How to draw support and resistance lines
“Ok Phil, I hear what you are saying, but how do you draw support and resistance lines and plot them on the stock chart?”
I’m going to put my neck on the line here and presume you can draw a horizontal line that has 3 touchpoints.
I’m going to further strain myself by preempting you with “what if I only have one support or resistance level?”
Well, there is a good chance you have one slightly lower (or higher) and to the left. In which case you can likely connect those as described in the trendline trading article.
If you cant draw a horizontal line with computer-supported tools keeping the trendline horizontal for you then you have more problems that I can help you with by just reading this article.
Harsh, but true. Get over it.
Support and resistance indicators
The majority of leading platforms both paid and free will have some tools that you can utilise to help you.
Usually these support and resistance indicators can be a little hit or miss because they are free tools and often user-generated not a lot of thought gets put into their development or maintenance.
As I have presented the way I look at support and resistance levels you will not need to stress over if you have correctly drawn your support and resistance level.
I again refer back to this article’s focus which is horizontal lines. Just how hard are they to draw with your charting software assistance? Yup. Not that hard at all.
I would strongly urge you not to worry about looking to automate as most tools don’t work how you expect or because you have not been involved in their development it is likely you dont know how accurate they are if at all.
Support and resistance trading strategy
Now we get to the meat and potatoes I was talking about earlier.
How do you use support and resistance to trade as a system or part of an overall strategy to trade the markets with?
This is the basis of all my trading, well part of it.
Price needs to be at a logical stopping point. Period.
A.K.A. – Support and resistance levels
A.K.A. – Supply and demand levels
When you see a stocks price at such a level you are evaluating for a breakthrough or a reaction from a stocks support or resistance level.
That’s it. That is all you need to assess.
There is no fancy push-button whizzbang gizmo or secret trading hack and the sooner you have this realisation the quicker you can move on and become a better trader.
A stocks price will either continue to do what it’s always done or react to these levels. Remember this is likely the 4th reaction as you are needing at least 3 reactions to call a level interesting enough to trade from.
OR
A stocks prices will “do something new” and push through your level of interest.
Before I go into detail about how I trade each of these scenarios I very much like to “categorise the move” mentioned in here (link)
In short, I like to look at the last 200 candles or bars which for me is approximately the last 12 months of trading days on a daily chart.
A quick glance will tell you if a stocks price is doing one of three things;
- Trending up
- Trending down
- Trading in a range
If you categorise your stock chart as in an uptrend or downtrend then you should consider using trend lines that have been previously discussed at length.
When I see a stocks price trading in a range over the last 12-months. This is when I will pick up the “eyeball test” mentioned above and start to look a little more closely.
Typically, I like to see well defined upper and lower boundary levels. When a stocks price gets to either of the boundary (price extreme) I will be assessing for strategy #1 or strategy #2 discussed in detail below.
Picking things up after the evaluation mentioned above. This should mean there is a high degree of confidence that the right strategy for the correct market condition is being used.
Strategy #1 Trading reversals: A simple support and resistance trading strategy
This strategy works on the premise that until something new happens (strategy #2) then the same thing is likely to continue to develop.
A bearish resistance trading example; (It’s just the opposite for bullish support reversal trading)
At this stage, it should be noted that stock prices have been confirmed as ranging and the support lows and resistance highs have been evaluated and clearly marked.
I like to take a trade on as close to the range lows or range highs as possible. It should be noted that the price is still contained within the boundaries that have been marked.
The timing of a trade is always using a candle with a large wick and a small body. These could be called hammers, doji’s or shooting star to give you a mental image but I do not prescribe to the exact textbook definitions of those candle pattern types. Just look for a big spike.
- If the stocks price is at support, look for the spike at the lower end of the candle.
- If the stocks price is at resistance, look for the spike at the upper end of the candle.
I like to use this spiked candle as my trigger bar and will use the high (off support) to trigger my trade. While I use options to place my trades I have no need for a stop loss as my risk is defined on the entry, a protective stop loss if using stock or spreadbetting can be placed below the spike lows.
Targets are based on the stocks price continuing to do what it’s always done and moving back to the midpoint of the range and ultimately back to the upper boundary level of the range.
The opposite is also true bearish trade setups.
Strategy #2 Trading breakouts: A simple support and resistance trading strategy
This strategy works on the premise that until something new happens then the same thing is likely to continue to develop (strategy #1).
This time I will be focusing on what “something new” looks like although as you are a smart and astute reader I would trust that you kinda get it already.
A bearish support breakout example; (it’s just the opposite of a bullish resistance breakout)
As with strategy #1, at this stage, it should be noted that the stock prices have been confirmed as ranging and the support lows and resistance highs have been evaluated and clearly marked.
What should be observed this time is that the stock prices are no longer contained and has moved past the marked support or resistance boundaries that have been marked.
This is what I consider something new in development.
Further to this, I require confirmation in the form of a pullback.
A pullback or small retracement is when stock prices have pushed through support, as in this example below, thus breaking support.
This will be followed by a pause or price moving back for one or several candles. This pullback will also usually stay beyond the breakpoint often this is referred to as “support becoming resistance” or vies versa if the stocks prices were to rally through resistance.
This pullback pattern can be traded in a few different ways the safest and easiest way to consider (assuming this is all new to you) is to use the lowest point of the breakouts move down. This can be considered the pullback low.
I typically use this point as my trigger point to get myself positioned. While I use options to place my trades I have no need for a stop loss as my risk is defined on the entry, a protective stop loss if using stock or spreadbetting can be placed above the highest point of the retracement (pullback high).
Targets can be easily calculated using the height of the range that has already been marked off and using that dollar amount to project a target down.
Final words on trading with support and resistance
My first final words is that I hate the terms support and resistance, especially the way the texts books write about it.
The phrasing implied that support will always hold as will resistance. If this were true there would be no markets and prices would remain fixed.
The terms supply and demand are better and certainly more descriptive of what is actually happening especially in relation to economics 101. Which is a fundamental principle of business that everyone should know and learn.
I prefer the use of logical stopping points and levels of interest more from the psychological perspective. Meaning that I am not trying to precondition myself into thinking that price will reverse at support because that is what the textbook tells you. Which is complete bullshit.
You should always consider that price can go up down or sideways at any given moment in time or price level. What we strive to do as technical traders is to stack the odds of success in our favour by looking for price behaviour to repeat itself and time an entry to give the lowest risk and the highest reward WITH the most amount of probability in our favour.
Trading with and around a stocks support and resistance levels or supply and demand levels or whatever you want to call them is an ESSENTIAL part of my trading and should be included in everyone’s trading.
This is a fundamental principle of how the markets and business works.