4 Wins Yesterday. 63%. 69%. 72%. 90%. The Range Keeps Paying.
 Ahoy there, Trader! ⚓️
It’s Phil…
All my bear dreams came true yesterday.
Then they reversed. Just as quickly.
The overnight moves claimed the bear back, and we’re playing this weird game of bull bear ping pong again. Bears score, bulls answer. Bulls score, bears answer. Nobody’s winning convincingly.
Should this surprise anyone? I don’t think so.
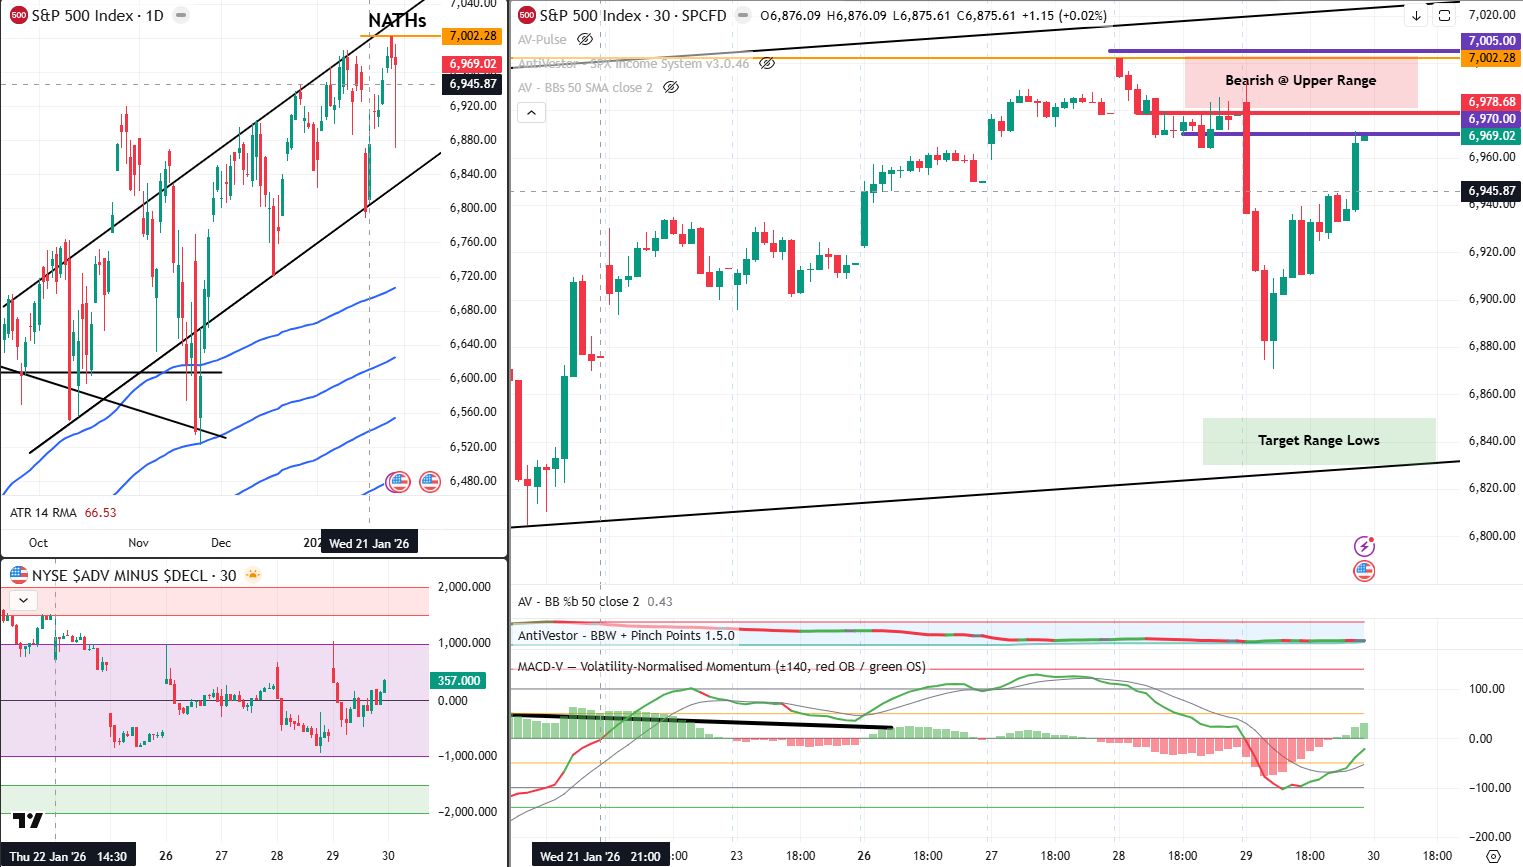
Price has been moving between the upper and lower range boundaries since October. We’re at the upper boundary. The playbook says: assess for breakouts or reversals. Price didn’t break out. So here come the reversals.
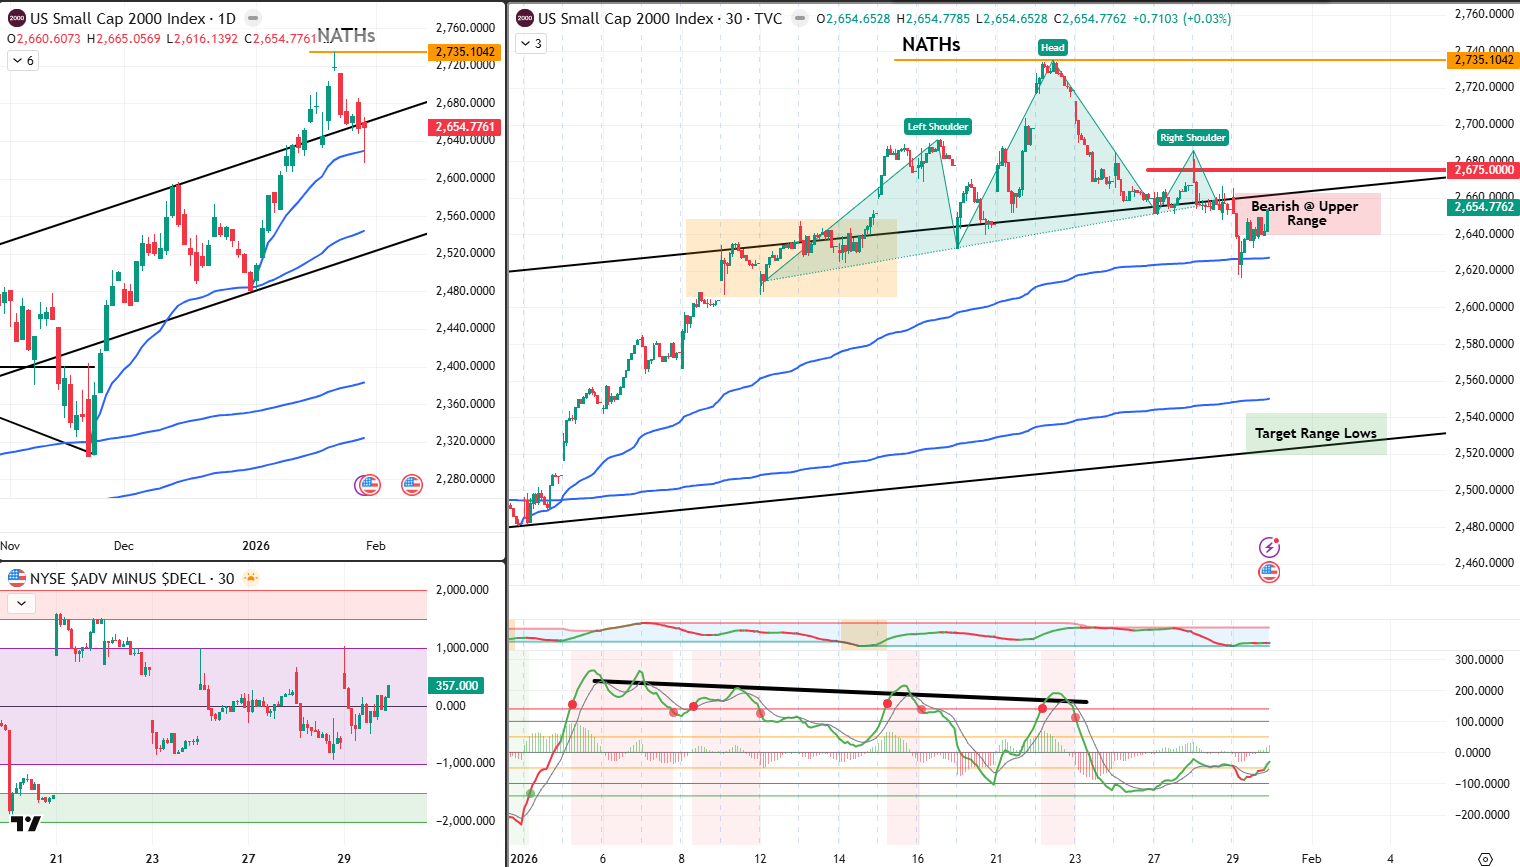
Uncle Russell even attempted a breakout – that head and shoulders we spotted? It’s playing out beautifully. Price is retreating firmly back into the range, exactly as the pattern suggested.
Meanwhile, the wider world gave us Microsoft losing $440 billion in market cap (worst day since March 2020) whilst Apple posted record everything. Bitcoin broke its 100-week moving average and crashed to $83K. Gold retreated 4% but is still up 20%+ for January.
Same chaos. Same range. Same opportunities.
Scroll down for the systematic breakdown
Including why 4 wins yesterday proves the range keeps paying…

Market Briefing:
Multi-Market Status
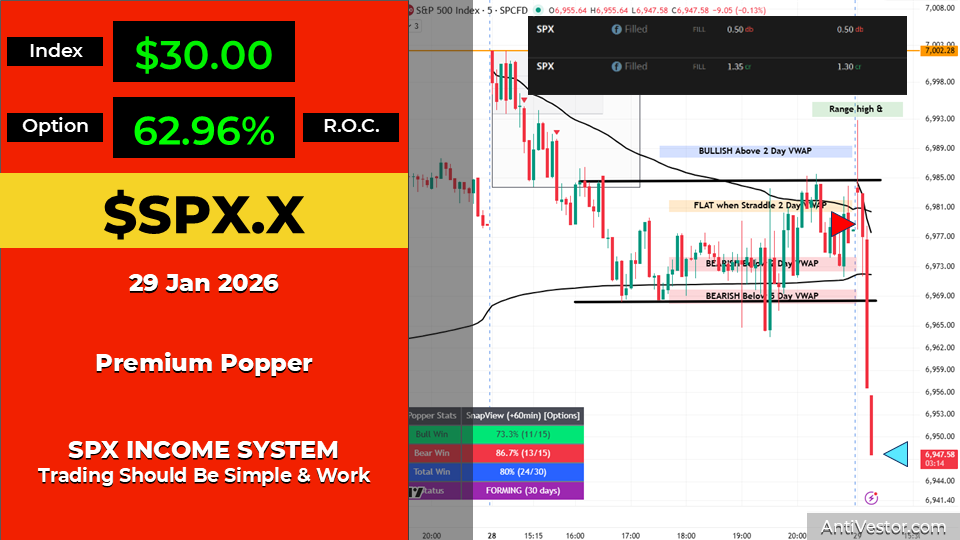
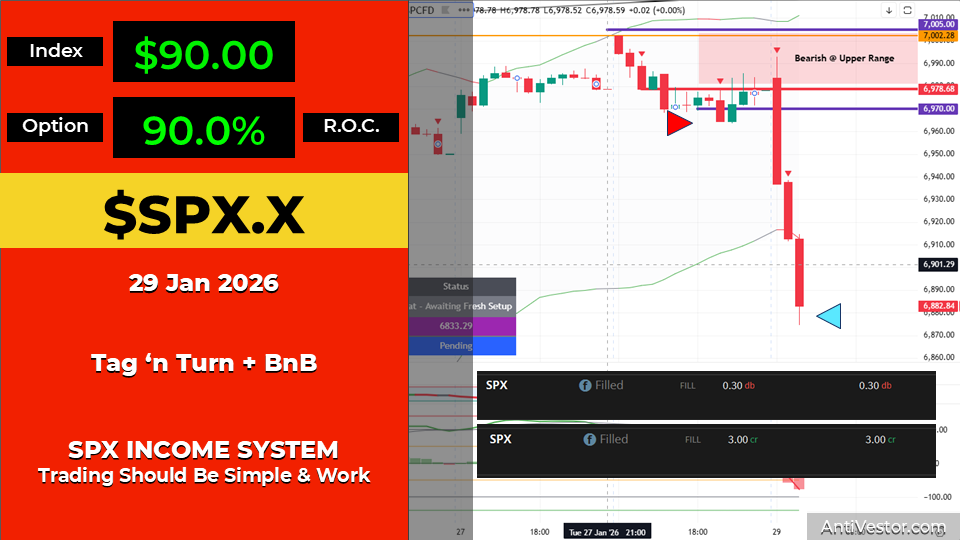
SPX: Flat – Awaiting Fresh Setup. PFZ Level 6833.29. Target pending. But the TnT workspace is making a lovely bear move. Delaying bull trades is sensible here. The overnight BnB swing caught the move beautifully – $90 index move, 90% ROC.
RUT: Bullish Above 2643.11. PFZ Level 2616.14. Target 2676.49. The system has flipped after the breakdown. But context matters – that head and shoulders is playing out, price retreating into the range. Delaying bull entries in favour of bear continuation is working nicely.
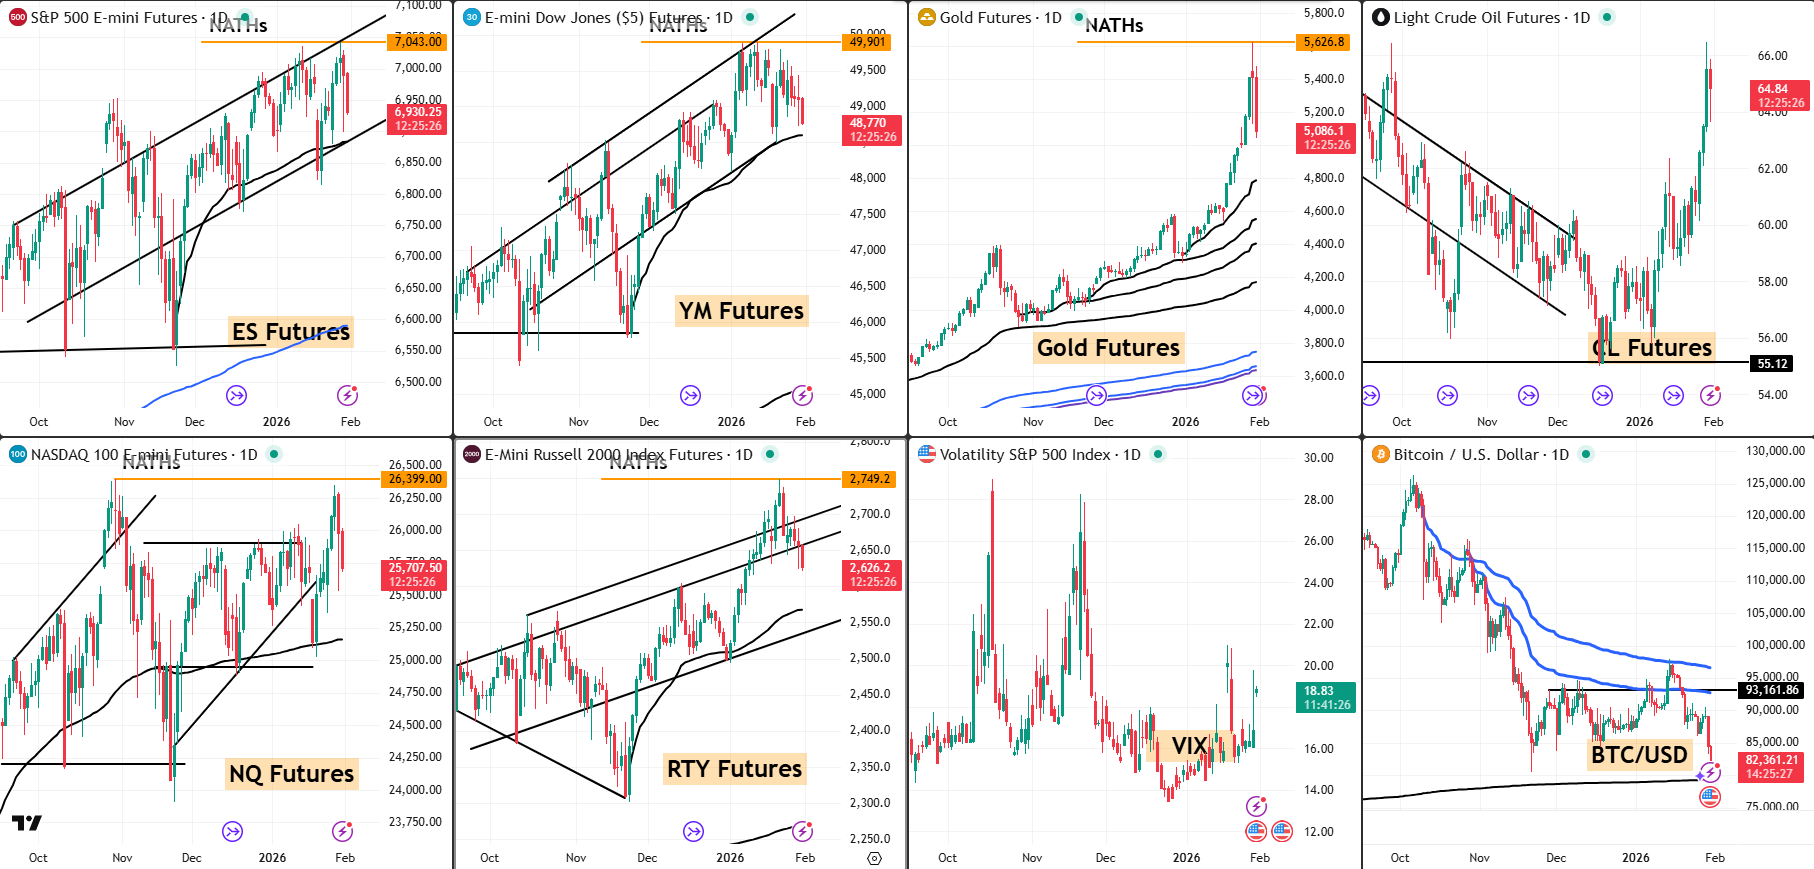
ES Futures: 6,930.25 – down from yesterday’s highs. Back to ping pong mode.
NQ Futures: 25,702.50 – Microsoft’s $440B massacre dragging the index.
YM Futures: 48,770 – old economy holding up better than tech.
RTY Futures: 2,626.2 – the breakdown continues. H&S target in sight.
Gold: $5,086 – retreated 4% from $5,520 highs but still up 20%+ for January. Taking a breather.
VIX: 18.83 – elevated, watching the chaos.
Bitcoin: $82,361 – BROKE. The 100-week moving average that held for nine weeks? Snapped. ETF outflows hit $1.14B weekly. The “digital gold” narrative looking increasingly awkward whilst actual gold parties.
The Range Reality Check
Let’s zoom out for a moment.
Since October, price has been trading between well-defined boundaries. Upper range. Lower range. Touch one, reverse towards the other. Rinse. Repeat.
Yesterday was textbook:
- Price at upper boundary
- Assess for breakout or reversal
- No breakout
- Reversal begins
The bear dreams came true during the session. Then overnight flows pushed back. Then this morning we’re down again. It’s ping pong, but it’s ping pong within a structure we understand.
The edge isn’t predicting which day the bulls or bears win. The edge is knowing where the boundaries are and trading accordingly.
When we’re at the upper boundary, we favour reversals until proven wrong. When we’re at the lower boundary, same logic, opposite direction.
This has been the playbook since October. It keeps working.
The RUT Head and Shoulders Update
Remember that pattern we spotted at the NATH?
It’s playing out.
Left shoulder, head at the absolute peak, right shoulder – and now the neckline is breaking. Price is retreating firmly back into the larger range, exactly as the pattern suggested.
RUT dropped from 2,735 (head) to 2,626 this morning. That’s over 100 points of move, and the H&S target suggests more room to run.
The TnT system has flipped to bullish above 2643.11, but context matters. The breakdown structure is clear. Delaying bull entries in favour of letting this bear move complete is the sensible play.
The Microsoft vs Apple Divergence
Tech told two completely opposite stories yesterday:
Microsoft (-10%): Worst day since March 2020. Azure grew 38% but investors wanted faster. Capex surged 89% to $34.9B. OpenAI now 45% of cloud backlog. Morgan Stanley dropped it from Top Pick. $440 billion in market value – gone in hours.
Apple (+2% after hours): Record revenue $143.8B (+16%). iPhone demand described as “staggering” with 23% growth. China exploded 38% to $25.53B. Company now “supply constrained” chasing demand.
Same sector. Same day. Completely opposite outcomes.
This is the market we’re trading. Divergence is the norm. Correlation is the exception.
The Bitcoin Breakdown
Something significant happened in crypto yesterday.
Bitcoin broke its 100-week moving average. That level had held for nine consecutive weeks. Then it snapped. Price crashed 6.4% to $83,383 – lowest since November.
ETF outflows hit $1.14 billion weekly. The institutional bid that propped up 2025’s rally? It’s retreating.
Meanwhile, gold retreated 4% from its $5,520 record but is still up over 20% for January alone.
The “digital gold” narrative is having a rough week. Actual gold is winning.
Yesterday’s Scorecard
Four trades. Four wins. The range keeps paying.
SPX Premium Popper: $30 index move. 62.96% ROC. Bear break below the new all-time high resistance.
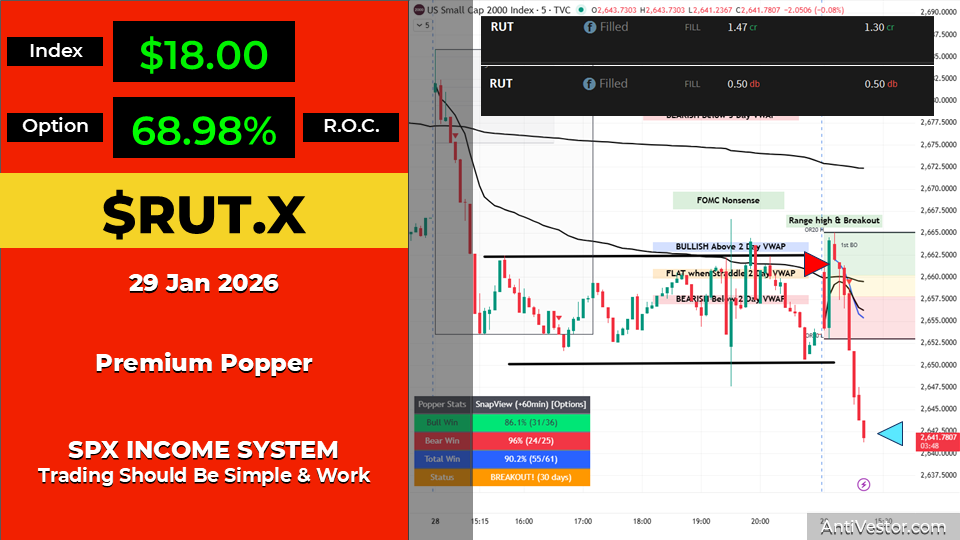
RUT Premium Popper #1: $18 index move. 68.98% ROC. Range high breakdown.
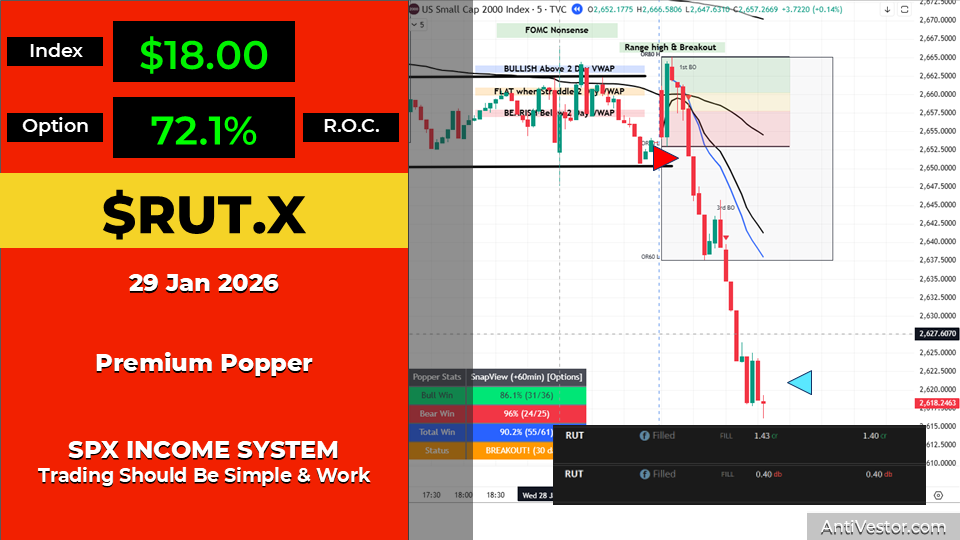
RUT Premium Popper #2: $18 index move. 72.1% ROC. Continuation move.
SPX TnT + BnB Overnight Swing: $90 index move. 90% ROC. The bearish setup we discussed – V-shaped entry at range highs – delivered beautifully.
The lesson: When you know where the range boundaries are, you don’t need to predict direction. You just need to be positioned correctly when price reaches them.
Pop Pop.
Expert Insights
The 100-Week Moving Average Significance
Bitcoin’s break of the 100-week moving average isn’t just another technical level – it’s historically been one of the most reliable long-term support indicators in crypto markets.
During the 2018-2019 bear market, the 100-week MA acted as the final capitulation support before the recovery began. In 2022, the break of this level preceded an additional 40% decline before the ultimate bottom.
The 100-week MA represents roughly two years of averaged price action. When it breaks, it signals that the accumulation thesis that built over that period is being invalidated.
Whether this break leads to further downside or becomes a false breakdown remains to be seen. But the level’s historical significance explains why ETF outflows accelerated immediately after the breach.
[Source: Bitcoin technical analysis – historical moving average studies]
In Other News…
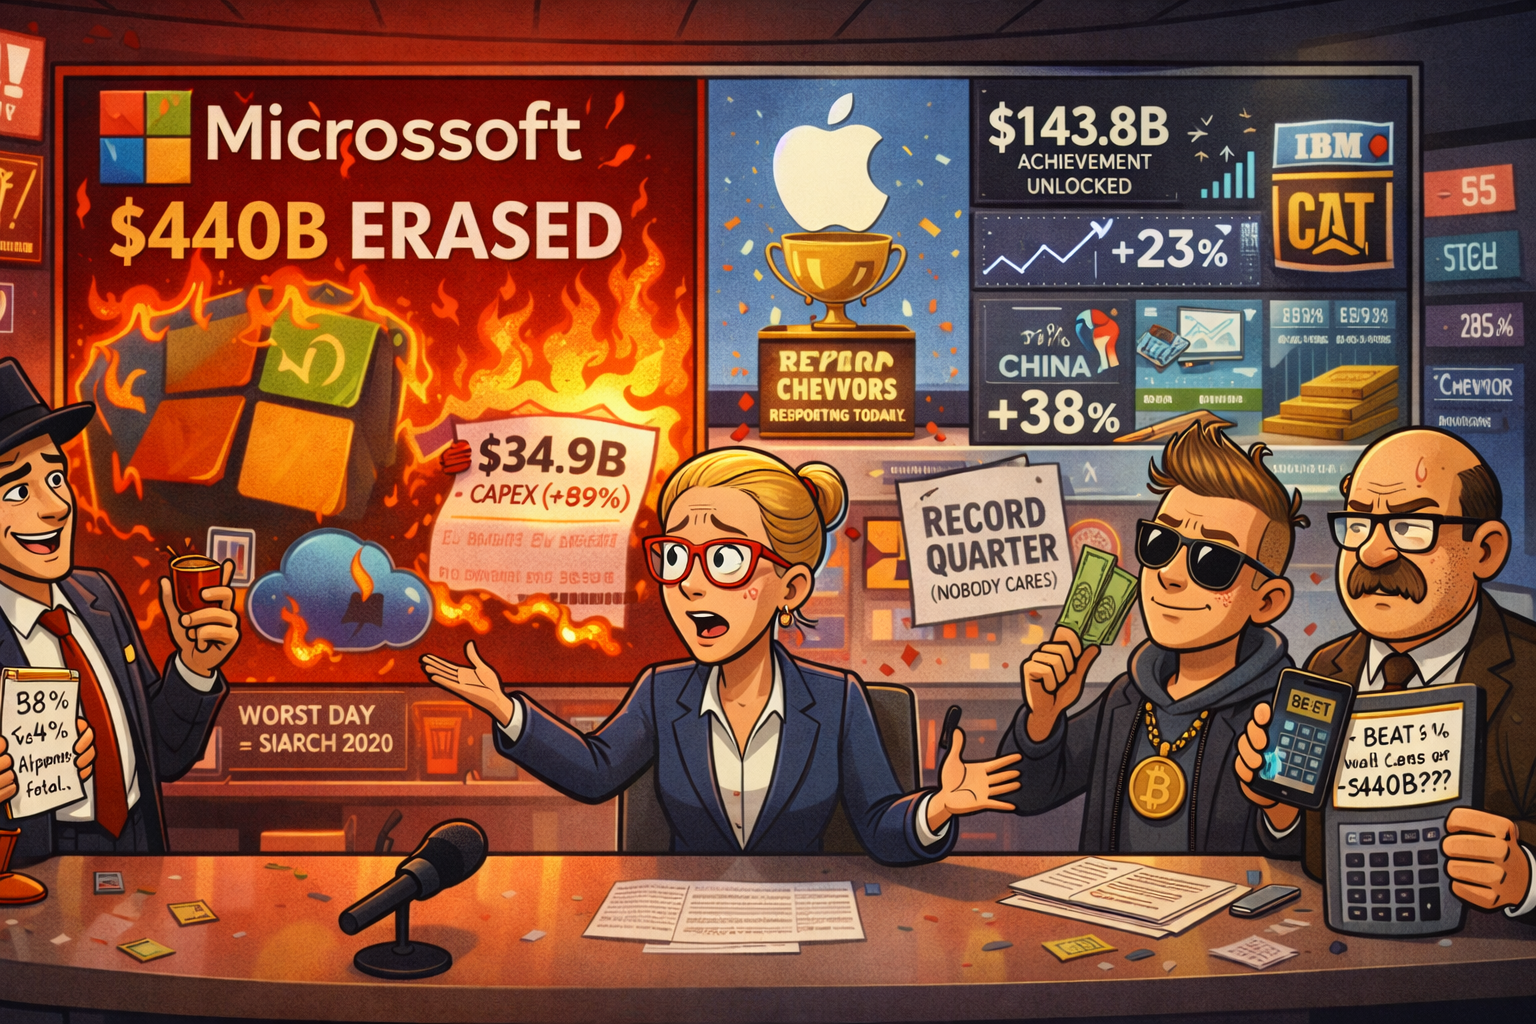
Microsoft Loses $440B Despite Beating Earnings; Apple’s Record Quarter Barely Noticed
38% Azure growth deemed catastrophic. $143.8B revenue gets footnote treatment.
Wall Street delivered its verdict Thursday: Microsoft’s worst day since March 2020 matters more than Apple’s best quarter ever. MSFT crashed 10%, erasing $440B in market cap, whilst Apple’s record $143.8B revenue and iPhone surging 23% became an afterthought. Priorities, clearly.
The $440 Billion Oops
Microsoft beat estimates—$4.14 versus $3.97 EPS—then lost nearly half a trillion dollars in value anyway. Azure grew 38%, which apparently constitutes failure when expectations demanded 40%. Capex of $34.9B (+89% YoY) raised “ROI concerns,” code for “we’re spending faster than investors can justify.”
The Record Nobody Celebrated
Apple delivered $143.8B revenue crushing the $137.4B estimate. iPhone +23%. China +38%. Services +14%. Supply constrained because demand is “staggering.” Stock gained 1.5% premarket—essentially a rounding error compared to Microsoft’s carnage. Record quarters now require context apparently.
Old Economy’s Quiet Takeover
IBM +7.3%, Caterpillar +4.2%, Southwest +6% on profit guidance. Things you can touch continue outperforming things that exist in clouds. Salesforce -6.6% and ServiceNow -11% caught Microsoft’s contagion. The flight-to-quality increasingly means “flight-to-physical.”
☕ Hazel’s Take
When beating earnings triggers the worst session in five years and record revenue barely registers, the market’s measuring stick has gone completely abstract. Gold retreated 4% but January’s still up 20%—even safe havens need a breather from this chaos.
—Hazel, FinNuts
Rumour Has It…
The Financial Nuts Newsroom is watching the ping pong match…
Percy is standing at a whiteboard drawing the range boundaries for the fifteenth time. “October. October! We’ve been trading this same range since October. And people keep acting surprised when it bounces.”
Hazel looks up from her screens. “Microsoft lost four hundred and forty billion dollars yesterday. Apple made records. Same sector. Same day. This market doesn’t make sense and I’ve stopped trying.”
Mac raises his glass to the Bitcoin chart. “Hundred-week moving average. Held for nine weeks. Then – snap. The bros are not having a good January.” He pauses. “Gold’s having a great January though.”
Kash is tallying yesterday’s trades. “Four wins. 63, 69, 72, 90. The range just keeps paying. Someone explain to me again why people try to predict direction?”
Wallie is watching the RUT chart intently. “Head and shoulders. We called it. It’s playing out. Sometimes the patterns actually work.” He sounds almost surprised.
The newsroom collectively agrees: sometimes the patterns actually work.
This is entirely made-up satire. Probably!
Breaking scoops courtesy of the Financial Nuts Newswire-because who needs sanity?
Fun Fact:
Microsoft’s $440B Loss in Historical Context
Microsoft’s 10% single-day decline wiped approximately $440 billion in market capitalisation – the third-largest single-day value destruction in stock market history.
For context:
- This exceeds the entire market cap of companies like Walmart, JPMorgan, or Visa
- It’s roughly equivalent to the GDP of Norway disappearing overnight
- Only Meta’s 2022 crash ($232B) and Apple’s 2022 decline ($182B) rival it in absolute terms, but Microsoft’s nominal loss is larger
The irony? Microsoft still beat earnings estimates. Revenue was $81.3B versus $80.2B expected. EPS was $4.14 versus $3.97. The stock crashed because Azure “only” grew 38% – below the whispered 40%+ expectations.
In 2026, beating estimates isn’t enough. You have to beat the whispers too.
[Source: Market capitalisation data, earnings reports]
Happy trading,
Phil
Less Brain, More Gain
…and may your trades be smoother than a cashmere codpiece
p.s. There are 3 ways I can help you…
- Option 1: The SPX Income System Book (Just $12)
A complete guide to the system.
Written to be clear, concise, and immediately actionable.
>> Get the Book Here

- Option 2: Full Course + Software Access – 50% off for Regular Readers – Save $998.50
Includes the video walkthroughs, tools for TradeStation & TradingView, and everything I use daily. Plus 7 additional strategies
>> Get DIY Training & Software

- Option 3: Join the Fast Forward Mentorship – 50% off for Regular Readers – Save $3,000
>> Join the Fast Forward Mentorship – trade live, twice a week, with me and the crew. PLUS Monthly on-demand 1-2-1’s
No fluff. Just profits, pulse bars, and patterns that actually work.