 Ahoy there Trader! ⚓️
It’s Phil…
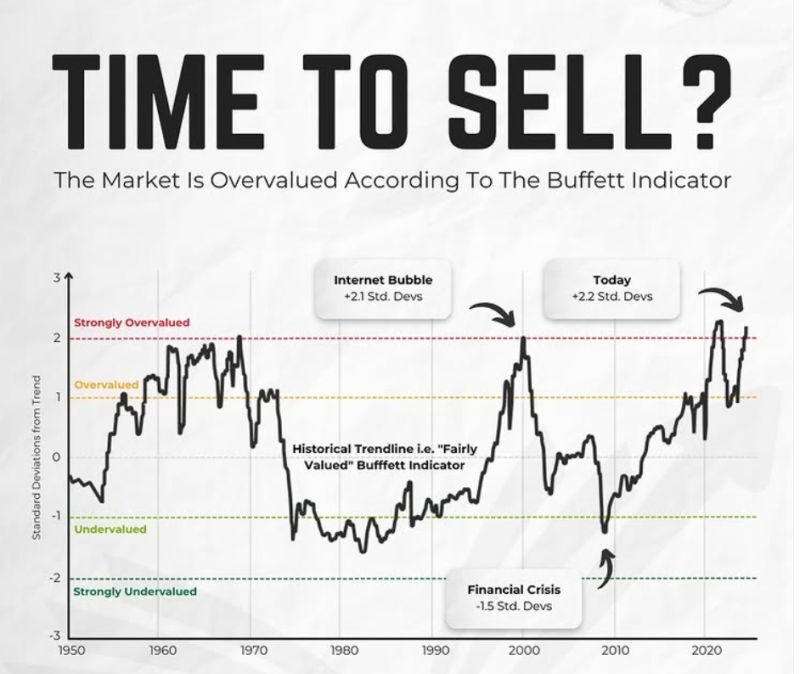
The market’s heartbeat may sound like a steady drum, but the Buffett Indicator is screaming overvaluation at 202.2%! Before you grab your parachute or double down, let’s unpack what this ratio reveals about the stock market and where it might be headed. Buckle up – it’s time to dive deep into Buffett’s crystal ball!

What Is the Buffett Indicator?
The Buffett Indicator, or Market Cap-to-GDP ratio, is a straightforward metric to assess market valuation. As proposed by Warren Buffett in 2001, it is calculated by dividing the Wilshire 5000 Index by the US GDP.
- Above 100%: Overvalued
- 62%-80%: Moderately undervalued
- Below 62%: Undervalued
Currently, it sits at 202.2%, far beyond historical norms.
Important Question: Are you ready to trade smarter?
When you’re ready – Dive Deeper Into a Profitable Rules Based Trading System
This Proven 3-Step “10 min/Day” 6-Figure Unconventional Recession Proof SPX Income System Unlocks $500-$5,000+ Days FAST! …
Why Is It Important?
The Buffett Indicator offers:
- Valuation Insights: A high ratio suggests overvaluation; a low ratio hints at undervaluation.
- Investment Guidance: Signals caution in frothy markets or opportunities in undervalued ones.
- Economic Perspective: Reflects economic health and investor sentiment trends.
- Historical Trends: Allows comparisons to long-term averages to identify anomalies.
Limitations to Consider
♨️ Despite its utility, the Buffett Indicator isn’t perfect:
- It overlooks profitability, focusing only on revenue.
- Market dynamics like globalization and low-interest rates distort historical comparisons.
Current Market Snapshot
- Market Cap: $59.4 trillion
- GDP Ratio: 202.2%—a level not seen since pre-dot-com bubble days.
- Outlook: Historical data suggests caution at these levels, but the modern economy has evolved, complicating direct comparisons.
For investors, the key takeaway is to use this indicator as part of a broader toolkit rather than a standalone decision-making tool.
Fun Fact
The Buffett Indicator’s Fame Rocketed Post-Dot-Com Crash
While proposed in 2001, the Buffett Indicator gained traction after the dot-com crash, proving its predictive power. Interestingly, Warren Buffett himself later said its usefulness could diminish as markets evolve.
The dot-com bubble of the late ’90s propelled the Buffett Indicator into financial stardom. As tech stocks ballooned, the market cap soared far above GDP, signalling overvaluation. Post-crash, investors turned to this ratio as a cautionary tale. Despite its predictive legacy, the modern economic landscape—marked by global markets and massive tech companies—poses challenges for its continued accuracy. Still, it remains a favourite among cautious investors.
Happy trading,
Phil
Less Brain More Gain
…and may your trades be smoother than a cashmere codpiece
