Bollinger Bands helps you find the best stocks to buy today, every day on demand.
Why?
…Why not.
Back when I had a real job (a little more than 20+ years ago as I type this) I remember having one of those epiphany moments whilst taking some time to read something trading related and I remember thinking;
This is nothing new
The truth is that there is not a lot that is new in trading/investing as well as most areas in life. Trading books mostly talk about what setup is the current flavour of the day and like most people I’ve traded a lot of those different ways over the years.
The single thing I learned was;
Everything works some of the time and nothing works all of the time
As soon as you realise that you will start to do better in your trading as there is no such thing as the holy grail in this or any other business.
When I had that epiphany, the big question I was left with was of not having learnt anything new;
How do I find those set ups that are described?
So, this article aims to answer that question from one perspective and remember there are lots and lots of ways to answer this question.
I will assume that you, the reader, will know something about charting and some of the tools and terminology as otherwise, this will be a monster to read (as well as write)
How to find hot stocks to trade every single day in under 20-mins per day
In other words how to find something to trade without spending hours and hours sitting in front of a computer without flicking through chart after chart after chart
The “Tag ‘n Turn Strategy (Simplified)
Bollinger Band Trading Strategy – Rule #1 – Do not look at every possible stock
I know, simple right?
I currently have around 371 stocks in my universe of stocks which makes things considerably easier to scan through.
Sidebar – Click here & Download my list of best stocks
If you want to create your own list, this is a simple process that I follow;
- Volume – 1 million shares traded on average over 3 months
- Stock Price – Greater than $30
- Optionable – Has options available to trade
- ATR – Greater than $1 averaged over 3 months
From that list, I then like to further filter
- Options volume – greater than 1,000 in 1-month average
- Bid-Ask spread – ideally less than 5c
- Is it a household name (subjective & optional)
Also, most software tools can do this really quickly these days in just a few clicks of the mouse to set things up. (Remember you can shoot me a private message and I’ll send you over my list)
So far this is pretty simple. Take a big list of stocks down to a small list of stocks. From that filter you should get less than 400 stocks and if you want to filter it further bump the average volume filter to 8 million shares traded.
A lot of the stocks just are not worth looking at anyway. Penny stocks, low volume, low liquidity not optionable. All those factors make is less or more difficult to trade, so let’s make it easy for ourselves before we do anything.
At this point, I’m not going to explain why because it is not necessary at this stage.
Bollinger Band Trading Strategy – Rule #2 – Find something that is worth trading today
Another simple rule that is intended to help you not look at things that are not worth your time looking at.
I’ve got other things I want to be doing with my day and I am certain that you have other things to be doing as well.
I spent 12 years day trading and looking at charts, after that length of time is not fun. Let’s make good use of less time than bad use or more time
What we are going to do then is;
- – Which stocks are worth looking at today
- – What stock is hot to trade today?
- – What stock is smokin’ hot to trade now?
This process is going to be broken down into 3 components. The what we are doing are the questions above but the how to answer those questions goes a little something like this;
- – Find a statistical price extreme
- – Find price at a logical stopping point
- – Find a sign of exhaustion
Sidebar – I do have several methods for scanning and filtering stocks this is just one of them. This is also the fastest and the one that I use every single day. It is not a perfect method but this does allow me to spend less than an hour at the desk “trading”.
Point number 1 above is the secret sauce as it’s going to allow me to take that list of 350 stocks and turn it into 8-10 stocks.
Point number 2 then filters further and will turn that list into 4-6 stocks
Point number 3 will make those stocks a today trade or a comeback tomorrow trade
How to Find a Statistical Price Extreme – Creating a daily watchlist
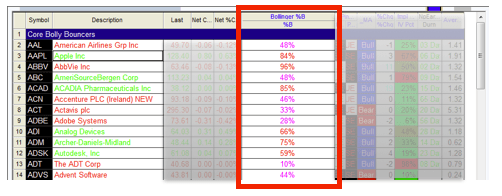
To do this I’m using a tool called Bollinger Bands or rather a variation of the tool called Bollinger Percentage B. This tool compares the current price with its location between the upper and lower Bollinger Band expressing this as a percentage.
For example, If the upper band represents 100 and the lower band represents 0 and the current price is exactly in the middle between the upper and lower bands – then this would give a reading of 50%
This is important because it means that the tool can now be placed into a table or a watch list (which most software has as a common feature) that can then be easily sorted.

![]()
If I were looking at the charts I would have to assess the chart visually and determine this, then move on.
Now that the watch list is being used I can simply move on without needing to look at the chart at all.
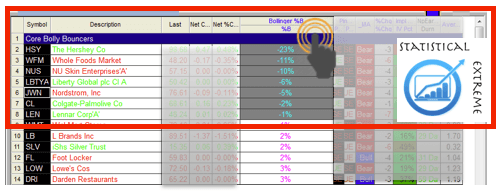
What can now be done next is a simple sorting because it is also not needed to look down the whole list of the stock universe that is being used as that is also not necessary.
With one click I can sort the list (just like in spreadsheet software), sorting from high to low or from low to high.
In this example sorting from low to high puts the stocks at the lower band at the top of my list.

![]()
This now simple process means scanning through, in my case, 350 stock charts every day (this is the size of my current universe) and I do not waste my time doing so.
Pulling up a small list of stocks to investigate further ensures that your time is being used most effectively.
How to find a logical stopping point – Make the now small list smaller
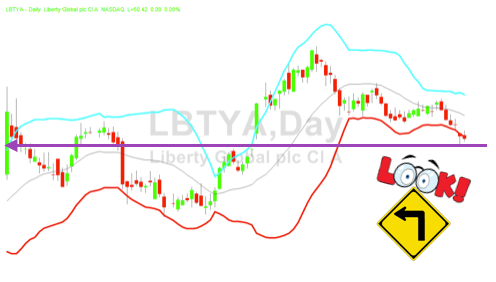
This is simply a place on the chart where the price of a stock has stopped or paused for a while before moving onwards or retreating back the way it came.
The reasoning is that if the stock price has stopped there previously then there might be an increased expectation that prices could do something interesting again at that level.

Looking left on the chart in this example you can clearly see that price has stopped there several times in the past so it might be a fair assumption that price could well stop here again at the very least temporarily.
This Bollinger Band Strategy is all that is needed to profit. A “home run” is not needed to make good money consistently.
Bollinger Band Trading Strategy – Rule #3 – NOW – Do it right NOW! – Sign of exhaustion
This is an indication that the current move is over at least for the time being.
If you are already familiar with the many different candlestick patterns you might recognise some of the more familiar names of patterns, such as hammers or dojis or shooting stars.
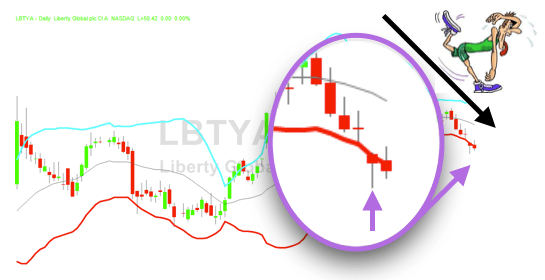
I generically call these “spikes” or “wicks”.
The spikes or big wicks on candles typically show that price has moved in one direction and then has moved in the other direction.
Depending on the magnitude of these turnarounds “spikes” are most often classed as rejections, bounces, reversals and a host of other names to express the same event.
The smart trader is not interested in what it is called. The smart trader just wants to know “how it can be traded?”

![]()
That is, as they say, is that.
Step 1 – Statistical Extreme – using Bollinger bands
Step 2 – Logical Stopping Point
Step 3 – Sign of Exhaustion
Three simple steps Ready – Aim – Fire
Targeting is dynamic and I typically look for a reversion back to the mean which is the midpoint of the Bollinger band in this situation
There are many different ways to enter and manage positions simply choose one that you are happy with and familiar with.
These days I prefer stock options because I think this is the best way to utilise the resources that I have available to me.
There are also a dozen different ways you can do step #2 and filter the 350 stock list and I use several different methods. I can put 2-3 opportunities in front of me right now so I do not have to sift sort and scan charts all day long.
If you want to use a different tool, go for it.
