War and Financial Markets: Historical Patterns (1900–2025)
 Ahoy there, Trader! ⚓️
It’s Phil…
War is one of the most severe geopolitical shocks, and its impact on financial markets has varied across history. This research explores how major conflicts from 1900 to the present have affected stock indexes, commodities like oil and gold, and currencies (USD, GBP, EUR) in both the short term and long term. By examining past war-market cycles, we can glean insights into what might happen amid a new Iran–Israel conflict.
Stock Markets and War: Short-Term Shocks vs. Long-Term Resilience
Markets typically react negatively in the immediate onset of conflict due to surging uncertainty. Initially, investors tend to sell risk assets and seek safety. For example, at the outbreak of World War I (1914), U.S. stocks plunged about 30%, and the New York Stock Exchange actually shut down for six months. Yet when trading resumed, a powerful rebound ensued – the Dow Jones Industrial Average surged ~88% in 1915.
A similar pattern appeared in World War II: after Germany invaded Poland in 1939 (starting WWII), the U.S. market surprisingly rose ~10%, and even the shock of Pearl Harbor in 1941 only knocked the Dow -2.9% before it recovered those losses within a month. In fact, from the war’s start in 1939 to its end in 1945, the Dow gained roughly 50% (about 7% annually).
As one analyst noted, during the two worst wars of the 20th century, U.S. stocks still rose a combined 115%, illustrating that long-term market trends can remain surprisingly resilient despite wartime turmoil.

That said, not every conflict is shrugged off quickly. The market impact often depends on war duration, scope, and economic spillovers. Short, decisive conflicts or limited regional clashes have tended to see brief volatility followed by quick recoveries. For instance, the First Gulf War (1990–91) initially shocked markets – the Dow fell over 6% right after Iraq invaded Kuwai – but when the U.S.-led coalition launched Operation Desert Storm in January 1991, confidence returned. Stocks rallied ~17% in the first four weeks of the offensive as it became clear the war would be won quickly.
Similarly, the 2003 Iraq War saw oil prices and uncertainty rise in the run-up (the S&P 500 fell ~11% in the months before the invasion while oil jumped ~40% from late 2002 to early 2003). Yet once the U.S. “shock and awe” campaign began in March 2003 and Baghdad fell swiftly, the market’s worst fears eased – oil prices actually plunged ~33% and the S&P rebounded ~3.7% within days of the attack’s start.
In these cases, once the conflict’s outcome seemed assured, equities rallied as the cloud of uncertainty lifted.
By contrast, protracted or economically disruptive wars have caused deeper and longer downturns. A prime example is the 1973 Arab–Israeli War (Yom Kippur War). In response to U.S. aid to Israel, oil-producing Arab nations imposed an embargo that nearly quadrupled oil prices from about $3 to $12 per barrel. The resulting energy crisis helped tip the world into recession.
The U.S. stock market entered a severe bear market – the Dow Jones index sank roughly 43% over 1973–74. as inflation surged and economic output stalled. Another instance is the 1979 Iranian Revolution and subsequent Iran–Iraq War, which again disrupted oil supply and drove prices sharply higher, contributing to global stagflation. These episodes show that when wars trigger major economic shocks (like an oil supply crunch), stocks can suffer significant short-term losses and a slower recovery.
Despite these shocks, the overall historical trend shows surprising endurance of equities through wartime, especially for markets not physically devastated by the war. In the U.S. context, wars have often boosted certain economic activity (e.g. industrial production for military needs), and markets tend to shake off initial downturns once the conflict’s scope is understood. For example, even though World War I and II were enormously destructive globally, U.S. domestic industries expanded, and stock indexes climbed over the full course of those wars.
More recently, many geopolitical flare-ups have had muted market impact. LPL Financial researchers note that U.S. stocks have “largely shrugged off” past conflicts, with little material effect on long-run corporate profits. As former LPL strategist John Lynch said during the 2020 Iran–U.S. standoff, historically “stocks have weathered heightened geopolitical tensions,” so selling equities on war fears often proved a mistake.
Indeed, in the 21st century, even severe events have seen markets rebound within weeks: after the Russia–Ukraine invasion in February 2022, the S&P 500 plunged more than 7% in the days immediately following the attack, but one month later it had fully recovered to trade above pre-invasion levels. Likewise, when war erupted between Israel and Hamas in October 2023, the S&P 500 briefly sank on the next trading day but then rose over the following week, erasing the initial drop.
Such cases illustrate that modern investors, having seen recoveries from shocks like 9/11 and the 2008 crisis, are often conditioned “not to overreact” to geopolitical events – especially if they believe central banks stand ready to stabilize markets.
Key takeaway: In the short term, war news usually sparks volatility – stocks sell off as conflict begins, and defensive sectors outperform while riskier sectors lag. But if the conflict remains limited or is resolved quickly, markets often rebound to pre-war levels within days or weeks. Over the long term, major indices have continued to rise through most wars, barring extreme economic dislocation.
However, conflicts that entail broad economic consequences (energy crises, sharply higher inflation, etc.) can coincide with bear markets and recessions, as seen in the 1970s. Overall, history shows a “war puzzle”: initial conflict fear tends to hurt stocks, but once the outcome or extent of war is clearer, markets often stabilize or even rally, sometimes benefiting from wartime fiscal stimulus and technological innovation.
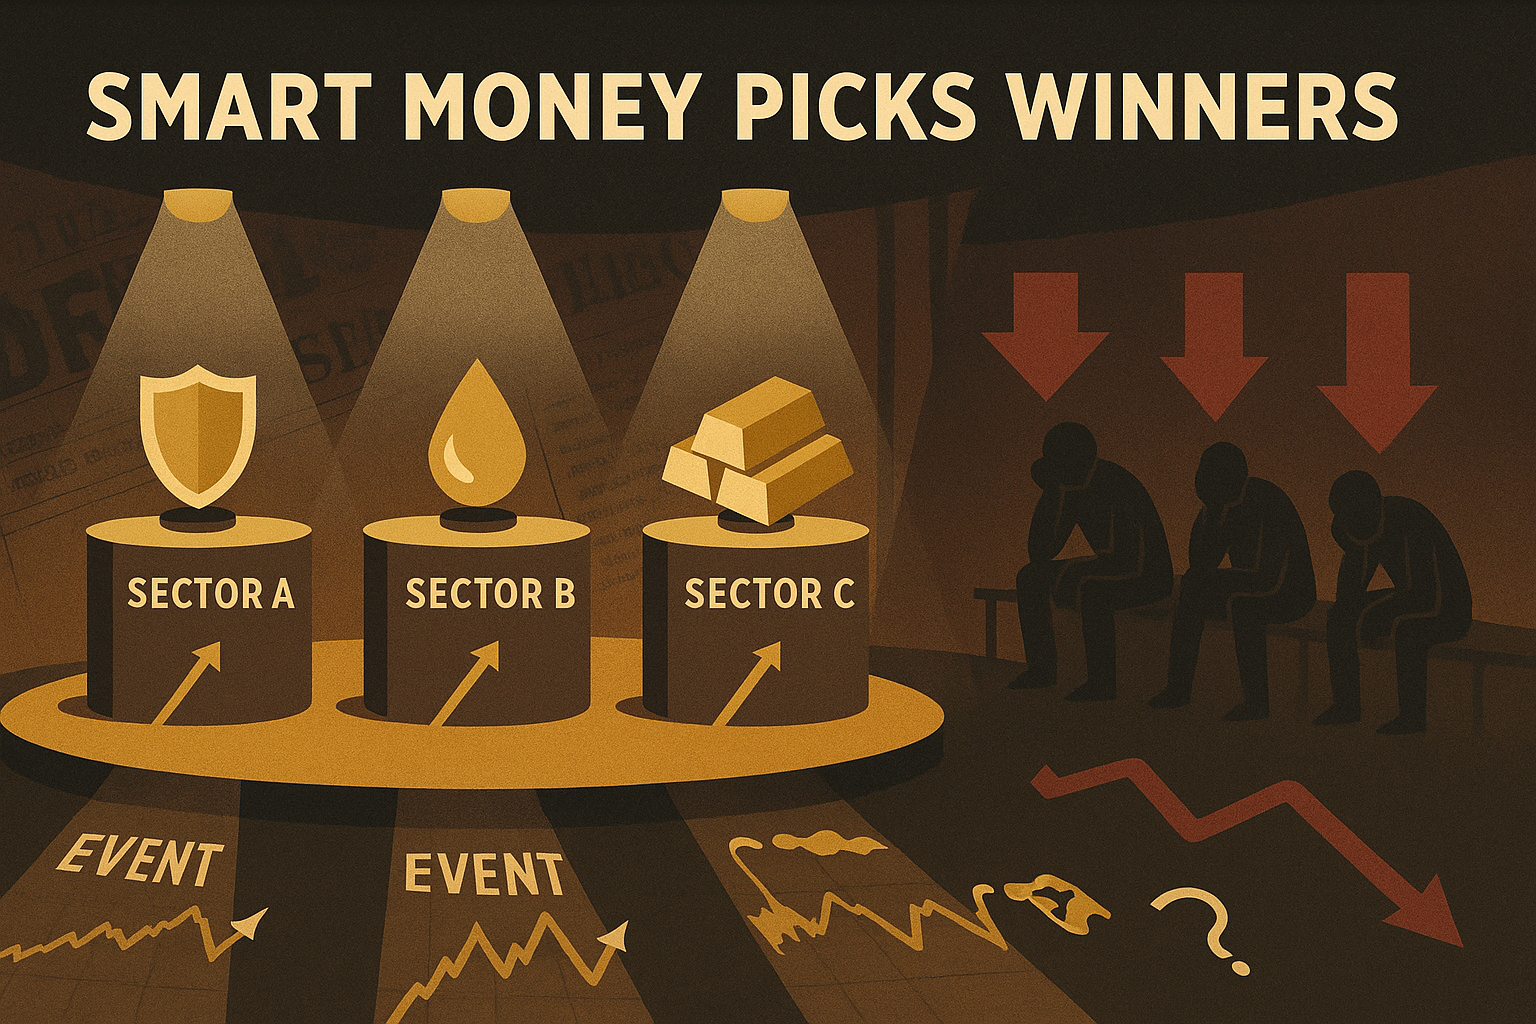
Sector Winners and Losers During Conflict
Not all stocks react the same to war. Sector performance can diverge greatly depending on how a conflict reshapes economic demand. Typically, defense and arms manufacturers see increased demand and tend to outperform during wartime. For example, companies producing weapons, military technology, or equipment often rally as defense spending rises. Similarly, energy stocks may climb if war drives oil or gas prices up, boosting profits for oil producers.
This was evident in early 2020 when U.S.–Iran tensions spiked: on the day after a U.S. drone strike killed Iranian General Qasem Soleimani, energy sector stocks outperformed the broad market (anticipating higher oil prices), even as the overall S&P 500 was flat and safe-haven assets jumped. In contrast, sectors that are cost-sensitive to commodities or travel often lag during conflicts.
For instance, airlines usually suffer when oil prices surge (fuel costs), and indeed U.S. airline stocks fell in January 2020 on fears of pricier jet fuel and security risks.
Consumer travel and tourism-related industries can also decline if geopolitical risk deters travel. In extreme cases, if a war disrupts trade routes or supply chains, industries reliant on those may underperform.
Historical analysis further reveals some surprises. A detailed review of World War II showed that the very top-performing U.S. industries during 1941–45 were not only defense or heavy manufacturing, but also areas like printing & publishing, alcohol, and personal services – sectors one might not intuitively associate with war booms. Meanwhile, industries one would expect to thrive (steel, chemicals, aircraft production) did fine but not spectacularly, possibly due to price controls or overcapacity. The lesson is that market dynamics can defy expectations.
Investors often “price in” obvious winners (like defense) quickly, while some less-obvious sectors quietly benefit (for example, entertainment or vices can see higher demand as the populace copes with wartime life). Still, as a rule of thumb, “guns and oil” tend to shine in war, while sectors hit by rising input costs or uncertainty (e.g. discretionary consumer goods, transportation) may stumble.
Besides equities, government bonds deserve note: typically, bond prices rise (yields fall) in the immediate flight-to-safety when conflict erupts. Investors seek the relative safety of government debt, expecting central banks to support economies in crisis. During World War II, U.S. bonds delivered positive nominal returns as well (though after inflation, only corporate bonds kept real gains).
However, if wars lead to heavy government borrowing and inflation, bond investors eventually demand higher yields. For example, massive war spending in the 1940s and 1960s contributed to higher inflation, eroding bond values in real terms. Thus, short-term: bonds = safe haven, long-term: war financing can hurt bondholders via inflation or default risk (especially for the losing side’s bonds, which can become worthless).
Commodities in Conflict: Oil and Gold
War often sends commodity markets into turmoil. Oil is the most geopolitically sensitive commodity, and its price tends to spike when conflicts threaten supply. The Middle East – being a critical oil-producing region – has been the focal point of war-related oil shocks. During the 1973 Yom Kippur War, Arab OPEC nations embargoed oil exports to the U.S. and others, causing an unprecedented supply squeeze.
Oil prices skyrocketed from under $3 to around $12 per barrel within months (a nearly 4× increase).This 1973–74 oil shock reverberated globally: fuel shortages, surging inflation, and a collapse in consumer confidence. Likewise, the 1979 Iranian Revolution and ensuing Iran–Iraq War took millions of barrels off the market, roughly doubling oil prices by 1980 and worsening the late-70s “stagflation” environment.
More recently, the 1990 Gulf War saw crude oil jump from the low $20s to over $40/barrel in the months after Iraq invaded Kuwait, as traders feared damage to oilfields and a potential Saudi supply threat. (Oil peaked just before the U.S.-led offensive; once Operation Desert Storm began and succeeded swiftly, oil plunged ~33% in price within two weeks, as the worst-case supply disruption fears faded.)
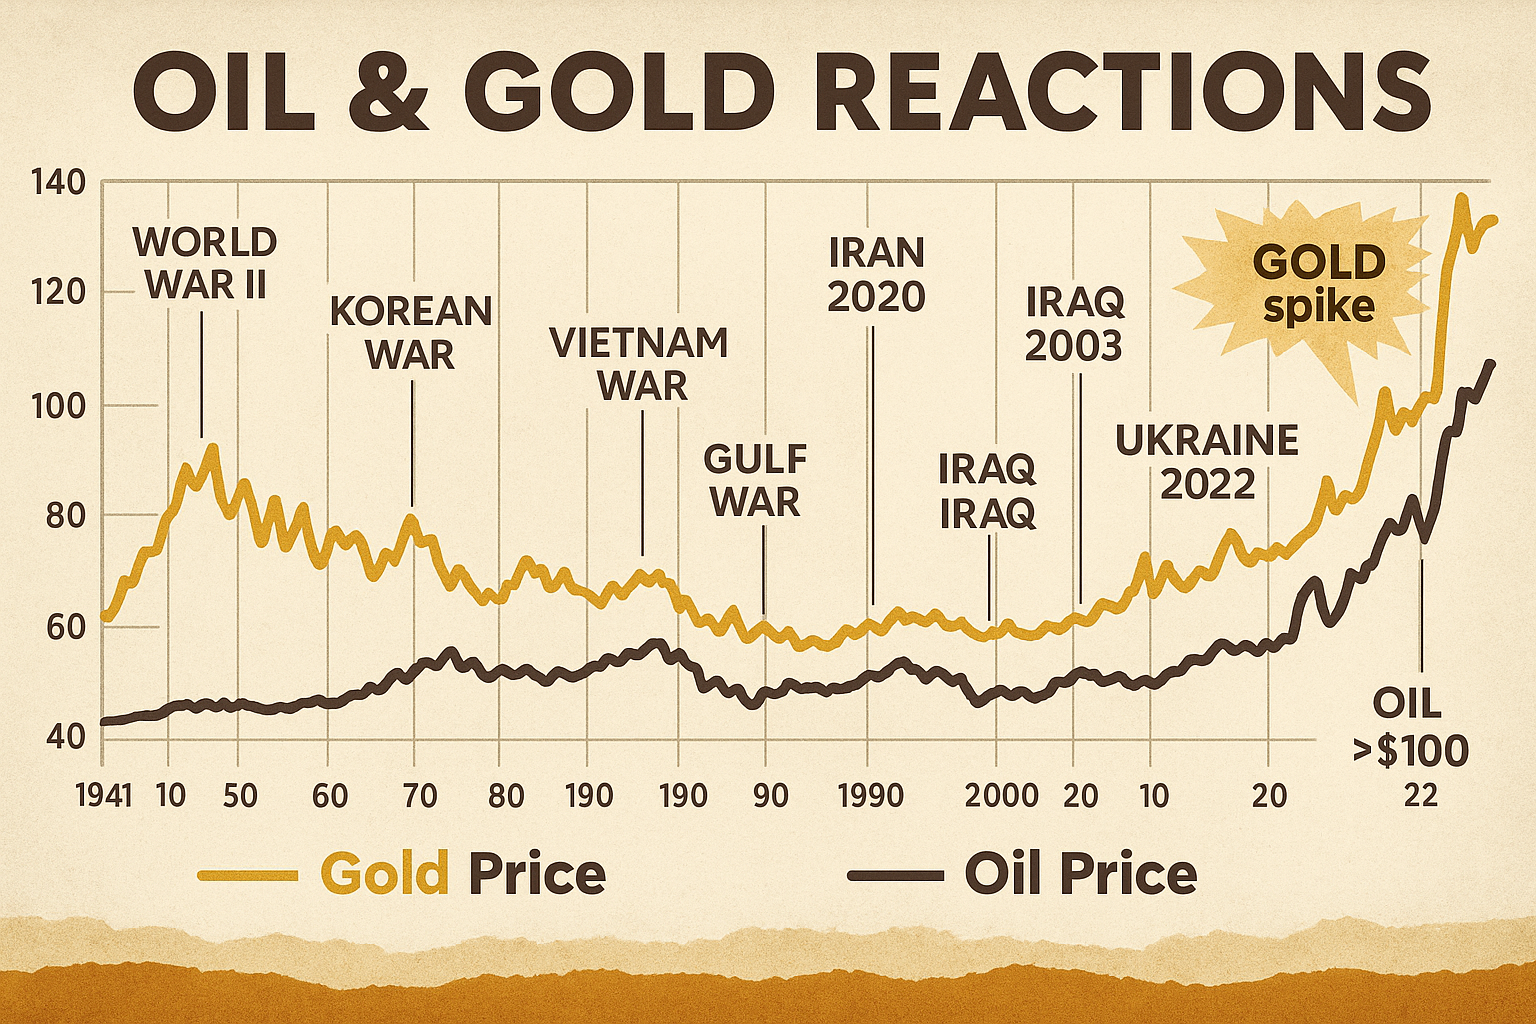
The general pattern is: pre-war and early-war = oil price up, often driven by panic and speculative hoarding; if conflict is resolved or contained = oil price down as supply fears ease. For example, in late 2002 ahead of the Iraq invasion, oil prices climbed sharply with war looming, but after the U.S. invasion in 2003 went faster than expected, oil gave up much of its “war premium”.
Similarly, when Russia launched a full-scale war on Ukraine in 2022, oil prices immediately surged (Brent crude briefly over $100, the highest in years) because Russia is a top oil/gas exporter and Ukraine a transit route. However, within months, markets adjusted to new trade flows and prices retreated from their highs. It’s worth noting that oil’s impact extends beyond energy companies – expensive oil acts like a tax on consumers and industry, often fueling inflation and hurting growth.
Countries heavily dependent on oil imports (e.g. much of Europe, China, India) may face economic stress when oil soars due to war. In contrast, oil-exporting nations (or sectors like U.S. shale producers) can benefit financially.
Gold is the classic “safe-haven” asset, and its behavior in wartime is typically the mirror image of stocks. When conflict risk flares, investors often flock to gold seeking a store of value that will hold its worth if currencies or economies falter. For instance, during the January 2020 Iran crisis, gold spiked to its highest price in nearly 7 years as missiles flew and fears of a broader war gripped headlines.
Similarly, in early 2022, as Russia massed troops near Ukraine and then invaded, gold rallied to multi-month highs, reflecting the demand for protection against geopolitical chaos. Throughout history, periods of major war or instability (World War I, World War II, the 1970s oil crisis, etc.) have seen gold prices strengthen. In the 1970s, for example, gold was de-linked from the dollar and promptly shot up from $35/oz to over $400/oz by 1980 amid inflation and conflict-driven uncertainty.
Gold’s wartime role is also evident in central bank behavior: countries in crisis often hoard gold or face currency devaluation, making gold more valuable. That said, gold can retreat once acute crises abate. If a war ends quickly or panic subsides, some of the safe-haven demand diminishes. For instance, after the rapid victory in the 1991 Gulf War, gold’s price gains were pared as investors rotated back to riskier assets.
Still, the net effect of wars is usually to push gold higher, especially if the war introduces economic risks (inflation, debt, etc.) that undermine fiat currencies. Gold and oil can also move in tandem during conflict if war-related inflation or commodity scarcity drives both up. Investors often watch the gold/oil ratio and other barometers to gauge how much of the commodity spike is pure fear versus fundamentals.
In summary, commodities respond very sensitively in the short run: war fears inflate oil and gold prices, sometimes violently, as seen by oil’s multi-hundred-percent jumps in the 1970s. If the conflict expands or drags on, high commodity prices can persist and bleed into higher inflation globally. Conversely, a contained conflict or quick resolution may see commodity prices mean-revert.
Given this dynamic, wartime markets can create opportunities in commodities – e.g. traders who anticipate a conflict may go long oil or gold, then reverse once peace prospects improve. However, timing is tricky: commodity spikes often peak around the onset of hostilities and then deflate if the worst outcomes are avoided. The Iran–Israel region is especially critical for oil, so any new conflict there warrants close attention to energy markets.
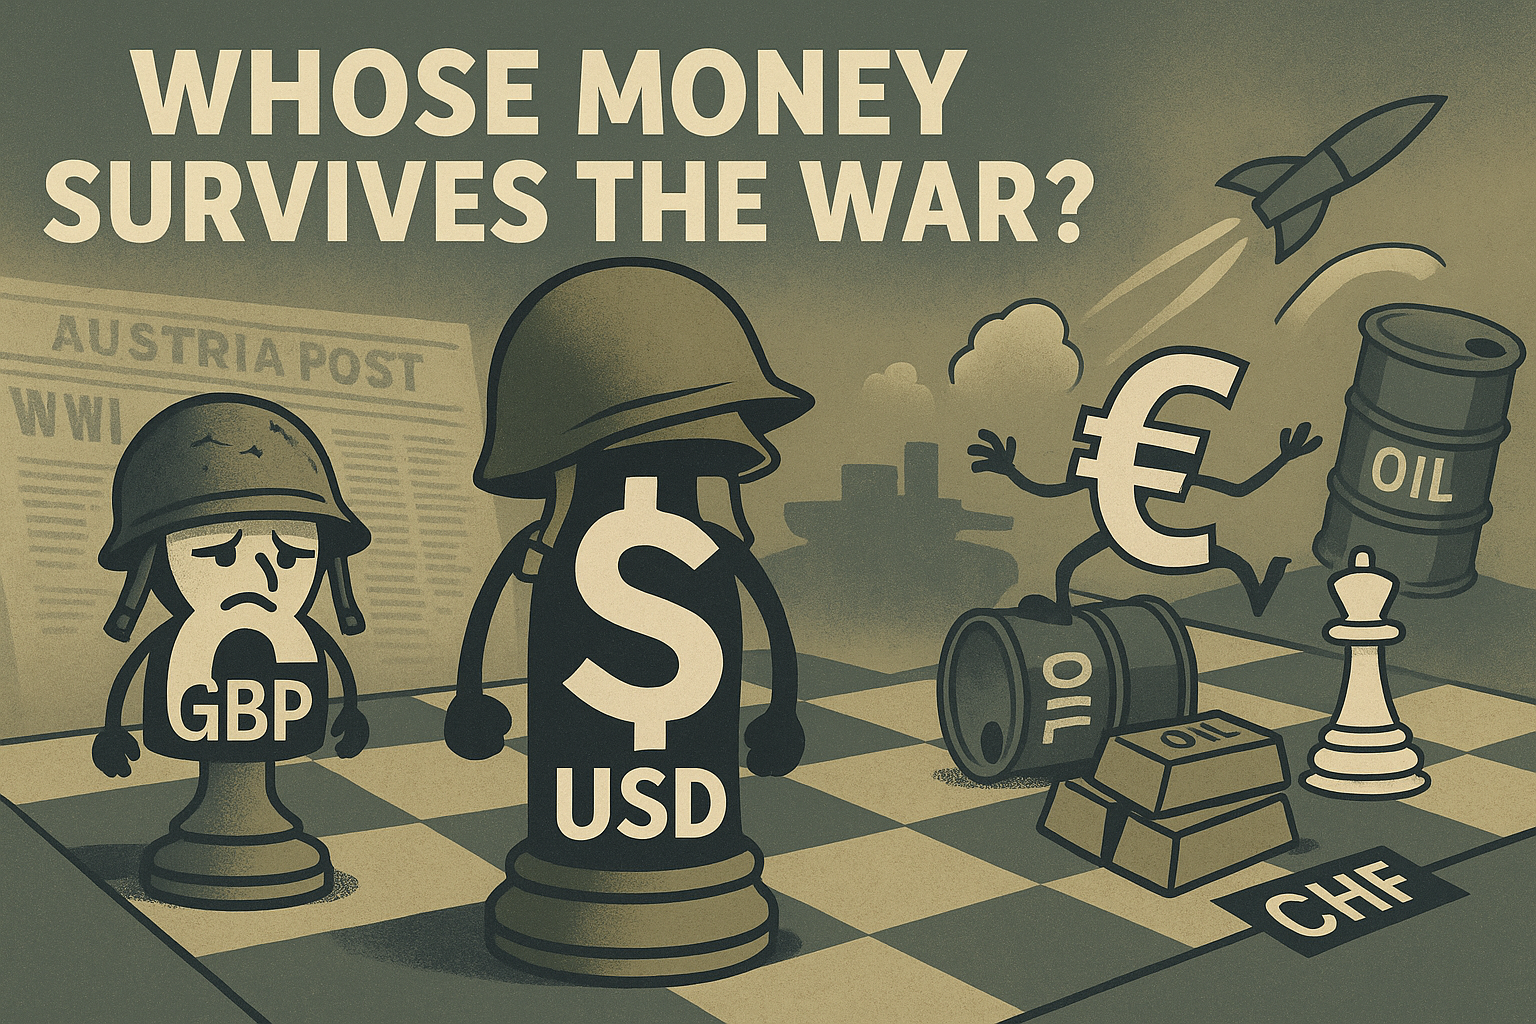
Currency Impacts: USD, GBP, and EUR in Wartime
Currencies experience cross-currents during wars, driven by safe-haven flows, interest rate changes, and the war’s economic fallout. The U.S. dollar (USD) is often considered a safe-haven currency (alongside the Swiss franc and Japanese yen). In many conflicts – especially in recent decades – global investors have bought dollars and dollar-denominated assets (Treasuries) as a refuge.
This demand can cause the USD to strengthen in the lead-up to and early phase of a war. For example, during spikes in Middle East tensions, the dollar often ticks up against other currencies as traders seek the liquidity and perceived safety of USD assets. In January 2020, amid U.S.–Iran clashes, the USD jumped to a one-week high vs. the euro, and the Swiss franc (CHF) hit multi-month highs, reflecting a rush into safe havens on war fears.
Likewise, the 2022 Ukraine war saw the dollar index surge (the euro and British pound weakened) as the Fed also began raising rates, making USD assets more attractive. By mid-2022 the euro fell to parity with the dollar for the first time in 20 years, “battered by… the Ukraine war” and Europe’s energy crisis, while the U.S. dollar benefited from heightened global uncertainty.
However, the USD’s war role is somewhat paradoxical. Research indicates that while the dollar often appreciates before or at war onset (due to short-term safe-haven demand), prolonged conflict can erode the dollar’s value as initial flows reverse. In other words, investors park money in U.S. assets when conflict is brewing, but once open war erupts (especially if the U.S. is a combatant incurring costs), those short-term flows may dissipate or go into other assets like gold.
Historically, major wars have sometimes led to USD weakness in the long run because of huge U.S. fiscal deficits and inflation. During the Vietnam War era and the 1970s, for instance, extensive war spending (and loose monetary policy) contributed to the devaluation of the dollar in the early ’70s and the end of the gold standard.
Similarly, the 2000s wars were accompanied by twin deficits and a multi-year decline of the dollar’s value against currencies like the euro (though other factors like interest rates were also at play). Thus, time horizon matters: in the immediate crisis the USD tends to strengthen, but over a sustained war the dollar’s fundamentals can deteriorate if debt and inflation mount.
The British pound (GBP) offers a historical case study of war’s toll on a currency’s standing. In the early 20th century, before WWI, the pound sterling was the world’s premier currency, valued at about $4.86 per £1 under the gold standard. World War I and World War II, however, strained Britain’s finances enormously, forcing the UK off the gold standard and reducing global confidence in the pound. By the early 1920s after WWI, the pound’s value had fallen to roughly $3.40. Britain returned to a gold peg briefly, but during WWII the pound was again devalued – in 1939, with wartime borrowing surging, it was pegged at $4.03 to stabilize the economy.
After WWII, under the 1944 Bretton Woods agreement, the pound was devalued further to $2.80 by 1949. In sum, two world wars cut the pound’s value in half against the dollar, cementing the USD as the new dominant currency. This highlights that wars can accelerate shifts in currency hegemony: the UK expended a huge portion of national wealth in the wars, weakening the pound, while the U.S. economy emerged stronger, bolstering the dollar.
In more recent conflicts, the pound typically behaves as a risk currency (more like the euro) – it may weaken versus the dollar during global crises, though not as severely as in the 1940s. For example, in 2022, GBP fell alongside the euro as investors flocked to dollars amid the Ukraine conflict and global rate hikes. Overall, the pound’s wartime history teaches that a country fighting expensive wars on its home turf (or losing its great-power status) can see a long-term currency decline.
The euro (EUR), introduced in 1999, has a shorter history but is now a major reserve currency. The euro’s response to conflict tends to reflect Europe’s proximity or exposure to the crisis. When wars or threats emerge in Europe’s neighborhood, the euro often weakens due to economic risk and the eurozone’s dependence on imported energy.
The clearest case is again the Russia–Ukraine war: Europe faced surging gas prices and recession fears, leading the euro to sink below $1.00 in mid-2022 for the first time in two decades. Investors preferred the U.S. dollar and Swiss franc while Europe’s outlook darkened. On the other hand, if a conflict is distant from Europe (or if European economies benefit from post-war reconstruction), the euro could be more stable.
Generally, in global risk-off events the euro and pound fall relative to the dollar, since USD and CHF are seen as safer havens. It’s also worth noting that Switzerland’s franc often surges against the euro during European crises (as noted in early 2022 when EUR/CHF hit its strongest level since 2015). The Japanese yen (not requested by the user but historically relevant) is another safe haven that often rises during geopolitical crises – although in the Ukraine war, the yen initially weakened due to divergent monetary policy, bucking its usual trend.
In summary, wartime currency movements can be summarized as follows:
(1) Safe-haven flows usually strengthen currencies like the USD (and CHF, JPY) at the outbreak of conflict
(2) Currencies of countries near the conflict or heavily impacted (EUR in a European war, or currencies of emerging markets in turmoil) tend to depreciate as capital seeks safer shores.
(3) In the longer run, the cost of war can undermine a currency – high military spending and debt, potential money-printing or economic damage can lead to post-war devaluation (as seen with GBP losing its pre-eminence after the World Wars). And
(4) if a war causes a terms-of-trade shock (e.g. oil import costs spike), currencies of importing countries often fall (their purchasing power deteriorates), whereas those of commodity-exporters might rise. Thus, for USD/GBP/EUR, a conflict’s impact will depend on each region’s role: the dollar often benefits in the crisis phase, the euro and pound may fall on economic concerns, but if the U.S. is deeply involved and spending heavily, the dollar’s strength could wane in a drawn-out conflict.
Looking Ahead: Implications for a Potential Iran–Israel Conflict
With tensions rising between Iran and Israel, it is natural to ask what historical patterns suggest for markets if a new conflict erupts in the Middle East. Every war is unique, but past cycles provide a framework:
-
Initial Reaction – Volatility and Safe Havens: We can expect a knee-jerk risk-off move if open conflict breaks out. Stock indexes (especially outside the immediate region) might sell off sharply at first, as we saw with other surprise conflicts. Investors would likely pile into gold and safe-haven currencies (USD, CHF, possibly JPY) for protection. Recent history shows these dips can be short-lived if the war’s scope remains limited. For instance, markets barely blinked after the 2020 Iran incident and the 2023 Gaza conflict, quickly finding footing.
However, Iran and Israel directly clashing could be a larger regional shock. Oil prices would almost certainly spike given Iran’s key role in OPEC and the risk of supply disruptions (e.g. closure of the Strait of Hormuz through which ~20% of global oil passes). A broader Middle East war has been cited as a scenario that would “have a more severe impact, especially on oil and other commodity prices,” compared to the minor market reactions from isolated skirmishes. In short, the immediate phase would likely see stocks down, oil and gold up, dollar up.
-
Short-to-Mid Term – Differentiation and Policy Response: If the conflict is contained (e.g. a few weeks of strikes without drawing in other major powers), markets may stabilize relatively quickly. As history shows, once the “new normal” of a conflict is understood, investors often buy the dip and equities recover if the broader economic fallout seems manageable.Sector rotations would occur: defense stocks could rally on expectations of arms demand, energy stocks would climb with oil prices, and industries like airlines or tourism could face declines. Central banks might respond as well – for example, if oil-driven inflation surges, policymakers face a dilemma.
During the 1990 Gulf War, the Federal Reserve cut interest rates to cushion the economy, prioritizing growth over inflation in the face of a war-induced recession. In the current context, however, inflation is already a concern (as of mid-2025), so central banks (Fed, ECB, BoE) might tread carefully. Nonetheless, if financial conditions tightened sharply due to war, authorities could inject liquidity or pause rate hikes, which might support bond and stock markets. Investors will watch for any diplomatic resolutions or escalations – peace overtures would buoy risk assets, whereas escalation (e.g. other nations joining the fray) would exacerbate the risk-off mood.
-
Longer Term – Economic Consequences: A significant Iran–Israel war could have long-run implications, especially through the energy and security channels. If oil prices remain elevated for months or years, the world could see higher inflation and slower growth – a stagflationary scenario reminiscent of the 1970s oil shocks. This would be a headwind for equities (as consumer spending and corporate profits get squeezed), and it could pressure central banks to hike rates, hurting bonds. On the other hand, wartime expenditures in areas like defense, cybersecurity, and infrastructure could stimulate certain economies.
Countries not directly affected by fighting might even see wartime fiscal stimulus boost their industries (as the U.S. did in WWII). Currencies may adjust: a sustained oil shock tends to hurt oil-importing economies’ currencies (EUR, GBP, among others) and could strengthen petrocurrencies (if conflict doesn’t spread to those producers). The U.S. dollar might initially rise on safe-haven demand, but if the conflict drags and global investors worry about U.S. exposure or deficits (for example, if the U.S. increases military involvement or aid), the dollar could peak and then drift lower. Gold would likely hold its gains as long as uncertainty persists, serving as an inflation hedge and crisis hedge.
In essence, if the Iran–Israel conflict remains localized and short, the historical pattern suggests financial markets might react similarly to recent regional flare-ups – a brief jolt followed by a return to underlying trends. Global indexes could end up “shrugging it off” in a matter of weeks, as they have with other Middle East tensions. However, if the conflict escalates into a broader regional war, the impact could be far less benign.
Investors would recall how wars that involve major oil producers or multiple great powers (1970s, 1990) led to commodity price spikes, recessionary forces, and more prolonged market declines. Preparedness is key: diversification and focusing on quality assets is often advised. As one expert noted, markets have been conditioned to expect limited fallout, but “this is not an unreasonable short-term conclusion… one subject to considerable uncertainty” – meaning that while hope for a quick resolution is fine, prudent investors should also plan for worst-case scenarios when war risk looms.
SPX Options = Cashflow Engine.
With this setup? It’s practically an ATM with a checklist.
Conclusion
War has a profound but complex influence on markets. Short-term panic is common when conflict breaks out: stocks fall, volatility jumps, and money flows into safe havens like gold, U.S. Treasuries, and safe-haven currencies. Yet time and again, markets have demonstrated resilience once the initial shock passes or the conflict’s trajectory becomes clearer. Over the past century-plus (1900–2025), many of the worst wars did not prevent stock indexes from ultimately rising – in some cases, war even coincided with market gains as economies mobilized and adapted.
However, the severity of economic disruption is a crucial factor: wars that disrupt oil and trade or stoke inflation (1917, 1973, 2022, etc.) have had broader and more lasting market impact than those with limited economic spillover.
For commodities and currencies, war can rapidly reprice fundamentals: oil is the “ace” that can transmit conflict risk to every corner of the world via inflation, and currencies will revalue depending on who is seen as safer or more exposed. The U.S. dollar remains the world’s haven and tends to benefit in crises, though long wars can test America’s economic strength.
The British pound and Euro tend to struggle when war rattles the global economy or Europe directly, as investors pivot to USD or CHF. And gold glitters in the darkness of uncertainty, providing insurance against worst-case outcomes.
Applying these lessons to a potential Iran–Israel conflict: investors should brace for an initial storm in markets but remember the past cycles – initial fear often gives way to recovery if a broader conflagration is averted.
At the same time, they should monitor commodities and inflation expectations closely; a significant oil shock could change the game and herald a more challenging environment like the 1970s. In any event, history urges caution but not despair: from the trenches of World War I to the missile strikes of 2023, markets have eventually found their footing.
Understanding the historical war-market patterns can help in navigating whatever comes next, balancing the short-term opportunities (or risks) in sectors and assets with the longer-term trajectory that, so far, has bent towards growth even after the gravest of global conflicts.
Sources:
-
Investopedia – How War Affects the Modern Stock Market (D. D’Souza, 2023) – investopedia.com
-
Washington Post – Wall Street shrugging off Iran mayhem (T. Newmyer, Jan 2020) – washingtonpost.com
-
Federal Reserve History – Oil Shock of 1973–74 (M. Corbett) – federalreservehistory.org
-
Asia Times – How stock markets react to conflicts, wars (Jan 2020) – asiatimes.com
-
CurrencyTransfer – History of the GBP/USD exchange rate (C. Hinton, 2023) – currencytransfer.com
-
The Guardian/Reuters – Euro dips below parity on war fears (Jul 2022) – theguardian.com
Happy trading,
Phil
Less Brain, More Gain
…and may your trades be smoother than a cashmere codpiece
p.s. There are 3 ways I can help you…
- Option 1: The SPX Income System Book (Just $12)
A complete guide to the system.
Written to be clear, concise, and immediately actionable.
>> Get the Book Here
- Option 2: Full Course + Software Access – 50% off for Regular Readers – Save $998.50
Includes the video walkthroughs, tools for TradeStation & TradingView, and everything I use daily. Plus 7 additional strategies
>> Get DIY Training & Software
- Option 3: Join the Fast Forward Mentorship – 50% off for Regular Readers – Save $3,000
>> Join the Fast Forward Mentorship – trade live, twice a week, with me and the crew. PLUS Monthly on-demand 1-2-1’s
No fluff. Just profits, pulse bars, and patterns that actually work.