Decode the Conflicts. Exploit the Gaps. Trade What Others Miss.
 Ahoy there, Trader! ⚓️
It’s Phil…
✍️Chapter 1: SPX vs ES Futures
WHEN CASH PANICS BUT FUTURES DON’T BLINK
“If SPX prints a new low but futures hold the line – that’s not a glitch. That’s a clue.”
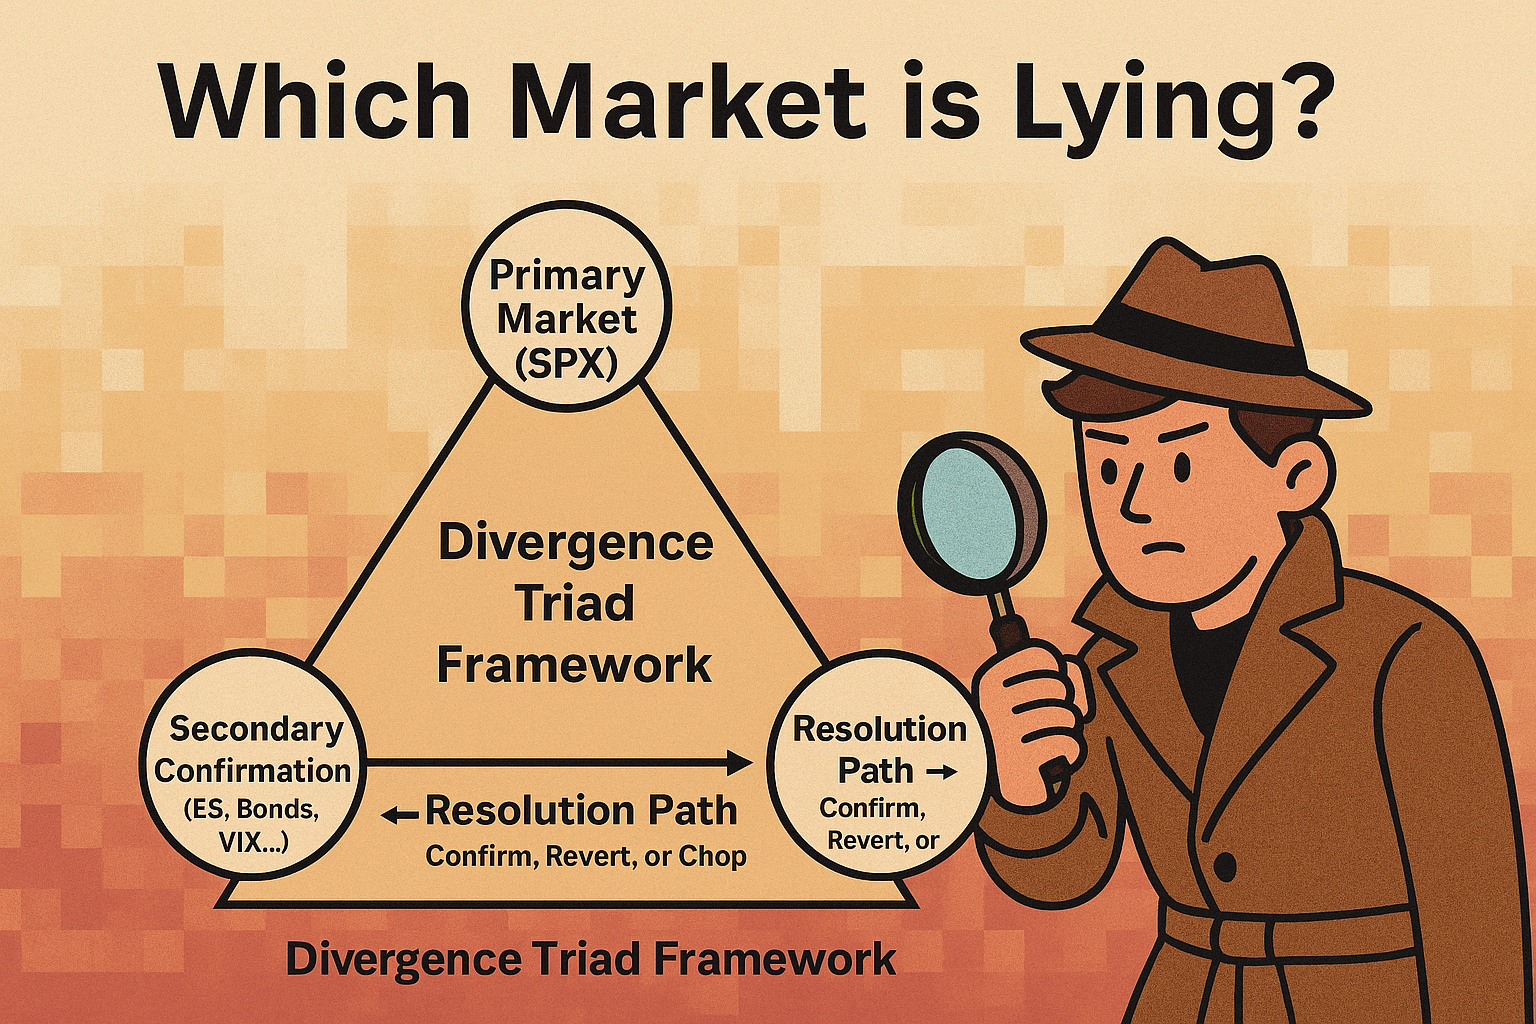
Welcome to the most overlooked divergence in all of index trading: the SPX cash vs ES futures conflict. It’s not rare. It’s not random. And it’s absolutely tradable – if you know how to decode it.
This chapter unpacks:
- Structural differences between SPX and ES
- Why these differences create tradable dislocations
- Real-world divergence patterns (with chart examples)
- Institutional interpretations and execution filters
- Mechanical rules for trading this edge
- Modeling it as a rules-based income play
This isn’t “spot divergence and hope.” This is about turning market misalignment into strategic advantage.
1. STRUCTURAL EXPLAINER: WHY SPX ≠ ES (AND NEVER HAS)
Let’s start with the core mismatch:
- SPX (cash) trades only during regular trading hours (RTH), 9:30am-4:00pm ET
- ES (futures) trades 23 hours/day via Globex, only pausing briefly
This creates temporal and behavioral gaps:
- ES reflects global macro, overnight sentiment, hedging
- SPX reflects domestic ETF flows, structured product hedging, and panicky retail reactions
Result: Divergences occur – especially in these windows:
- Overnight macro shocks
- Friday close → Sunday Globex → Monday open
- Pre-market traps before NYSE open
- Post-OPEX gamma resets
Institutional Edge: Many desks actually expect SPX to “play catch-up” to ES during volatile periods. It’s not an anomaly – it’s order flow lag.

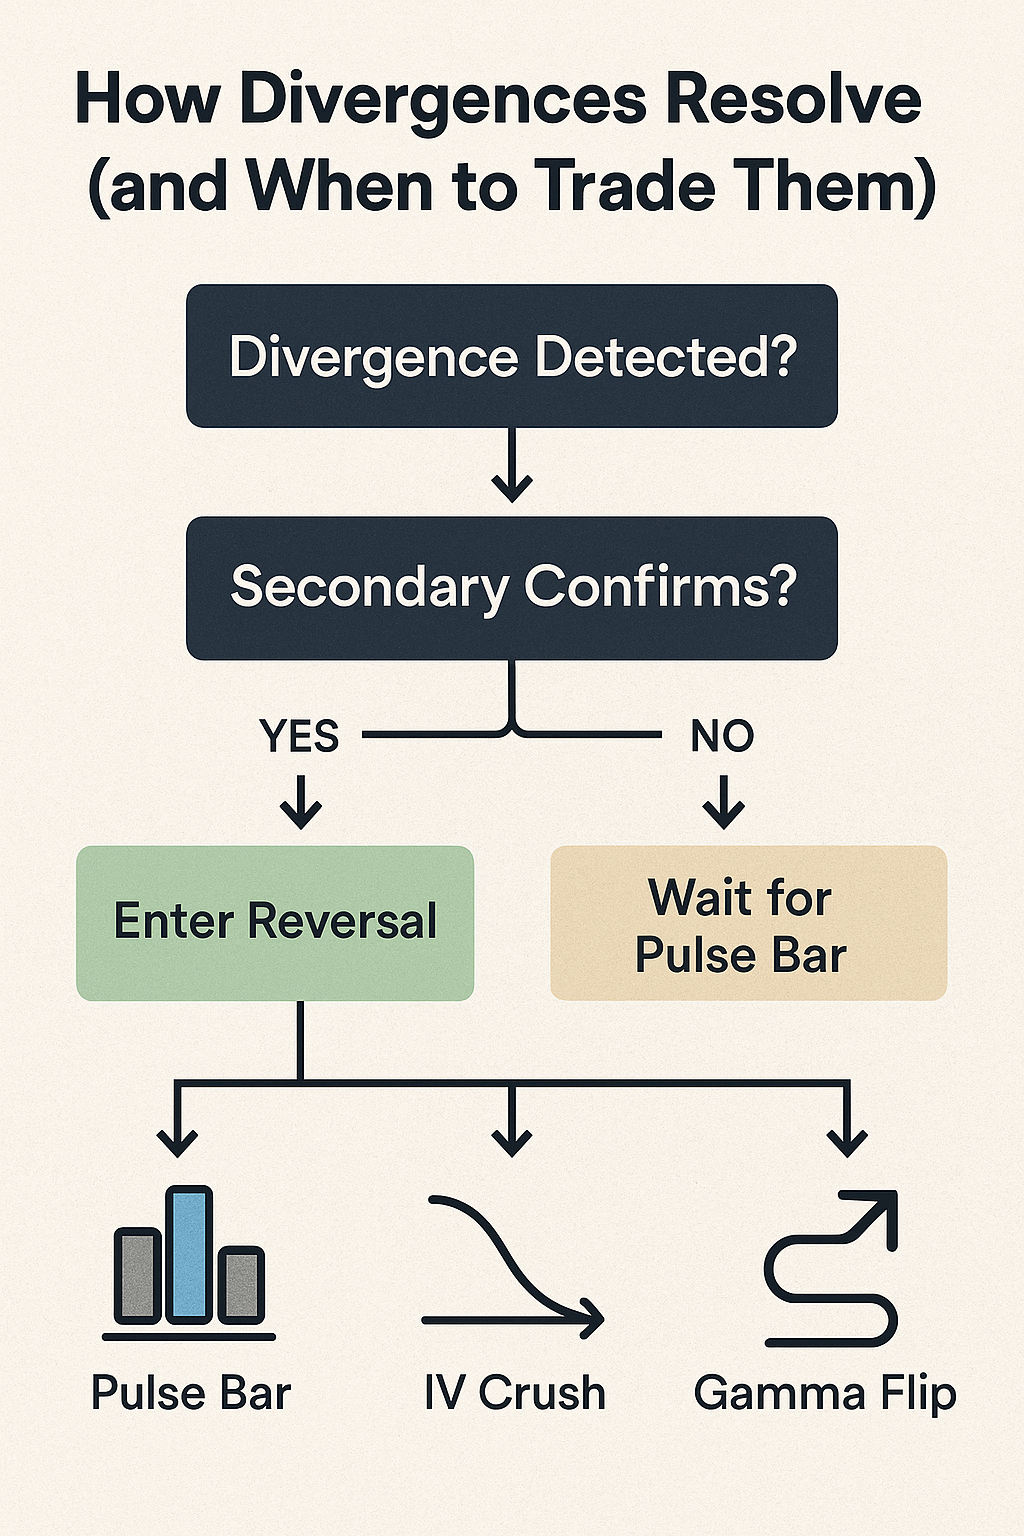
2. CASH FAKEOUT SETUP: THE FAILED BREAKDOWN
Here’s the core pattern:
- SPX opens and flushes to a new low (retail panic, ETF imbalance, gamma trap)
- ES holds its Globex or prior day low (buyers already stepped in)
- VIX stalls or even drops
- SPX reclaims breakdown zone within 2-3 bars
This is not a coincidence – it’s absorption in futures showing up before cash catches on.
Why this matters: Dealers may be hedging gamma or macro funds absorbing fear – and the cash flush is late, reactive flow.
Key triggers:
- Pulse bar close back above reclaim level
- VIX divergence (lower high or failure to spike)
- Put IV stalling or collapsing intraday
3. CHARTED EXAMPLES OF THIS EDGE
️ March 14, 2022
- CPI fear overnight
- ES holds double bottom ~4195 during Globex
- SPX flushes on open below 4200 → immediately reclaims → +50pt intraday rally
️ October 13, 2023
- CPI day again
- Hot print → SPX sells off hard on open
- ES never broke Globex support
- VIX failed to confirm
- SPX closed +2% higher on the day
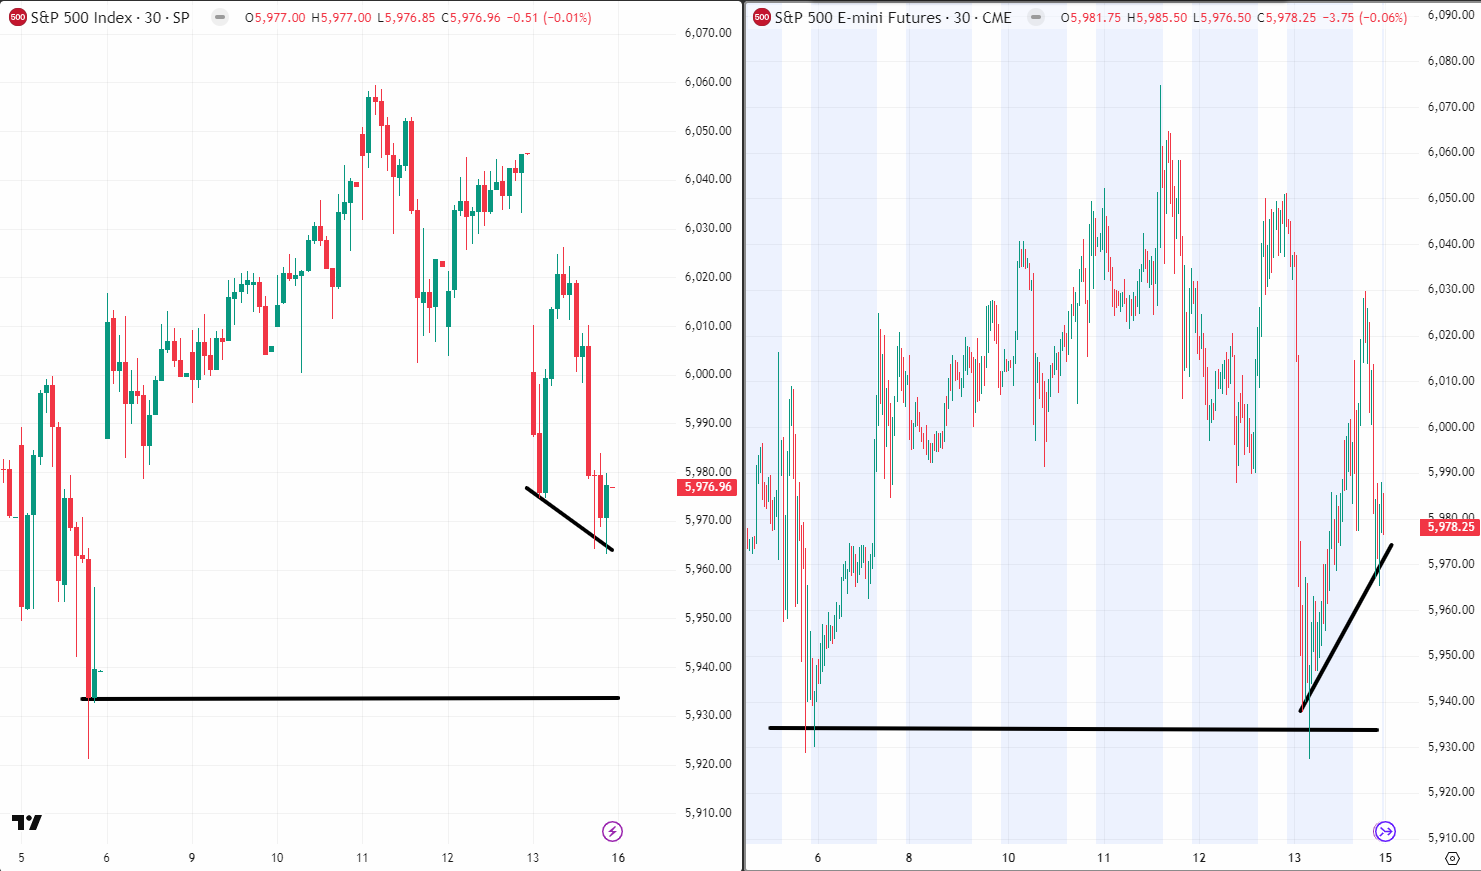
️ June 14, 2025
- SPX made lower low intraday
- ES futures held a higher low
- SPX reclaimed zone midday
- Bullish pulse bar → strong upside follow-through
4. HOW INSTITUTIONAL DESKS TRADE THIS
- Macro desks compare Globex structure to SPX open
- Execution teams check for reclaim signals and volatility non-confirmation
- Volatility desks monitor skew flattening and IV crush
From a JPM execution note:
“We fade SPX weakness at the open when ES support structure holds and vol markets don’t confirm. Especially on macro prints.”
They layer this into multi-asset overlays, and often act before the cash chart ever reclaims.
5. MECHANICAL SYSTEM RULESET
Here’s how to codify the setup:
Conditions:
- SPX makes a lower low intraday (vs prior day/session)
- ES futures hold a higher low (Globex or full session)
- SPX reclaims the breakdown zone
- Pulse bar closes above reclaim zone
Entry: Reclaim + pulse bar close
Exit: 1.5-2R target or resistance zone
Stop: Under SPX session low
Bonus Layers:
- VIX flat or down
- Put IV stalling intraday
- Skew flattening
- Gamma exposure flips positive
6. MODELING & BACKTESTING
To test this:
- Use TradingView or Sierra with SPX & ES overlaid
- Tag: SPX LL + ES HL + reclaim bar
- Track:
- Reclaim bar frequency
- Avg return after signal
- Win rate when pulse bar aligns with IV drop
Also consider adding:
- Bollinger Band tag-and-turn confirmation
- Pulse Bar overlays
- Gamma exposure heatmap
7. COMMON MISTAKES TO AVOID
- Trading before SPX reclaims the breakdown
- Ignoring macro days (FOMC, CPI)
- Treating divergence as a reversal in all conditions
- Not layering intermarket confirmations (VIX, skew, IV)
8. FURTHER READING + VALIDATION SOURCES
- Ruggiero – Intermarket Systems with Bonds & Equities
- CME Group – SPX vs ES Divergence in News Volatility
- SentimenTrader – Failed Breakdown Setups in SPX
- Bloomberg Terminal – Divergence Overlays (SPX/ES/VIX)
- OptionMetrics – Skew Compression During SPX Fakeouts
Chapter 2: SPX vs Bonds
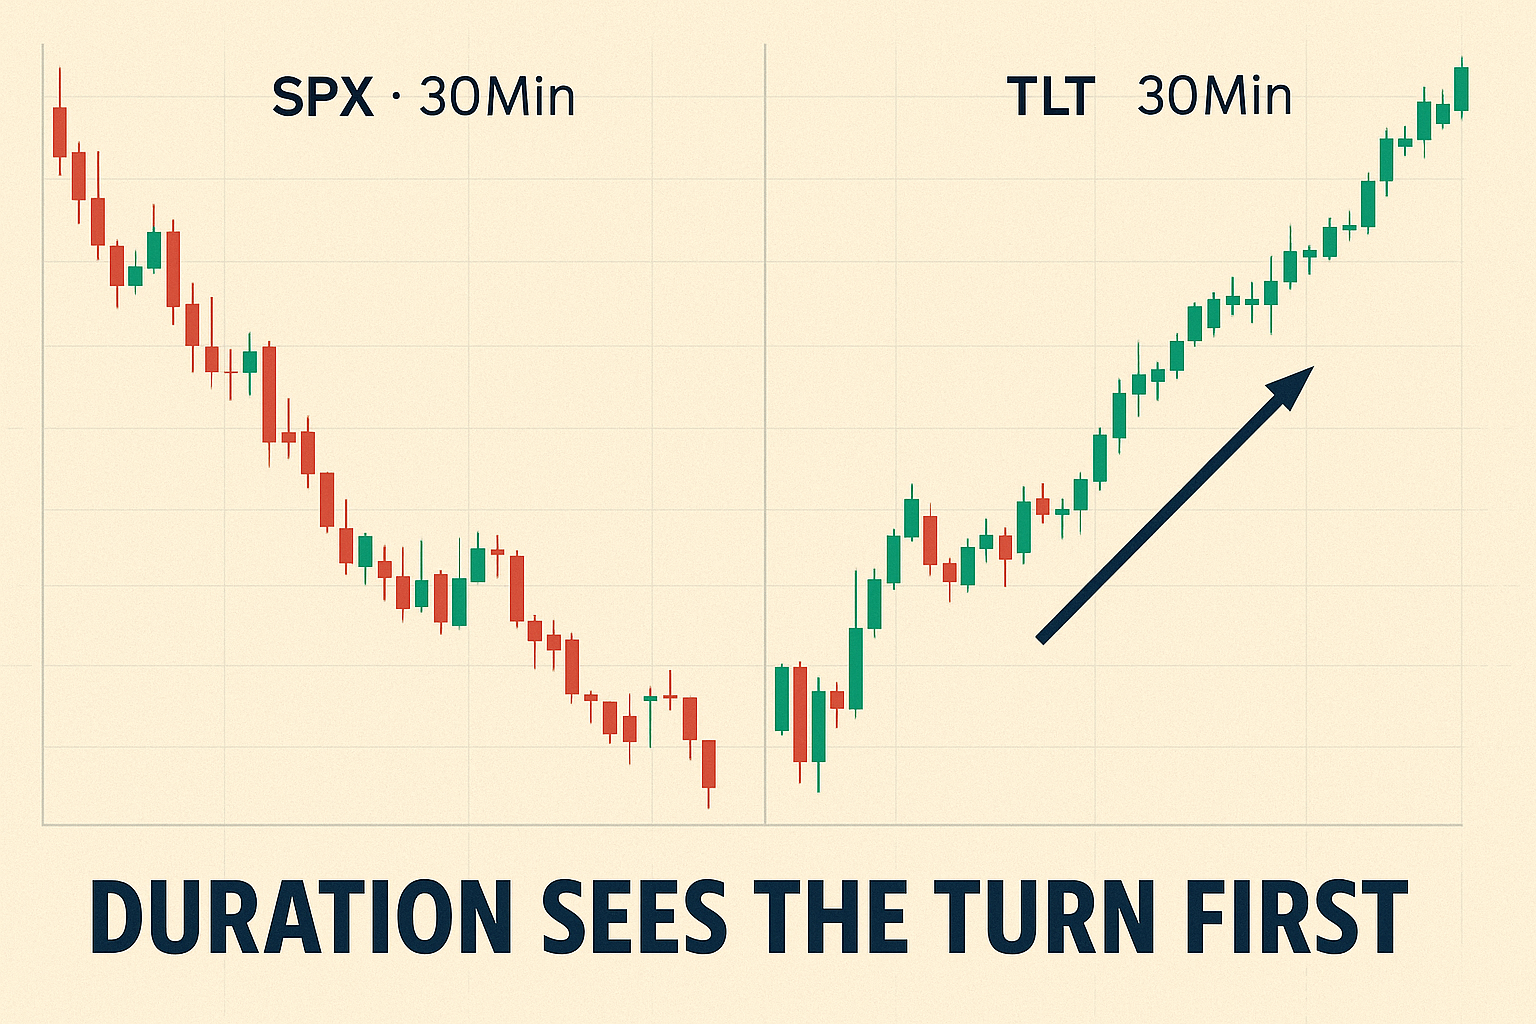
WHEN DURATION SEES THE PANIC BEFORE PRICE DOES
“Bonds don’t lie. At worst, they whisper. And when they diverge from equities – you better listen.”
In this chapter, we turn to one of the oldest and most respected intermarket signals: the divergence between stocks and bonds. Specifically, when SPX moves one way and TLT or ZB moves the other, something under the surface is shifting.
This isn’t your average RSI divergence. This is capital rotating, macro narratives colliding, and risk being repriced. And if you can read the bond market – or at least recognize when it stops agreeing with equities – you’ll see the cracks form before the floor gives way.
This chapter breaks down:
- Why the stock-bond relationship is foundational
- When its divergence becomes tradable
- Historical examples where bonds led SPX
- System triggers for confirmation
- How macro desks and volatility traders use this daily
1. WHY STOCKS & BONDS ARE LINKED – UNTIL THEY’RE NOT
Under normal conditions:
- Rising bonds (falling yields) = flight to safety
- Falling bonds (rising yields) = growth optimism or inflation fears
But this relationship breaks when:
- Equities ignore bond market warnings (e.g., rising yields with falling stocks)
- Bonds rally while SPX makes new lows → signal of macro bottoming
In short: bonds are the canary. SPX is the crowd.
2. THE MACRO INFLECTION MODEL
The most reliable divergence setup:
- SPX makes a lower low (or false breakdown)
- TLT/ZB prints a higher low or begins trending upward
- VIX does not confirm new equity lows
When all three align – bonds are absorbing risk, not pricing more of it. That’s your edge.
This tends to happen:
- At macro inflection points (FOMC pivots, inflation peaks)
- Into systemic crises (credit stress, liquidity crunch)
- During volatility expansions that reverse
Why this matters:
- Macro funds often rotate capital via duration first
- The bond market is less susceptible to short-term headlines
- CTA models rebalance based on volatility and rate projections
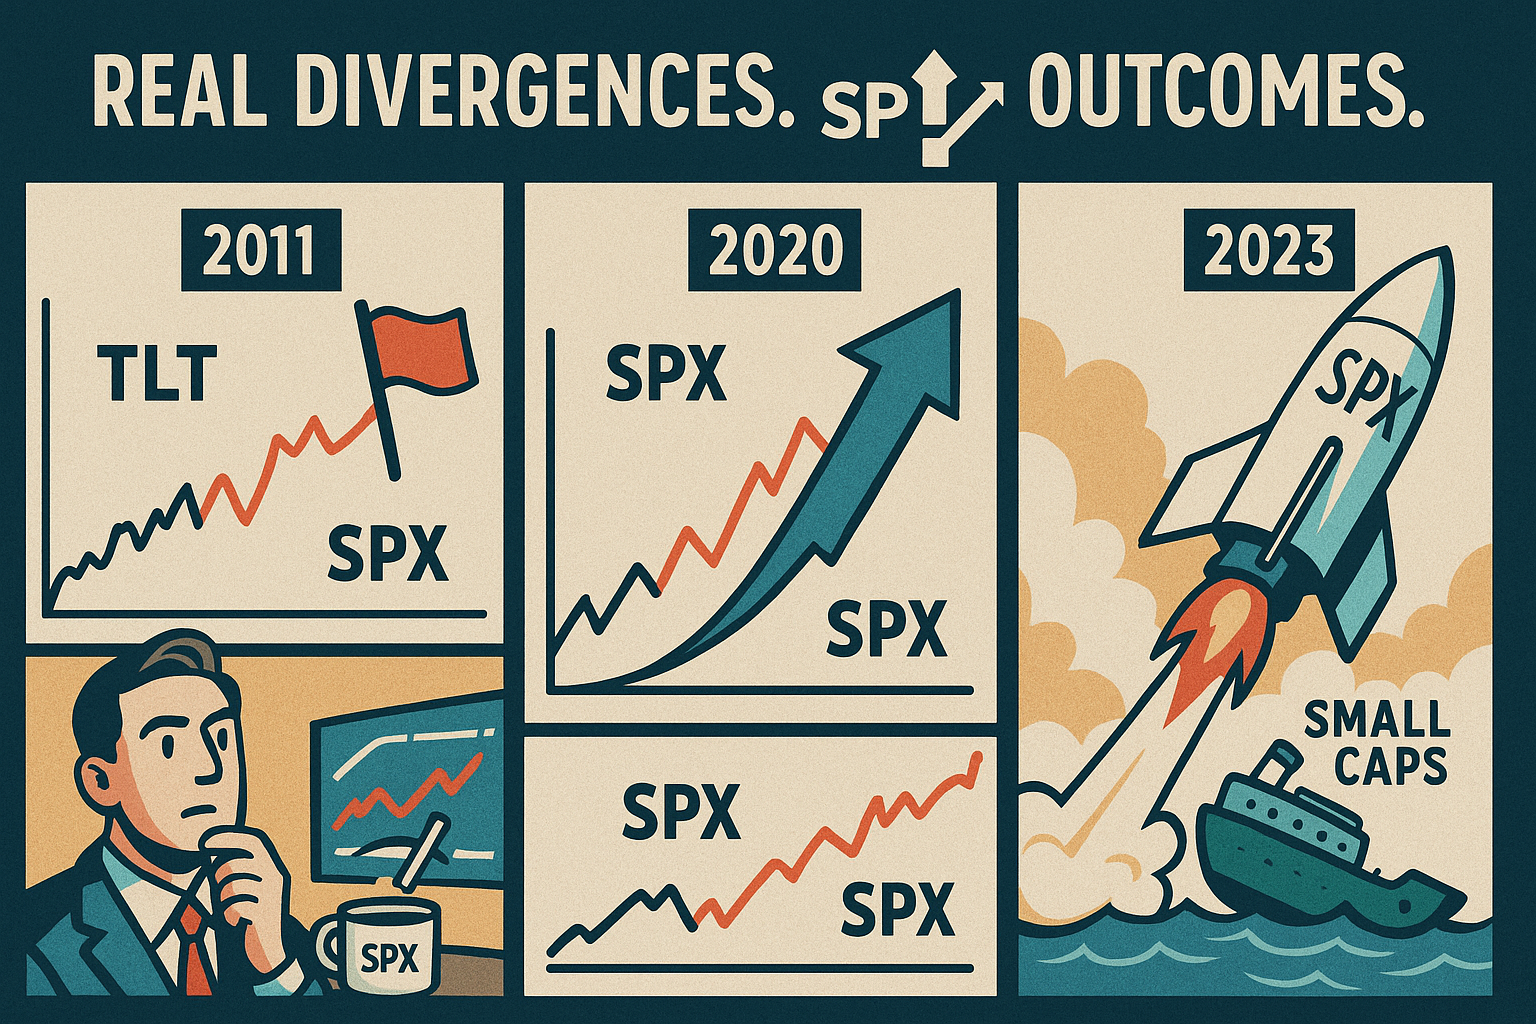
3. CASE STUDIES
️ 2011 – Credit Crackup
- TLT rallies through June-July
- SPX holds flat → then snaps 15% lower in August
- Credit markets had already priced the problem
️ March 2020 – Covid Panic Bottom
- SPX makes low near 2200
- TLT stops going up
- Bond market stabilizes before equity reversal
- Within 3 days, SPX rebounds 15%
️ October 2022 – Inflation Top
- SPX makes fresh lows
- TLT starts bottoming
- Fed signaling softer tone
- Equities bottom weeks later
4. WHAT INSTITUTIONS WATCH
- Macro PMs track real rate shifts, not nominal yields
- Volatility desks monitor bond volatility (MOVE index) vs VIX
- Multi-asset desks watch for convexity trades (rate hedges unwinding)
Execution Filter (from Bridgewater-style model):
“Equities pricing panic while bonds calm = mean-reversion bias. Equities pricing calm while bonds panic = volatility expansion bias.”
5. SYSTEM LOGIC
Conditions:
- SPX prints lower low vs prior swing
- TLT/ZB prints higher low or rising trend
- VIX fails to confirm (no higher high)
- Pulse bar or reclaim signal on SPX
Entry: Pulse bar close or reclaim
Stop: SPX session low
Target: Mean reversion to key VWAP or gamma level
Enhancers:
- MOVE index declining
- Term structure normalization in VIX
- SPX above anchored VWAP after reclaim
6. MODELING IT
Use:
- TradingView: Overlay SPX and TLT
- Add indicators: Bollinger Bands, Pulse Bar, Gamma Exposure
- Tag divergence zones manually or with scripted alerts
Metrics to track:
- Avg return after TLT divergence
- % of SPX reversals within 1-3 days
- Vol surface reaction (e.g. skew, IV drop)
7. WHAT TO AVOID
- Don’t trade bond divergence without confirmation (SPX must show signal)
- Beware CPI/FOMC weeks – yields and equities can both panic
- Don’t ignore the MOVE index – bond vol often front-runs equity vol
8. FURTHER READING
- Ruggiero – Intermarket Systems with Bonds & Equities
- Jeff Gundlach – Bond Market vs Equity Signal Dislocations
- SentimenTrader – Macro Reversal Triggers via TLT
- MOVE Index (ICE BofAML) vs VIX divergence studies
- Bloomberg Terminal: Bond-Equity Correlation Overla
Most Trade SPX Blind. You’ll Trade It Like You Designed It.
Pulse bars flip the lights on. You see it. Trade it. Bank it.
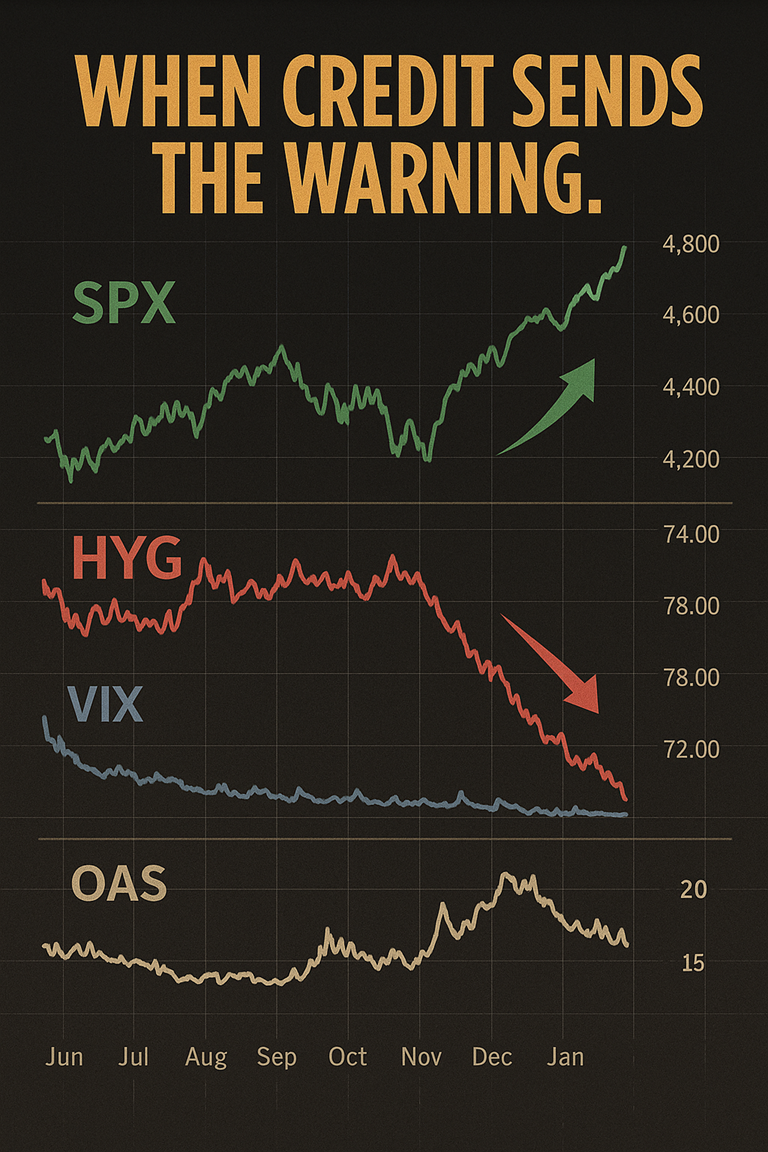
Chapter 3: SPX vs Credit Markets
WHEN JUNK MOVES FIRST
“When high-yield debt sneezes, equities usually catch the flu – just not right away.”
Credit is often called the “smartest market” for good reason. While retail traders stare at candlestick patterns, credit investors are pricing risk months in advance. So when SPX pushes higher but high-yield credit (HYG, JNK) starts diverging lower – that’s not a shrug. That’s a siren.
This chapter decodes:
- The predictive power of credit spreads
- Why high-yield bonds often diverge before SPX turns
- Historical examples of SPX following credit
- How institutional desks monitor and act on credit dislocations
- System logic and tools for incorporating this divergence
1. WHY CREDIT MATTERS TO EQUITIES
Credit markets fund the corporate world. High-yield (junk) bonds are especially sensitive to:
- Liquidity stress
- Rate spikes
- Default expectations
- Volatility of cash flows
When credit markets start widening spreads or dumping risk, equities can look fine on the surface but are often standing on a cracking foundation.
Instruments to Watch:
- HYG / JNK: High-yield bond ETFs (daily signals)
- CDX High Yield: Credit default swaps (institutional access)
- High-Yield OAS (Option-Adjusted Spread): Bloomberg benchmark
2. THE CREDIT DIVERGENCE SETUP
Classic sequence:
- SPX makes higher highs or stays flat
- HYG makes lower highs or breaks support
- VIX begins to rise with SPX
- Credit spreads widen (OAS ticks higher)
This type of divergence is slow to develop but sharp in consequence. It often precedes:
- Volatility spikes
- Short-term SPX pullbacks
- Structural trend changes
3. HISTORICAL CASE STUDIES
️ 2014 – Energy Sector Crack
- SPX makes new highs into July
- High-yield credit diverges due to energy bond selloff
- Cracks widen through Q3
- SPX drops 10% in October
️ 2018 – Pre-Volmageddon Divergence
- Jan: SPX +5%
- HYG starts falling in late Jan
- SPX collapses Feb 5-6
️ 2022 – Rate Shock Divergence
- Credit spreads widen in Jan/Feb
- SPX holds until March, then begins multi-month selloff
Conclusion: Credit often leads risk-off – even if it takes weeks to show up on the SPX chart.
4. HOW FUNDS USE CREDIT DIVERGENCE
- Credit desks monitor HY vs IG spread curves daily
- Volatility desks use spread widening to front-run VIX spikes
- Macro funds see credit divergence as a sign of tightening financial conditions
Bridgewater-style model:
“We don’t short SPX because HYG falls – we reduce risk and widen stops when it starts. Then we short when vol confirms.”
5. SYSTEM LOGIC: CREDIT LEADS
Conditions:
- SPX flat or rising
- HYG making lower highs or breaks key support
- Credit OAS rising
- VIX begins to rise with SPX
Trigger: Pulse bar breakdown in SPX + HYG confirmation
Stop: Above recent SPX swing high
Target: 1.5-3R or 50-80 point pullback
Enhancers:
- Gamma exposure turning negative
- Term structure inversion (VIX9D > VIX)
- Skew blowing out
6. MODELING CREDIT DIVERGENCE
Tools:
- TradingView: Overlay HYG with SPX
- Koyfin / Bloomberg: Track OAS and HY spreads
- Finviz heatmap: Sector-specific credit performance
Backtest:
- Tag periods when HYG diverges >2% from SPX
- Track SPX returns 1, 3, and 5 days later
- Track correlation with VIX spikes and gamma flip zones
7. WHAT TO AVOID
- Chasing divergence without vol confirmation
- Trading into central bank weeks or major debt issuance cycles
- Confusing sector-specific credit events (e.g. energy) with broad risk
8. FURTHER READING
- SentimenTrader – Credit Divergence Case Studies
- Deutsche Bank – High-Yield Signals in Equities
- Bloomberg OAS Curve Explorer
- The Credit Strategist – Junk Bond Moves Ahead of SPX
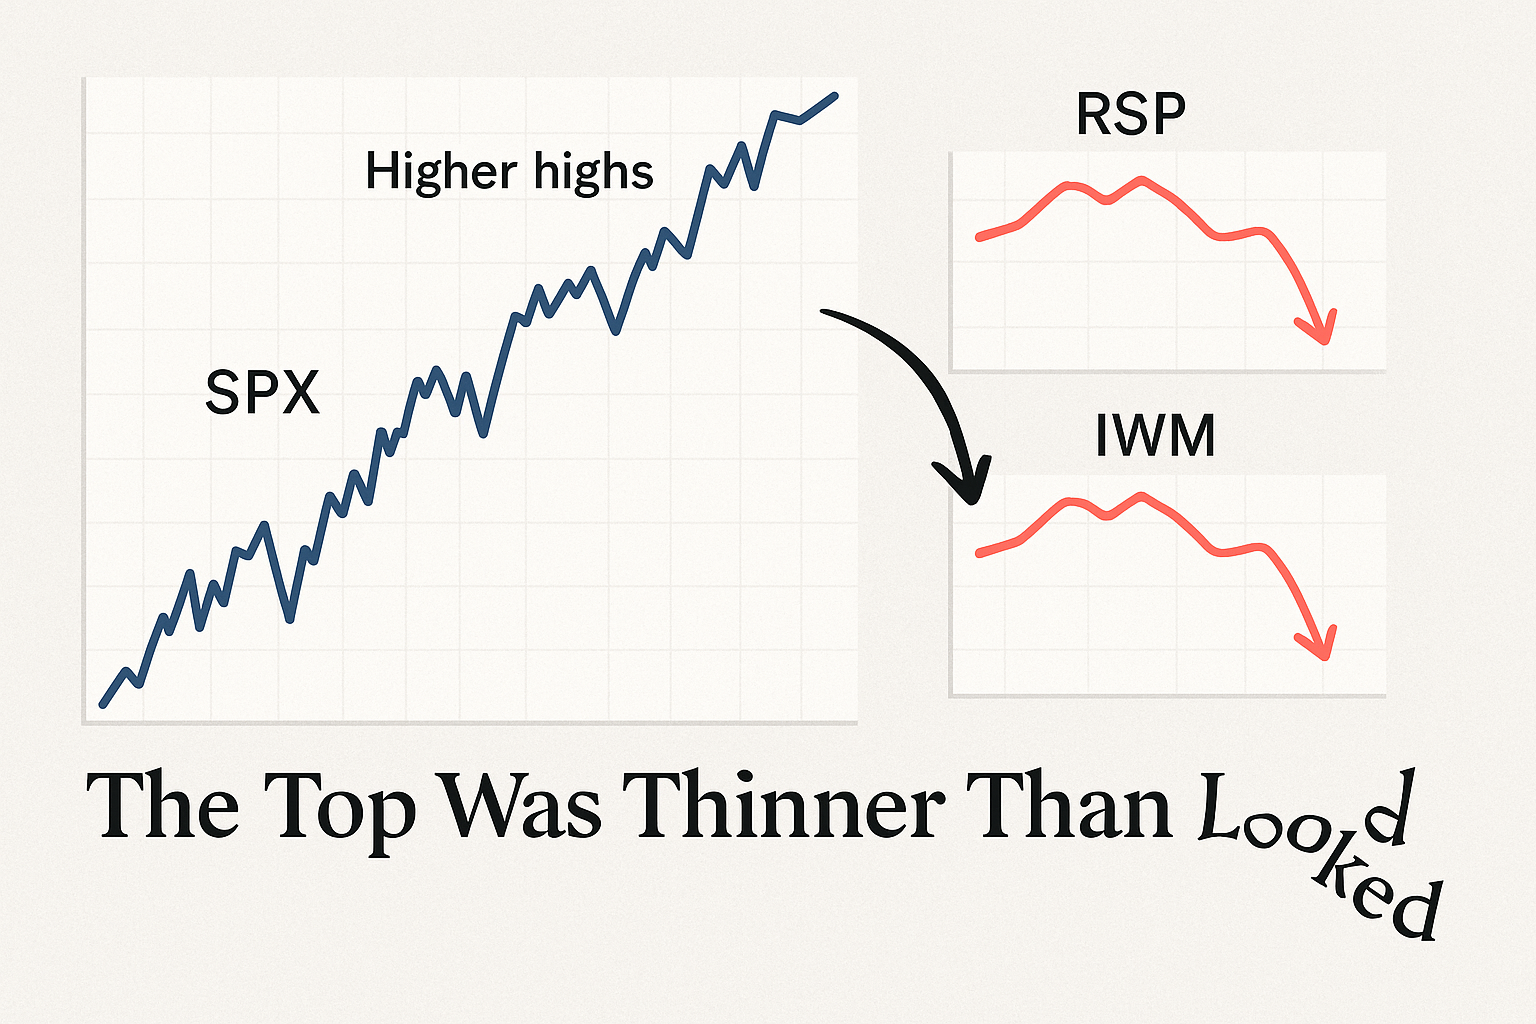
Chapter 4: SPX vs RSP & IWM
WHEN BREADTH BREAKS DOWN
“When the generals charge but the troops retreat – that’s not leadership. That’s a trap.”
SPX can look strong on the surface – but that doesn’t mean the market is healthy underneath. When price is being driven by just a few mega-cap names (AAPL, MSFT, NVDA), and the rest of the market is sagging… that’s a classic breadth divergence.
This chapter explores:
- How breadth divergence manifests using SPX vs RSP (equal-weight) and IWM (small caps)
- What it signals about risk and liquidity
- Historical breakdowns following weak breadth
- Institutional models for breadth failure
- Trade setups using pulse bar confirmation
1. THE BREADTH DIVERGENCE BLUEPRINT
SPX vs RSP (Equal Weight)
- SPX may rise due to large-cap weighting
- RSP (equal-weight S&P 500) tells the real story
- Divergence = narrow leadership → systemic fragility
SPX vs IWM (Small Caps)
- Small caps reflect domestic liquidity + risk appetite
- When IWM diverges lower, big caps are hiding the stress
Breadth breakdown often precedes:
- Volatility expansions
- Failed breakouts in SPX
- Rotation from tech/mega into defensive sectors
2. KEY TRIGGERS TO WATCH
- SPX makes new high (weekly/daily close)
- RSP and IWM make lower highs
- Advance/Decline line rolls over
- McClellan Oscillator negative
Bonus signs:
- NYSE %Above 200-day declining while SPX rises
- Put/Call ratio flattening or rising
- VIX holding up on SPX strength
3. HISTORICAL EXAMPLES
️ Summer 2015
- SPX flat to higher through July
- RSP and IWM diverged lower
- Flash crash hits in August
️ Feb-Sept 2021
- SPX makes ATHs
- IWM sideways for 7+ months
- RSP underperforms
- Market eventually corrects -5 to -10% multiple times
️ 2023-24
- SPX rallies on Magnificent 7
- RSP lags, IWM down 20% from highs
- Volatility increases, SPX sees multiple -3% pullbacks
4. INSTITUTIONAL BREADTH MONITORS
- Quant desks monitor relative RSP/SPX ratios
- Execution desks use A/D lines to adjust leverage
- ETF desks rebalance on sector-level divergence alerts
BlackRock PM note:
“When breadth collapses and skew compresses, we prep for volatility. Especially if SPX is stretched vs equal-weight.”
5. SYSTEM SETUP – BREADTH FAILURE FADE
Conditions:
- SPX prints new 5-day or 20-day high
- RSP + IWM diverge (lower highs or flat)
- VIX stalls or rises intraday
- Pulse bar reversal at SPX resistance
Entry: Pulse bar breakdown below reclaim zone
Stop: Just above SPX swing high
Target: 1.5-2.5R or return to VWAP
Enhancers:
- Negative gamma exposure
- NYSE %Above 50D trending lower
- A/D line divergence >3 days
6. MODELING THE SETUP
Tools:
- TradingView: Overlay SPX vs RSP and SPX vs IWM
- Add Bollinger Bands + Pulse Bar custom script
- Track SPX pullbacks after divergence tags
Metrics:
- % of SPX failed breakouts after RSP divergence
- Volatility expansion following A/D divergence
- Win rate with pulse bar + negative gamma combo
7. WHAT TO AVOID
- Assuming breadth divergence = crash (it’s a signal, not a timing tool)
- Using intraday divergences (daily/weekly close is more reliable)
- Trading during earnings season or sector rotation cycles
8. FURTHER READING
- SentimenTrader – Breadth Non-Confirmations
- CBOE – Volatility Implications of Narrow Leadership
- Goldman Sachs – Equal Weight vs Cap-Weight Risk Alerts
- Koyfin / YCharts – Custom RSP/SPX ratio dashboards
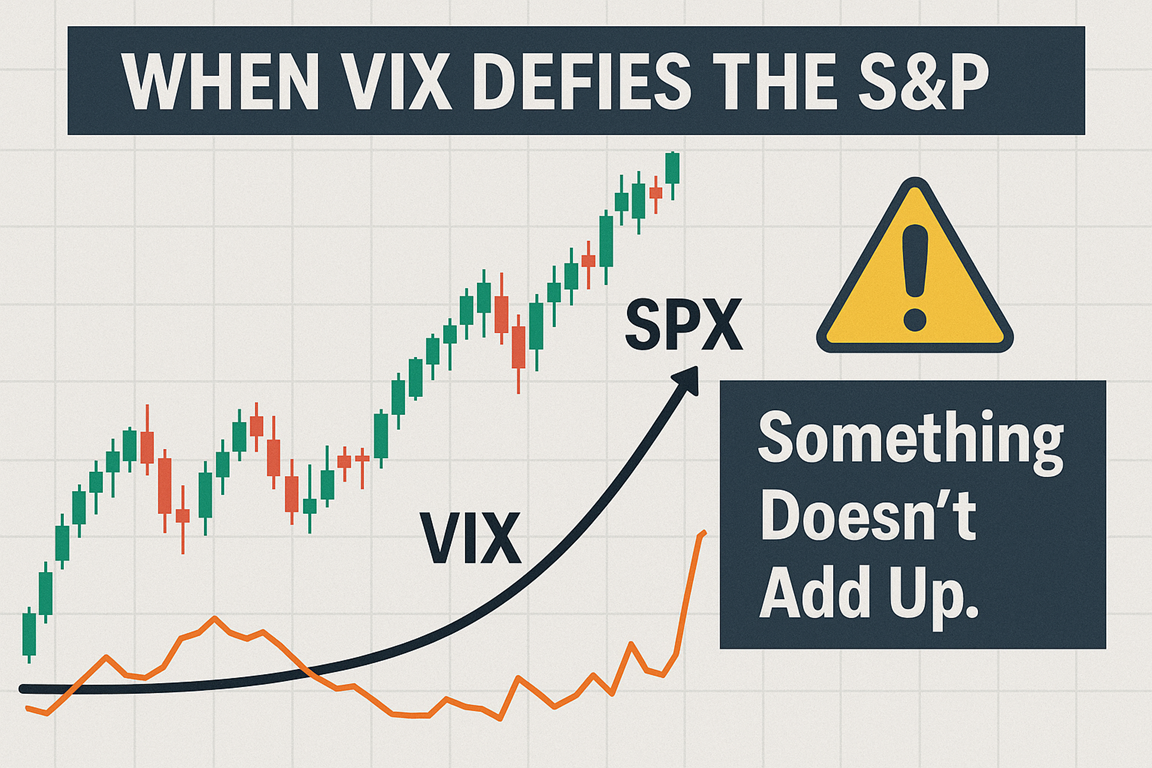
Chapter 5: SPX vs VIX
WHEN FEAR AND PRICE DISAGREE
“When SPX goes up and VIX goes up too – something’s about to break.”
The VIX is often misunderstood. It’s not a crystal ball – it’s a thermometer for tension in the options market. And when SPX price action diverges from VIX behavior, it’s a sign of positioning misalignment, latent stress, or imminent volatility.
This chapter covers:
- The SPX-VIX correlation structure
- What positive correlation means (and why it matters)
- How divergence signals failed breakouts, false rallies, and gamma traps
- Institutional volatility models
- Systematic setups based on SPX/VIX non-confirmation
1. NORMAL VS DIVERGENT BEHAVIOR
✅ Normal:
- SPX up → VIX down
- SPX down → VIX up
⚠️ Divergence:
- SPX up → VIX up = short squeeze, hedging panic, hidden stress
- SPX down → VIX down = dealer absorption, exhaustion, mean-reversion setup
Why this happens:
- 0DTE option flows creating short gamma traps
- Dealers hedging risk pre-news
- Funds hedging despite price strength
- Complacency or mispricing of tail risk
2. THE POSITIVE CORRELATION SETUP
Classic pattern:
- SPX rallies or holds highs
- VIX rises for 1-3 sessions
- Skew compresses (flattening)
- VIX term structure inverts (short-dated > 30D)
This signals:
- Market makers getting nervous
- Fragile positioning beneath the surface
- Impending volatility expansion
Especially common during:
- CPI/FOMC weeks
- Major earnings clusters
- OPEX unwind periods
3. HISTORICAL EXAMPLES
️ Feb 2020 (Pre-COVID Crash)
- SPX at ATHs
- VIX rises from 13 → 18 while SPX still climbing
- Weeks later: full-blown crash
️ June 2023
- SPX rallies post-FOMC
- VIX rises for 3 straight days
- Market chops, then drops 100+ points in 3 days
️ March 2024
- SPX up +0.5%, VIX up +5%
- Gamma flip zone hit
- Sharp reversal intraday
4. HOW PROS READ VIX DIVERGENCE
- Vol desks track VIX/SPX correlation shifts daily
- Macro PMs overlay VIX term structure with SPX price zones
- Options market makers watch for skew compression and 0DTE flow distortion
Citi volatility desk note:
“SPX up with VIX up is rarely bullish. It’s an edge-case warning that surface calm is misleading.”
5. TRADE SYSTEM – NON-CONFIRMATION FADE
Conditions:
- SPX prints higher high (1-3 day window)
- VIX also rises
- Skew flattens
- Pulse bar or engulfing reversal on SPX
Entry: Breakdown after failed high
Stop: Above recent high
Target: Gamma zone, VWAP, or 1.5-2.5R
Bonus signals:
- VIX9D > VIX = short-term vol stress
- SPX + VIX + HYG diverge together = triple trigger
6. MODELING & ALERTING
Tools:
- TradingView: Plot SPX + VIX + VIX9D overlay
- Create alerts for SPX up + VIX up daily/4H
- Combine with pulse bar or tag-n-turn setups
Metrics:
- How often SPX + VIX both rise precedes reversal
- Avg pullback size after divergence
- Confirmation rate with gamma flip proximity
7. WHAT TO AVOID
- Chasing VIX-based setups during low liquidity hours
- Mistaking implied vol spikes for realized stress
- Ignoring macro catalysts (news > signal)
8. FURTHER READING
- CBOE – Understanding VIX Divergences
- SpotGamma – Gamma Exposure and SPX/VIX Traps
- Tier1Alpha – Vol Correlation Breakdown Research
- JPMorgan – Cross-Asset Volatility Dashboard
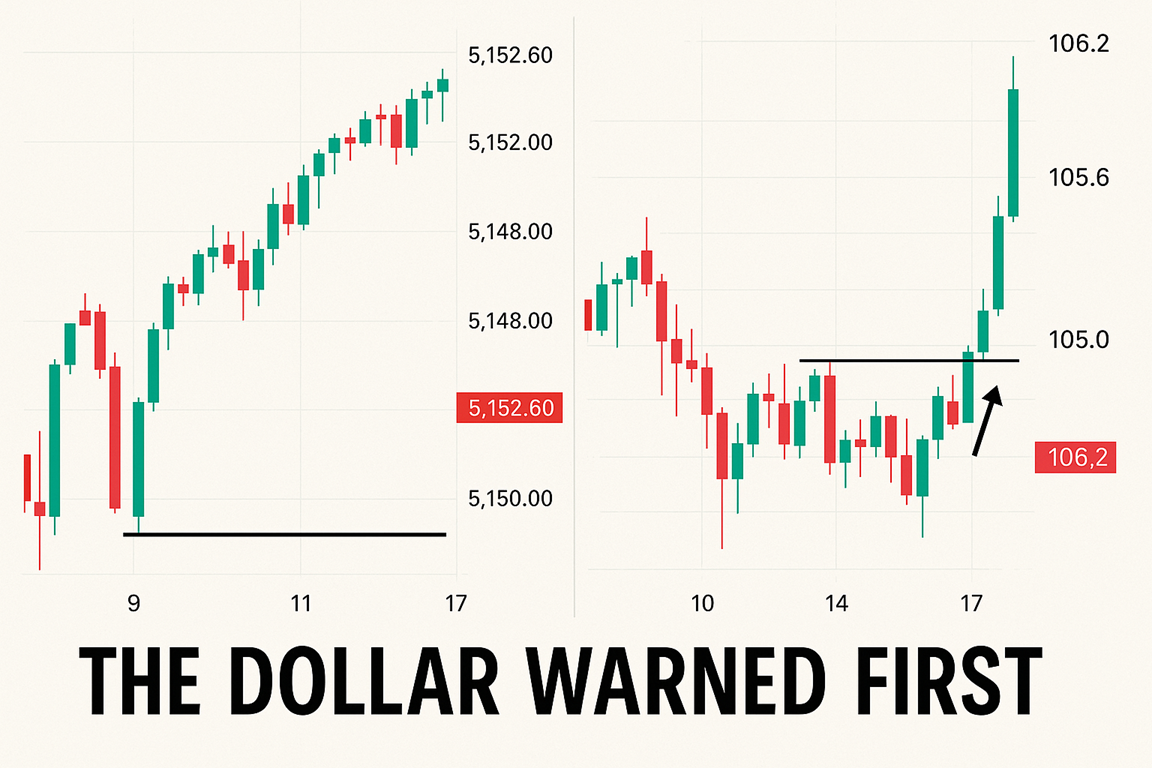
Chapter 6: SPX vs DXY
WHEN THE DOLLAR DICTATES RISK-ON OR RISK-OFF
“If the dollar rips and stocks stall – someone’s bluffing. And it’s usually equities.”
While many traders fixate on earnings and price levels, macro players watch the U.S. Dollar Index (DXY) like a hawk. Why? Because the dollar represents global liquidity, interest rate pressure, and flight-to-safety demand. When DXY surges while SPX grinds higher… it’s often the dollar that’s telling the truth.
This chapter reveals:
- How SPX and DXY typically move together (or don’t)
- Why dollar strength often breaks equity rallies
- Historic divergence examples that foreshadowed sharp pullbacks
- How global desks use DXY to gauge risk-on vs risk-off
- Trade setups and system overlays
1. WHY DXY MATTERS TO SPX
DXY reflects demand for USD vs a basket of currencies. A rising DXY can mean:
- Higher U.S. yields vs rest of world
- Tightening financial conditions
- Global risk-off flows
- Stronger dollar = tighter liquidity for U.S. multinationals
Typical behavior:
- DXY up → SPX down = tightening conditions
- DXY down → SPX up = global liquidity tailwind
Divergence occurs when:
- DXY rips higher
- SPX keeps pushing up or grinding sideways
That’s often a signal that equity strength is masking macro stress.
2. TRADE SIGNAL: THE DOLLAR HEADFAKE
Divergence Setup:
- DXY breaks to new multi-week highs
- SPX holds or grinds higher
- Bond yields rise with DXY
- Volatility markets stay complacent
Interpretation:
- Global tightening not yet priced into SPX
- Short-squeeze / gamma-fueled equity strength likely short-lived
When SPX finally reacts:
- Fast, sharp correction
- Macro re-alignment trade
3. HISTORICAL EXAMPLES
️ Jan-Feb 2015
- DXY surges post-ECB QE
- SPX grinds higher
- Reversal in equities late Feb, sharp pullback in March
️ Sept 2022
- DXY hits multi-decade highs
- SPX attempts to hold 3900-4000
- SPX collapses weeks later into October bottom
️ July 2023
- DXY bottomed and surged back toward 104
- SPX stalled at resistance
- Choppy pullback follows
4. HOW GLOBAL DESKS READ THIS
- FX desks anchor DXY moves to global liquidity cycles
- Cross-asset strategists track DXY vs SPX, EMs, and commodities
- Macro PMs overlay DXY + SPX + bond yields to track stress builds
From a Barclays macro note:
“A rising dollar is a form of stealth tightening. When equities ignore it, we prepare to rotate.”
5. TRADE SYSTEM – DOLLAR LEADS
Conditions:
- DXY prints multi-week high
- SPX stalls or grinds
- Yields rising alongside DXY
- Pulse bar reversal or tag-n-turn on SPX
Entry: On SPX breakdown with DXY still strong
Stop: Above local SPX high
Target: 1.5-2.5R to VWAP, gamma flip, or recent swing low
Confirmation Layers:
- VIX begins rising
- Credit spreads widen
- HYG diverges lower
6. MODELING & MONITORING
Tools:
- TradingView: SPX, DXY, and 10Y yields overlay
- Use alerts: DXY > prior swing + SPX pulse bar down
- Monitor macro catalysts: CPI, FOMC, ECB, BOJ weeks
Backtest ideas:
- SPX returns when DXY breaks higher + SPX flat
- Vol expansion after divergence zones
- Compare to gamma positioning and vol surface steepness
7. WHAT TO AVOID
- Trading dollar divergence into macro catalysts
- Ignoring bond yield behavior (must confirm tightening)
- Assuming SPX must crash – it often just re-prices quickly
8. FURTHER READING
- Deutsche Bank – Dollar Liquidity and U.S. Equities
- BofA Global Research – DXY vs Risk-On/Risk-Off Maps
- CME Group – How USD Impacts SPX and Rates
- Bloomberg – DXY-S&P Regression Overlays
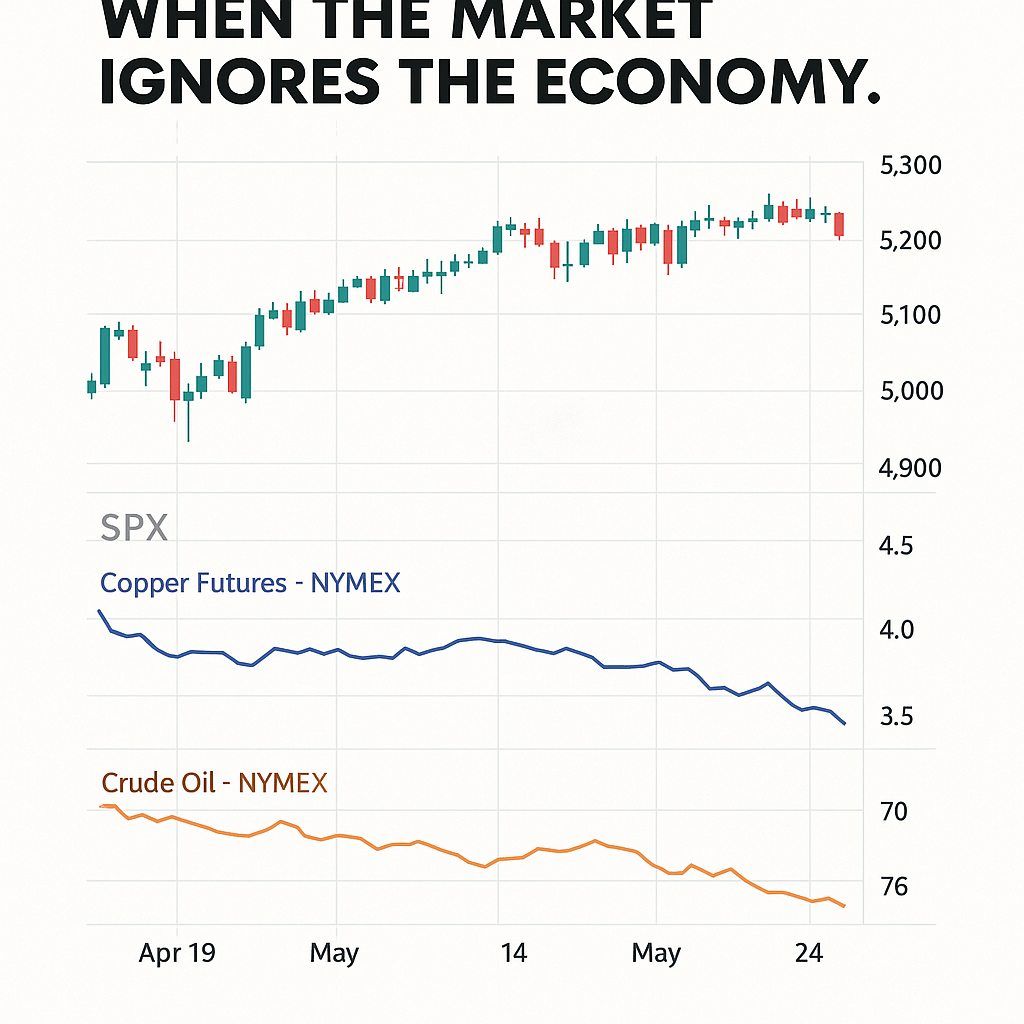
Chapter 7: SPX vs Commodities
WHEN OIL AND COPPER SPEAK FIRST
“If oil dumps and copper cracks, but equities ignore it – the market’s lying to someone.”
Commodities aren’t just about inflation. They’re real-world gauges of economic velocity, industrial health, and demand destruction. When commodities diverge from SPX – especially oil (CL) and copper (HG) – they often front-run equity weakness, sector rotations, or full-blown risk-off events.
This chapter explores:
- Why energy and industrial metals are leading signals
- Key divergence setups using oil, copper, and SPX
- Historical examples of commodity-first warnings
- Institutional macro frameworks
- Trade setups and monitoring tools
1. WHY COMMODITIES MATTER
Oil (CL):
- Tracks energy demand, geopolitical risk, inflation regimes
- Strong correlation to XLE, industrials, transports
Copper (HG):
- Called “Dr. Copper” – reflects global manufacturing health
- Closely tied to China growth, EM activity, industrials
When oil and copper fall hard while SPX grinds higher:
- Economic risk is rising
- Sector rotations are brewing
- Macro traders start de-risking
2. DIVERGENCE TRIGGERS
Bearish Divergence:
- CL and/or HG break down from recent ranges
- SPX holds or climbs
- Energy and materials sectors underperform
- VIX and yields stable or falling
Interpretation: SPX is driven by narrow mega-cap leadership, while the real economy signals stress.
Bullish Divergence:
- CL/HG rally or stabilize after prolonged downtrend
- SPX hasn’t reacted yet
- Inflation narrative resets
Commodities often sniff the turn before equities.
3. HISTORICAL CASES
️ Q3 2014 – Oil Collapse Begins
- CL peaks above $100
- SPX rallies into Sept
- Oil drops 25% before SPX reacts
- Energy-led correction follows
️ Q1 2020 – COVID Precursor
- HG and CL drop in Jan-Feb
- SPX holds up
- Full collapse in March
️ Q2 2022 – Inflation Peak
- Oil breaks lower from $120
- SPX flat for weeks
- Major drawdown follows
4. HOW FUNDS TRACK IT
- Macro PMs run multi-asset overlays: SPX vs CL, HG, DXY
- Commodity desks feed energy flows to equity teams
- Vol desks adjust hedges based on commodity-linked sector beta
Bridgewater note:
“When real assets diverge from financials, something’s breaking. Either pricing or policy.”
5. TRADE SYSTEM – COMMODITY LEADS, SPX LAGS
Conditions:
- CL and/or HG break key support
- SPX holds or grinds higher
- Pulse bar breakdown on SPX
- Sector divergence (XLE, XLI underperform)
Entry: On SPX rejection/pulse bar
Stop: Above recent high
Target: VWAP, swing low, 2R zone
Confirmation Add-ons:
- DXY strength
- Copper/oil ratio diverging from SPX
- XLE vs SPX underperformance
6. MODELING TOOLS
- TradingView: Overlay SPX, CL1!, HG1!
- Finviz: Sector divergence map
- Koyfin: XLE/SPX, HG/SPX relative strength
Metrics:
- SPX returns post-oil/copper breakdowns
- Sector rotation patterns
- Vol surface shift post-divergence
7. WHAT TO AVOID
- Reacting too early – commodities diverge before price reacts
- Ignoring news catalysts (OPEC, China PMI, CPI)
- Misreading copper’s signal in isolation (check global data)
8. FURTHER READING
- Goldman Sachs – Commodities vs Equities Correlation Cycles
- CME Group – Copper’s Role in Equity Risk Modeling
- Bloomberg – Oil Divergences with SPX: When They Matter
- Bridgewater Research – Real Asset Flows vs Financial Risk Pricing
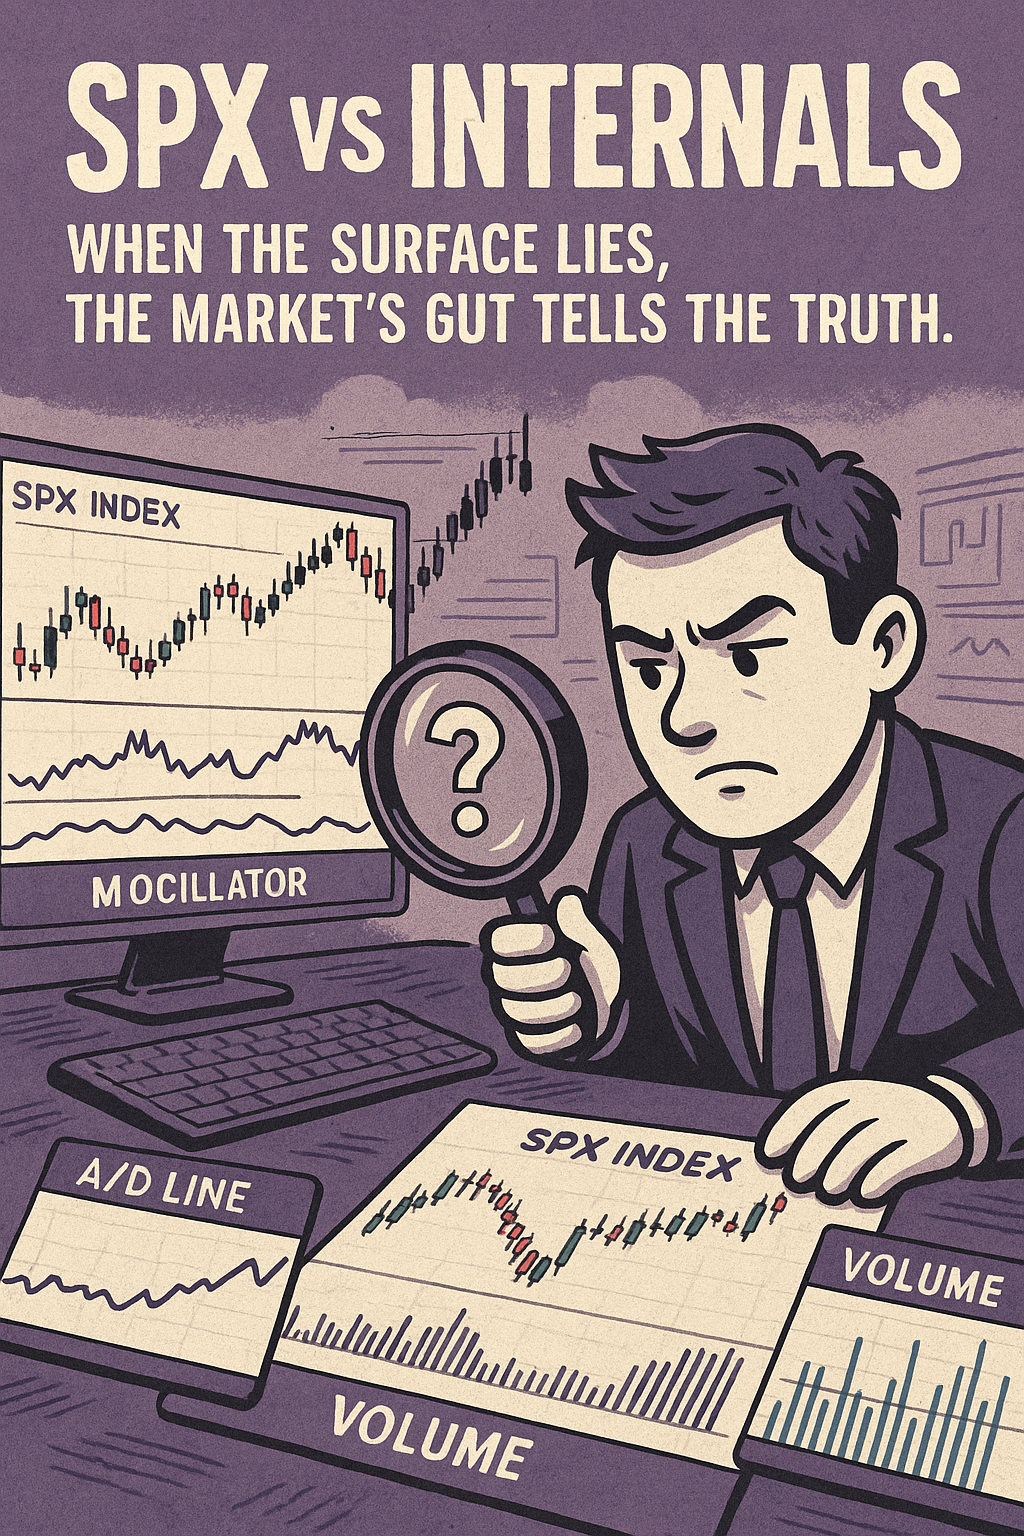
Chapter 8: SPX vs Internals
WHEN THE SURFACE LIES, THE MARKET’S GUT TELLS THE TRUTH
“SPX is the scoreboard. Internals are the locker room. One shows the points. The other shows who’s bleeding.”
Every trader knows price. Fewer know what’s underneath – the internals. When price diverges from internal strength (or weakness), it creates some of the most reliable short-term and medium-term reversal signals in the market.
In this chapter we cover:
- The internals that matter most
- How SPX diverges from NYMO, A/D line, volume trends
- Institutional tools and models
- Systematic setups using pulse bar confirmation + internal divergence
1. CORE INTERNAL INDICATORS
NYMO (McClellan Oscillator)
- Measures momentum of advancing vs declining issues on NYSE
- Works best for short-term reversals
A/D Line (Advance/Decline Line)
- Tracks number of advancing vs declining stocks
- Long-term health gauge
Volume Breadth / Up-Down Volume Ratio
- Shows if volume is supporting price moves
- Bearish: SPX up, down volume dominates
% of Stocks Above 50/200-Day MA
- Measures breadth of participation
- Divergence = fragility
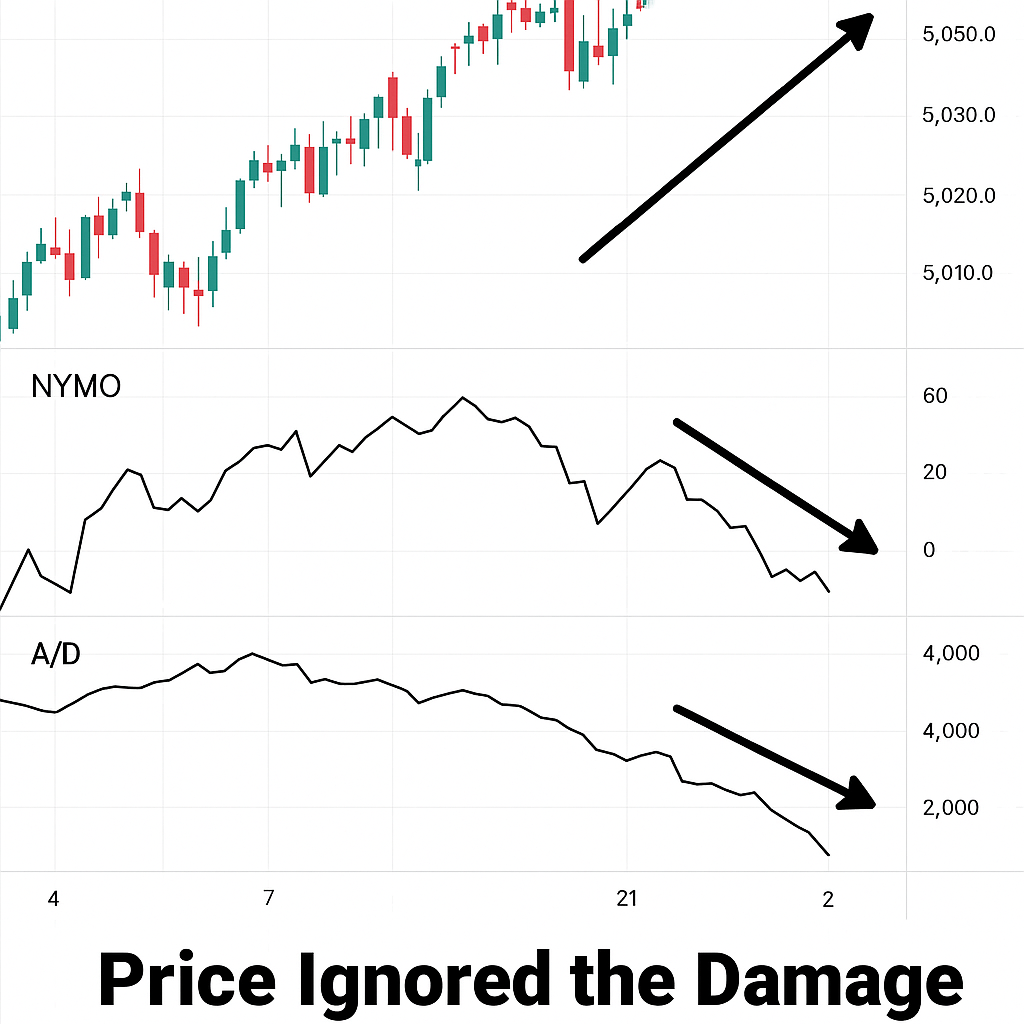
2. THE DIVERGENCE SETUP
⚠️ Classic Bearish Divergence:
- SPX makes higher high
- NYMO fails to confirm (lower high)
- A/D line flat or declining
- %Above 50D trending down
Interpretation:
SPX is levitating on fewer stocks – likely due to gamma suppression, ETF flow, or passive allocation. Internals are signaling exhaustion.
✅ Bullish Divergence:
- SPX makes lower low
- NYMO surges higher
- A/D line diverges upward
- Pulse bar fires on SPX reclaim
3. HISTORICAL CASES
️ Jan 2018
- SPX makes ATH
- NYMO fails to confirm
- VIX starts rising
- Feb 5 = Volmageddon crash
️ March 2020 Bottom
- SPX makes new low
- NYMO begins rising
- A/D and %Above 50D turn
- SPX bottom within days
️ Sept 2023
- SPX +0.5% on day
- NYSE down volume >85%
- A/D deeply negative
- SPX reverses next day, 3% pullback
4. HOW INSTITUTIONS USE INTERNALS
- Execution desks adjust position sizing based on NYMO/A-D spreads
- Quant desks use up/down volume ratios as trigger filters
- ETF market makers monitor participation to anticipate rebalancing
Fidelity asset allocation desk:
“Internals aren’t entries – they’re confidence builders. If breadth is failing, we reduce risk or hedge even if price looks fine.”
5. TRADE SYSTEM – INTERNAL NON-CONFIRMATION
Conditions:
- SPX makes new high/low
- NYMO + A/D diverge
- %Above 50D/200D trend opposes price
- Pulse bar reversal or engulfing pattern
Entry: On bar close after pulse bar
Stop: Above/below SPX extreme
Target: VWAP, mean reversion level, or gamma target
Enhancers:
- NYMO crosses above/below zero
- VOLD ratio flips aggressively
- Confirmed by SPX volatility or options flow
6. MODELING + TOOLS
- TradingView: NYMO, A/D custom indicators
- Koyfin: %Above 50/200D, Volume ratios
- Sierra/ThinkOrSwim: Real-time up/down volume
Metrics:
- Frequency of SPX reversals after NYMO divergence
- Breadth participation trends pre-reversal
- NYMO zero-line cross vs SPX pivot points
7. WHAT TO AVOID
- Trading internal divergence in isolation
- Relying on lagging MA breadth signals intraday
- Ignoring macro catalysts or OPEX days
8. FURTHER READING
- Walter Deemer – Technical Analysis of Market Breadth
- StockCharts – NYMO, A/D, and Internal Breadth Models
- Jason Goepfert (SentimenTrader) – Breadth Exhaustion Alerts
- ThinkMarkets – Volume Divergence Systems
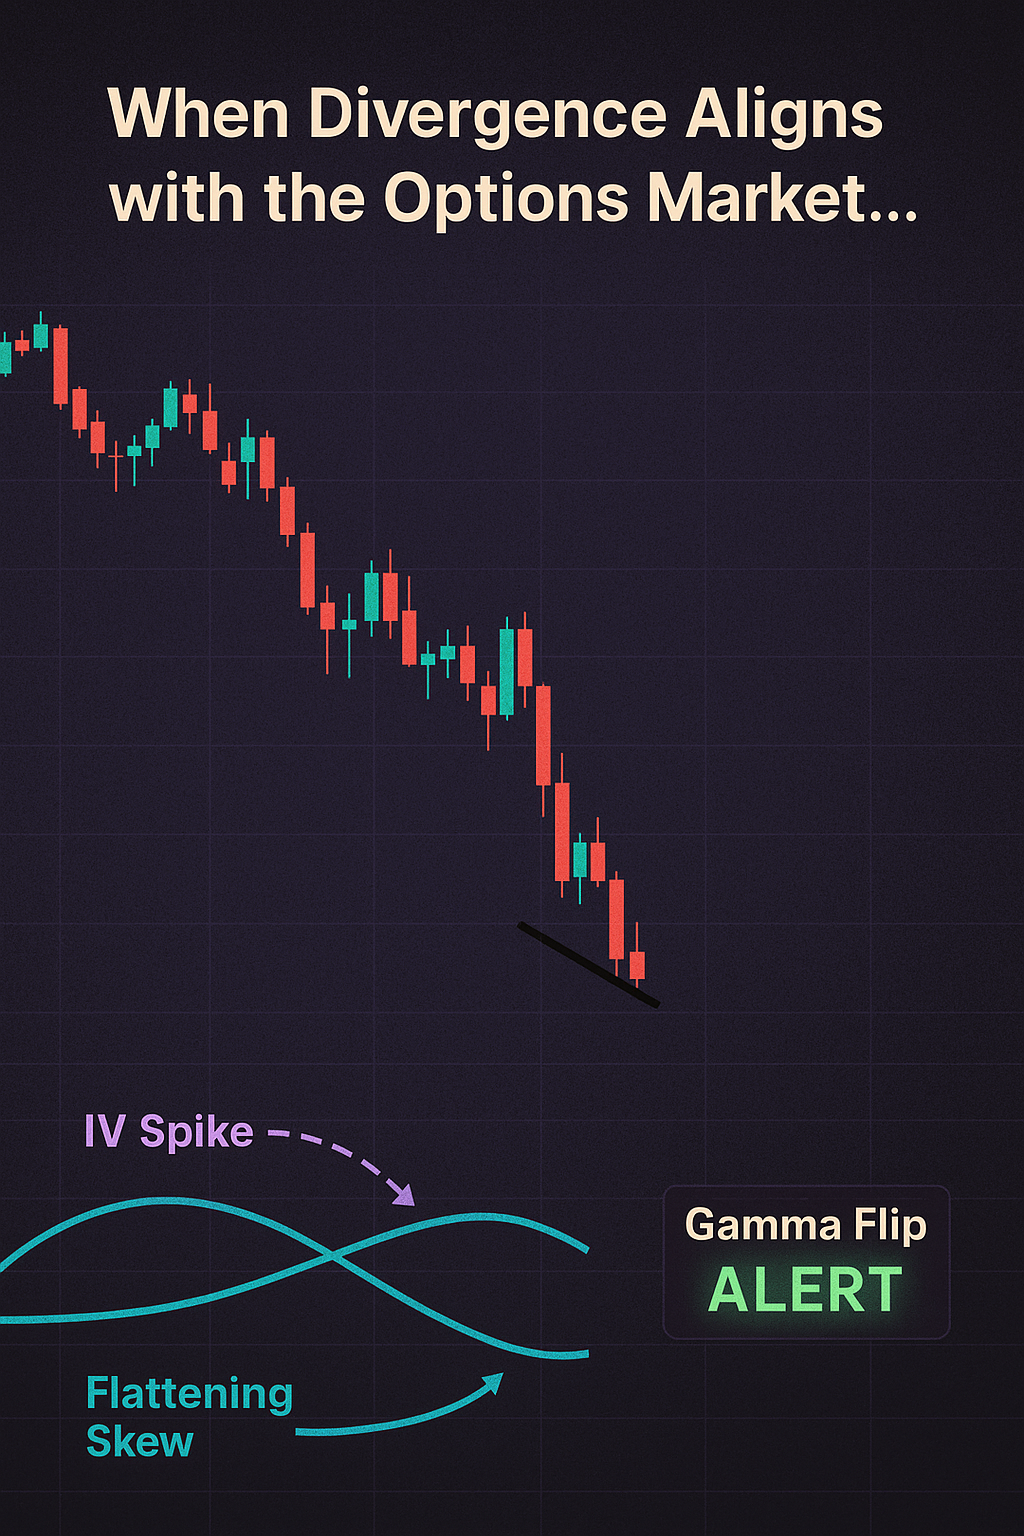
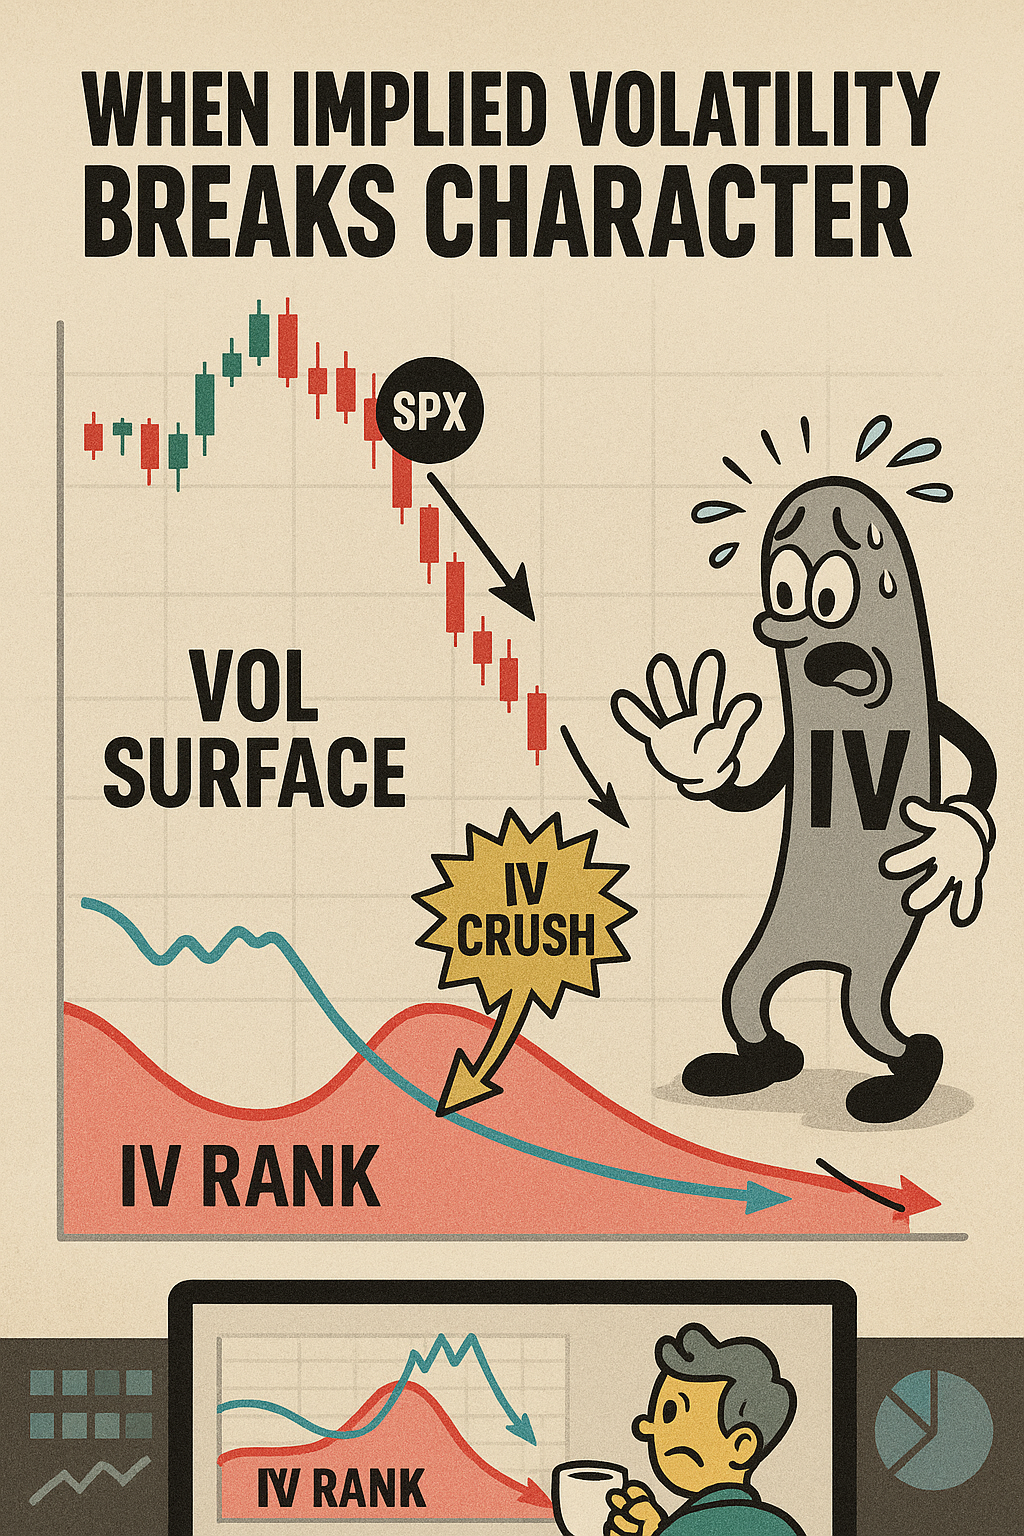
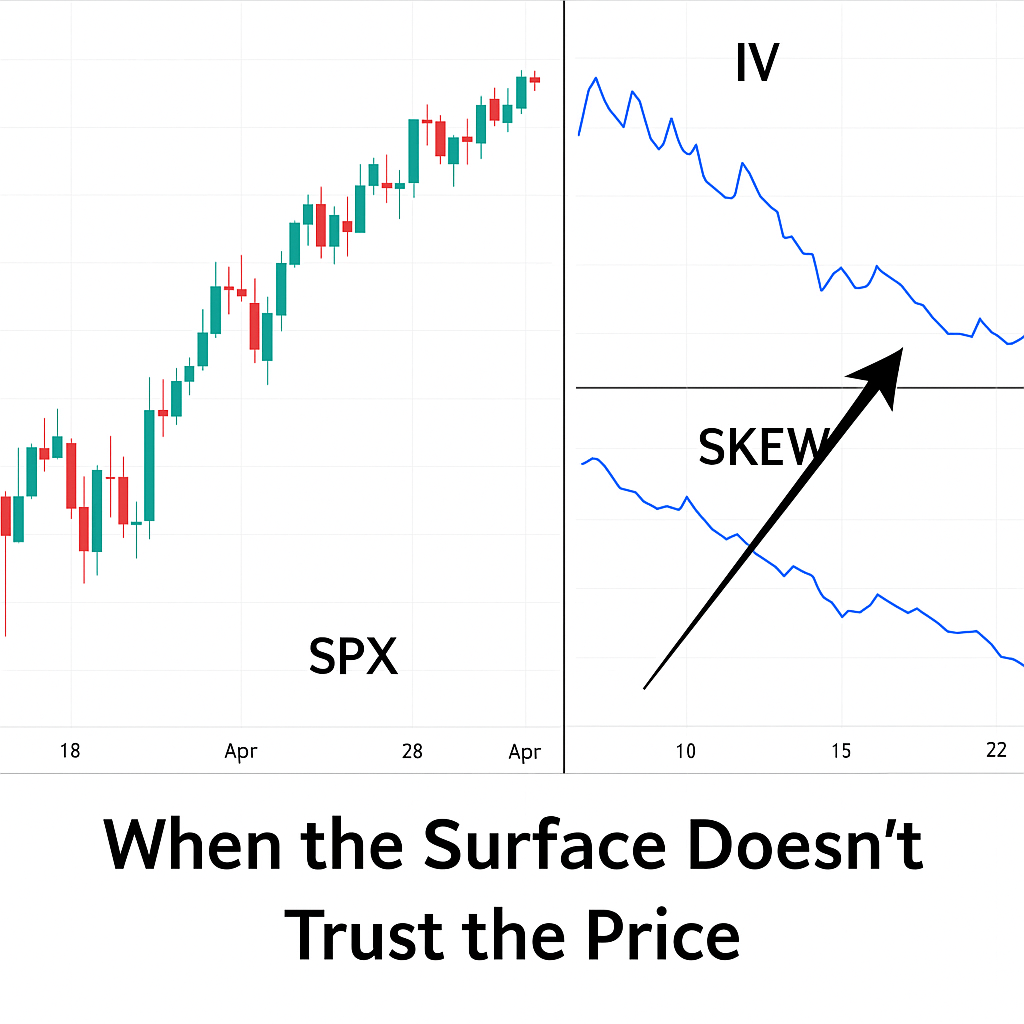
Chapter 9: SPX vs Vol Surface
WHEN IMPLIED VOLATILITY BREAKS CHARACTER
“Skew is sentiment. IV is fear. Term structure is timing. When they turn on price – you listen.”
Every SPX price bar is shaped by volatility. Not just how much it moves – but how market makers expect it to move. That expectation is encoded in the volatility surface: implied volatility, skew, and term structure.
When price diverges from the behavior of the vol surface, it’s a sign the underlying tension is either being masked or mispriced – and that sets up opportunity.
This chapter unpacks:
- What the vol surface tells you that price won’t
- Why SPX + falling IV isn’t always bullish
- Historical moments where vol led the reversal
- Trade systems using skew/term structure as filters
1. VOL SURFACE PRIMER
Implied Volatility (IV): Market’s forecast of future volatility
- Measured per strike and duration
- High IV = expected big moves
Skew: Difference in IV between OTM puts and calls
- High skew = fear of downside
- Flat skew = complacency or aggressive hedging unwinds
Term Structure: Curve of IV across expirations
- Inverted curve (short-term IV > long-term) = panic
- Steep curve = premium for future uncertainty
Key Principle:
- If SPX is rising and IV is rising → market doesn’t trust the move
- If SPX is falling and IV is falling → someone is absorbing risk
2. BEARISH DIVERGENCE SETUP
- SPX makes new high
- IV increases
- Skew flattens
- Term structure inverts (0DTE > 30D)
This usually precedes failed breakouts, trap rallies, and gamma resets.
Common around:
- OPEX weeks
- FOMC pivots
- Large ETF rebalancing periods
3. BULLISH DIVERGENCE SETUP
- SPX makes new low
- IV fails to rise (or drops)
- Skew compresses (no tail fear)
- Pulse bar fires after reclaim
Indicates downside may be overdone – especially if short-dated vol collapses first.
4. CASE STUDIES
️ June 2023
- SPX uptrend
- VIX + IV rise with price
- Skew flat → short-covering, dealer stress
- SPX pulls back hard within 2 sessions
️ Oct 2022 Bottom
- SPX new low
- Skew and IV collapse
- Pulse bar fires
- SPX begins multi-month rally
️ Feb 2024
- SPX flat
- Skew steepens
- Term structure inverts
- SPX drops 100+ pts in 3 days
5. INSTITUTIONAL VOL TOOLS
- Vol desks map SPX moves against implied vol overlays
- Options market makers track gamma flip zones
- Macro funds monitor skew steepness and IV Rank as signal filters
From SpotGamma note:
“When SPX drifts higher into flat skew and elevated IV, we watch for fade entries. It’s not sustainable unless vol resets.”
6. TRADE SYSTEM – VOL SURFACE DIVERGENCE
Conditions:
- SPX new high or low
- IV moves in opposite direction
- Skew shifts aggressively
- Pulse bar triggers on price chart
Entry: On pulse bar confirmation
Stop: Above/below price extreme
Target: Gamma flip, VWAP, or 1.5-3R range
Enhancers:
- IV Rank >70 or <30
- VIX9D > VIX = near-term stress
- Dealer gamma negative
7. MODELING AND MONITORING
Tools:
- SpotGamma dashboards
- TradingView + VIX/Skew/IV overlays
- ThinkOrSwim: Sizzle Index + Skew
Metrics:
- Reversal rates after vol-price divergence
- SPX performance post IV spike vs fade
- Win rate w/ IV Rank + pulse bar combo
8. WHAT TO AVOID
- Treating IV rise alone as bearish (needs skew + price context)
- Over-trading OPEX fakeouts
- Ignoring term structure shifts on Fed weeks
9. FURTHER READING
- SpotGamma – Volatility Surface & Gamma Traps
- CBOE – Understanding Skew and Curve Shape
- SqueezeMetrics – Dealer Hedging and IV Compression
- Tier1Alpha – IV Rank as Trend Exhaustion Tool
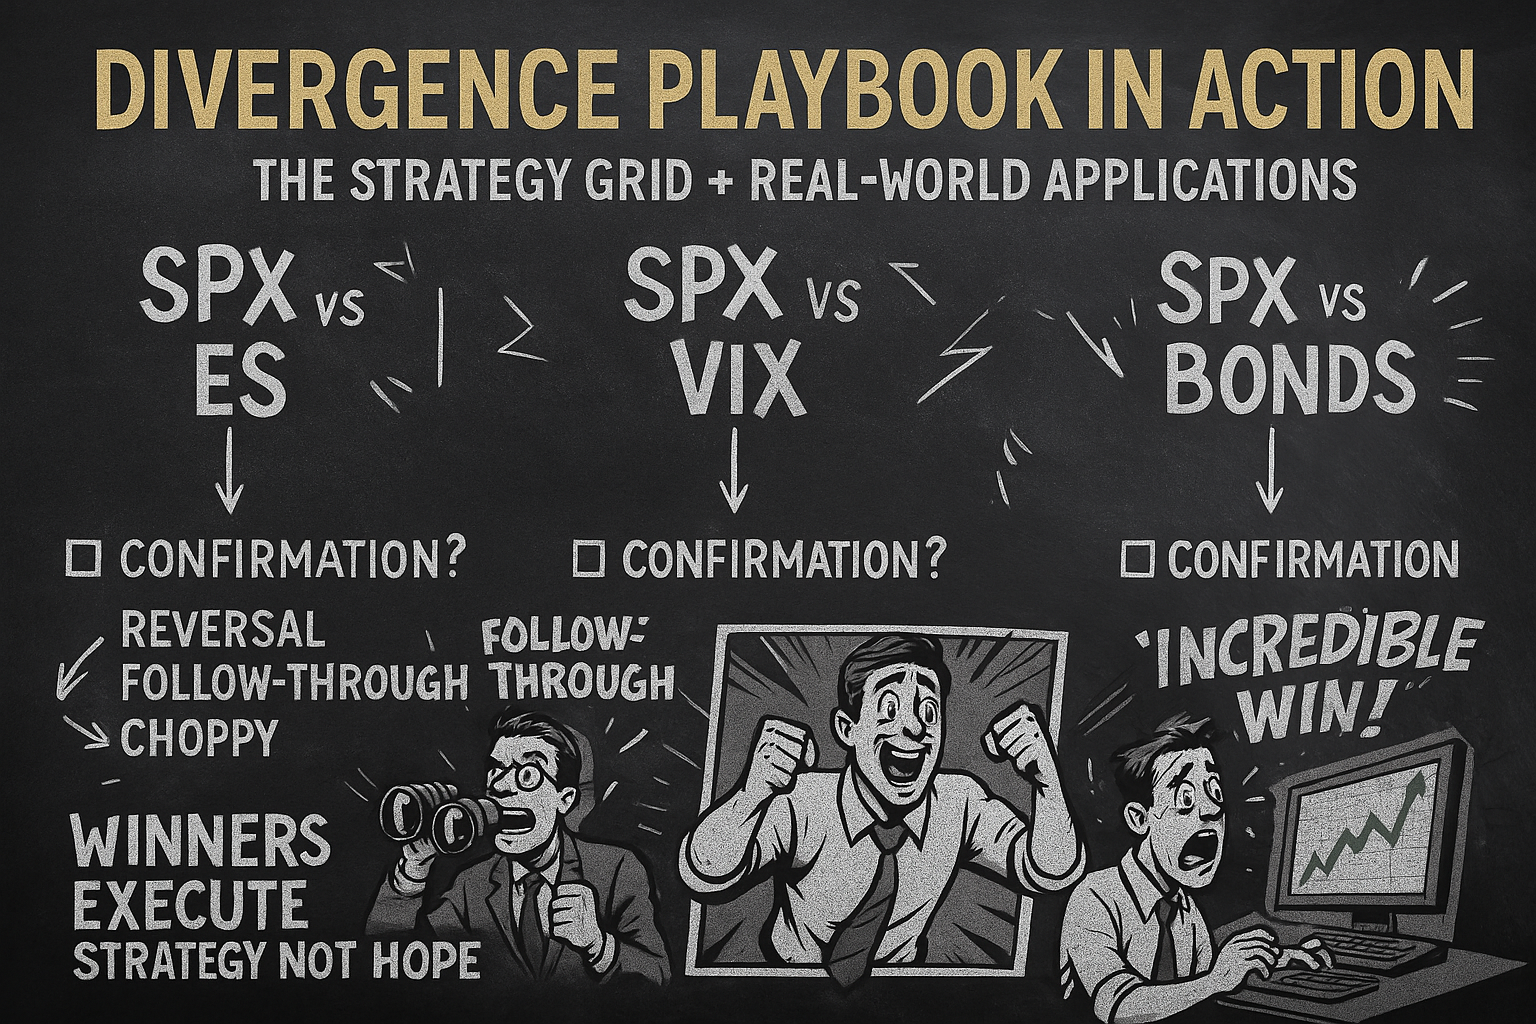
Chapter 10: Divergence Playbook in Action
THE STRATEGY GRID + REAL-WORLD APPLICATIONS
“A divergence is only as good as your plan to trade it.”
You’ve now seen 9 divergence models across SPX and its major intermarket proxies. But edge comes not from spotting – it comes from synthesizing. In this chapter, we tie it all together:
- Use-case summaries for each divergence type
- Strategy grid by market condition
- Real-world composite setups
- Daily prep checklist
- Backtest blueprint to validate any divergence system
1. THE DIVERGENCE STRATEGY GRID
| Divergence Type | Best Use Case | Timeframe | Confirmation Layer | Common Mistake |
|---|---|---|---|---|
| SPX vs ES Futures | Failed breakdown reversal | 30-60 min | Pulse bar + reclaim | Jumping before reclaim |
| SPX vs Bonds (TLT) | Macro bottom/top signal | Daily | VIX non-confirmation | Ignoring MOVE index |
| SPX vs Credit (HYG) | Pre-correction signal | Daily | Spread widening + VIX uptick | Misreading sector stress |
| SPX vs Breadth (RSP) | Fragile rally detector | Daily-Weekly | NYMO/A-D divergence + skew flat | Trading intraday |
| SPX vs VIX | Vol spike warning | Daily | VIX/SPX up correlation + gamma | Ignoring news weeks |
| SPX vs DXY | Liquidity tightening signal | Daily | DXY breakout + yield rise | No bond context |
| SPX vs Commodities | Macro risk sentiment change | Daily | Oil/Copper + sector lag | Reacting too early |
| SPX vs Internals | Breadth momentum signal | Daily | NYMO / A/D divergence + pulse bar | Treating as standalone |
| SPX vs Vol Surface | Volatility mispricing | Intraday-Daily | Skew/IV shift + pulse bar | Misreading IV solo |
2. MULTI-LAYERED COMPOSITE SETUPS
⚔️ The Macro Unwind Combo
- DXY surging
- HYG rolling over
- Skew flattening
- SPX prints false breakout with pulse bar
⚠️ Trap Rally Detector
- SPX vs RSP divergence
- VIX rises while SPX rises
- NYMO stalls
- Gamma flip zone ahead
Capitulation Fakeout
- SPX new low
- TLT holds higher low
- IV drops
- Pulse bar reclaim setup
These layered setups yield higher win rates, better R/R, and fewer false positives.
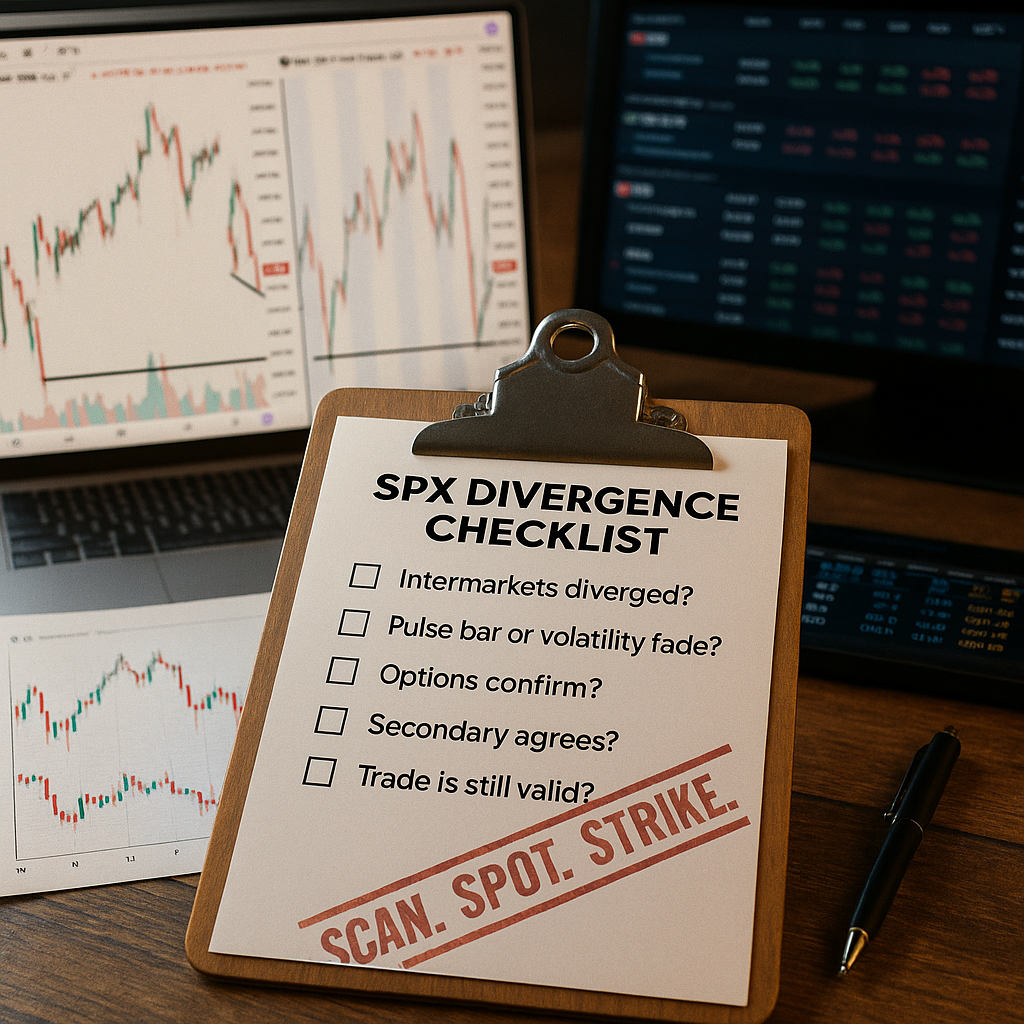
3. DAILY DIVERGENCE CHECKLIST
Morning Prep:
☐ ES vs SPX overnight lows checked
☐ DXY, TLT, HYG vs SPX direction noted
☐ NYMO and A/D divergence scanned
☐ Skew and IV Rank vs SPX trend flagged
☐ SPX structure aligned (VWAP, gamma, pulse bars)
Intraday Trigger Conditions:
☐ Pulse bar or tag-n-turn at key divergence level
☐ Confirmed by 2+ intermarket filters
☐ Risk defined, 1.5-2.5R target mapped
4. BACKTEST BLUEPRINT FOR SYSTEM VALIDATION
- Define Entry Logic
- E.g., SPX lower low + ES higher low + pulse bar
- Tag Occurrences
- Use TradingView, Koyfin, or Excel log
- Add Confirmation Layers
- Skew, IV, NYMO, gamma flip zones
- Track Outcomes
- Entry, exit, stopout, R-multiple
- Win rate, avg gain, loss, PF
- Segment by Regime
- Bull, bear, chop
- News vs no-news days
- Refine
- Adjust filters, expand conditions
- Remove weak signals
Your edge is what survives the testing.
5. FINAL THOUGHTS
Spotting divergence is an art. Trading it is a science. But mastering it – that comes from building your own version, testing it, and refining it until the guesswork is gone.
Divergence isn’t a trick. It’s a truth leak in the market – a misalignment between where price is now and what the rest of the system believes.
Track it. Validate it. Trade it mechanically.
You now have the playbook. Time to make it your weapon.
Happy trading,
Phil
Less Brain, More Gain
…and may your trades be smoother than a cashmere codpiece
p.s. There are 3 ways I can help you…
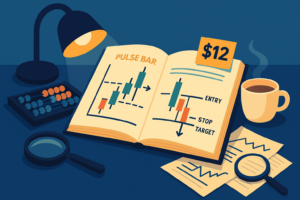
- Option 1: The SPX Income System Book (Just $12)
A complete guide to the system.
Written to be clear, concise, and immediately actionable.
>> Get the Book Here
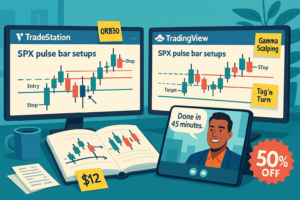
- Option 2: Full Course + Software Access – 50% off for Regular Readers – Save $998.50
Includes the video walkthroughs, tools for TradeStation & TradingView, and everything I use daily. Plus 7 additional strategies
>> Get DIY Training & Software
- Option 3: Join the Fast Forward Mentorship – 50% off for Regular Readers – Save $3,000
>> Join the Fast Forward Mentorship – trade live, twice a week, with me and the crew. PLUS Monthly on-demand 1-2-1’s
No fluff. Just profits, pulse bars, and patterns that actually work.