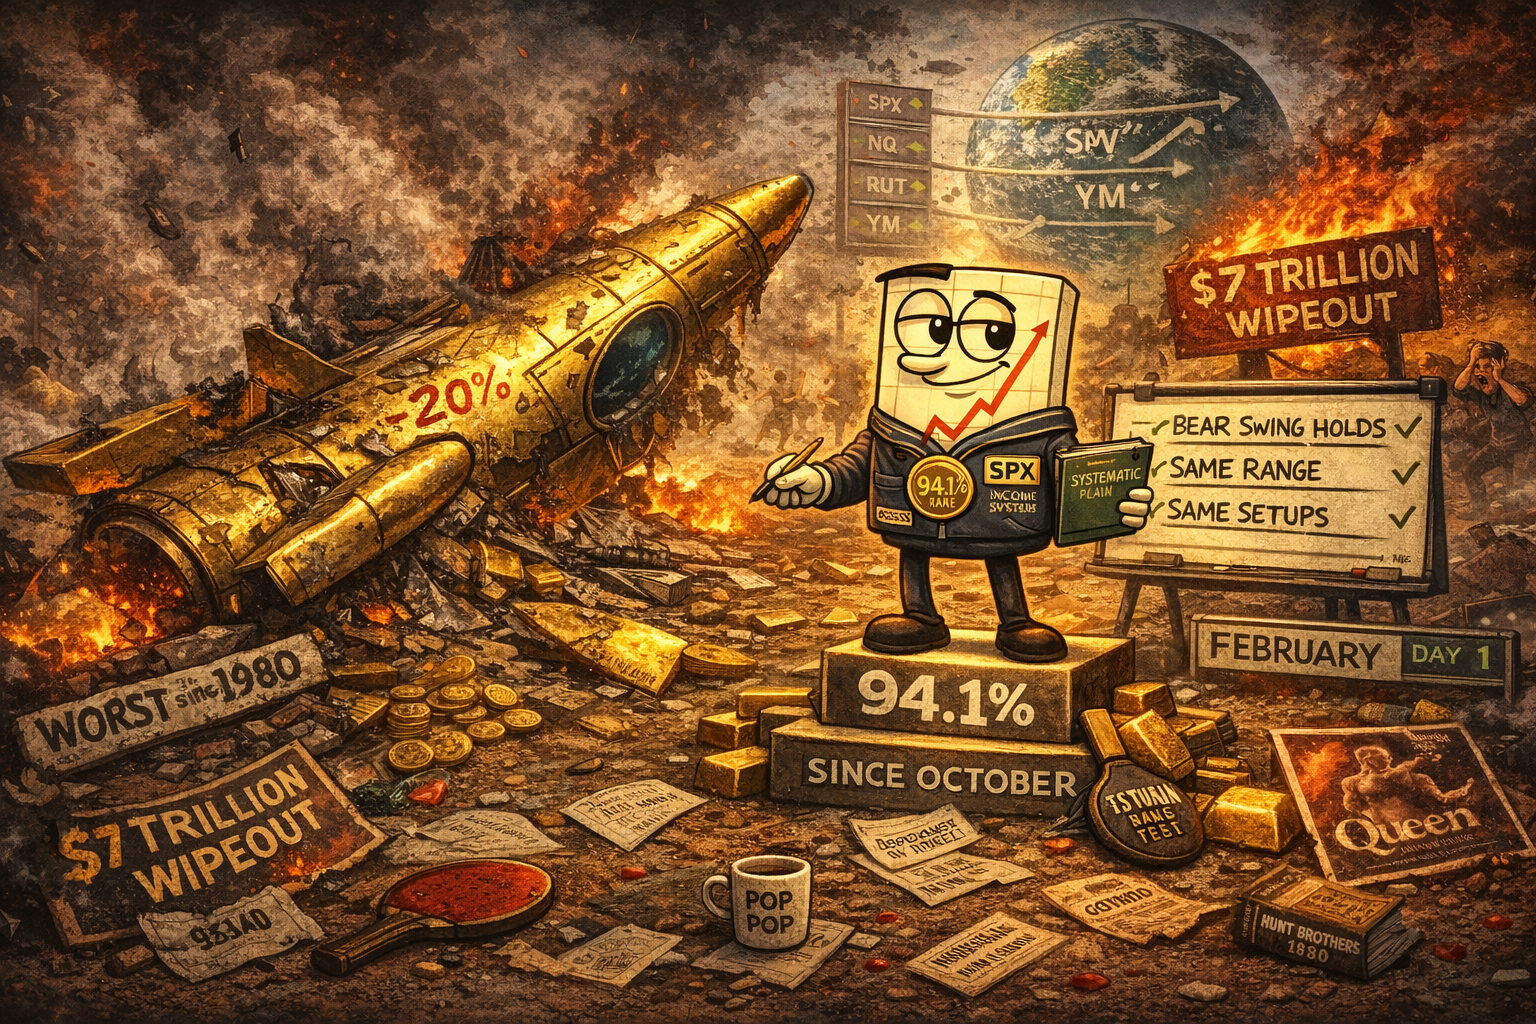
SPX Bear Swing Holds. RUT H&S Still Playing. January’s Momentum Continues.
 Ahoy there, Trader! ⚓️
It’s Phil…
I was almost expecting a Black Monday. Given the weekend crypto moves – Bitcoin breaking $80K, $2.5B in liquidations, “Black Sunday II” trending everywhere – that could have flagged the potential for something truly ugly.
And then overnight? Futures popped. Then dropped. Then bounced. Classic.
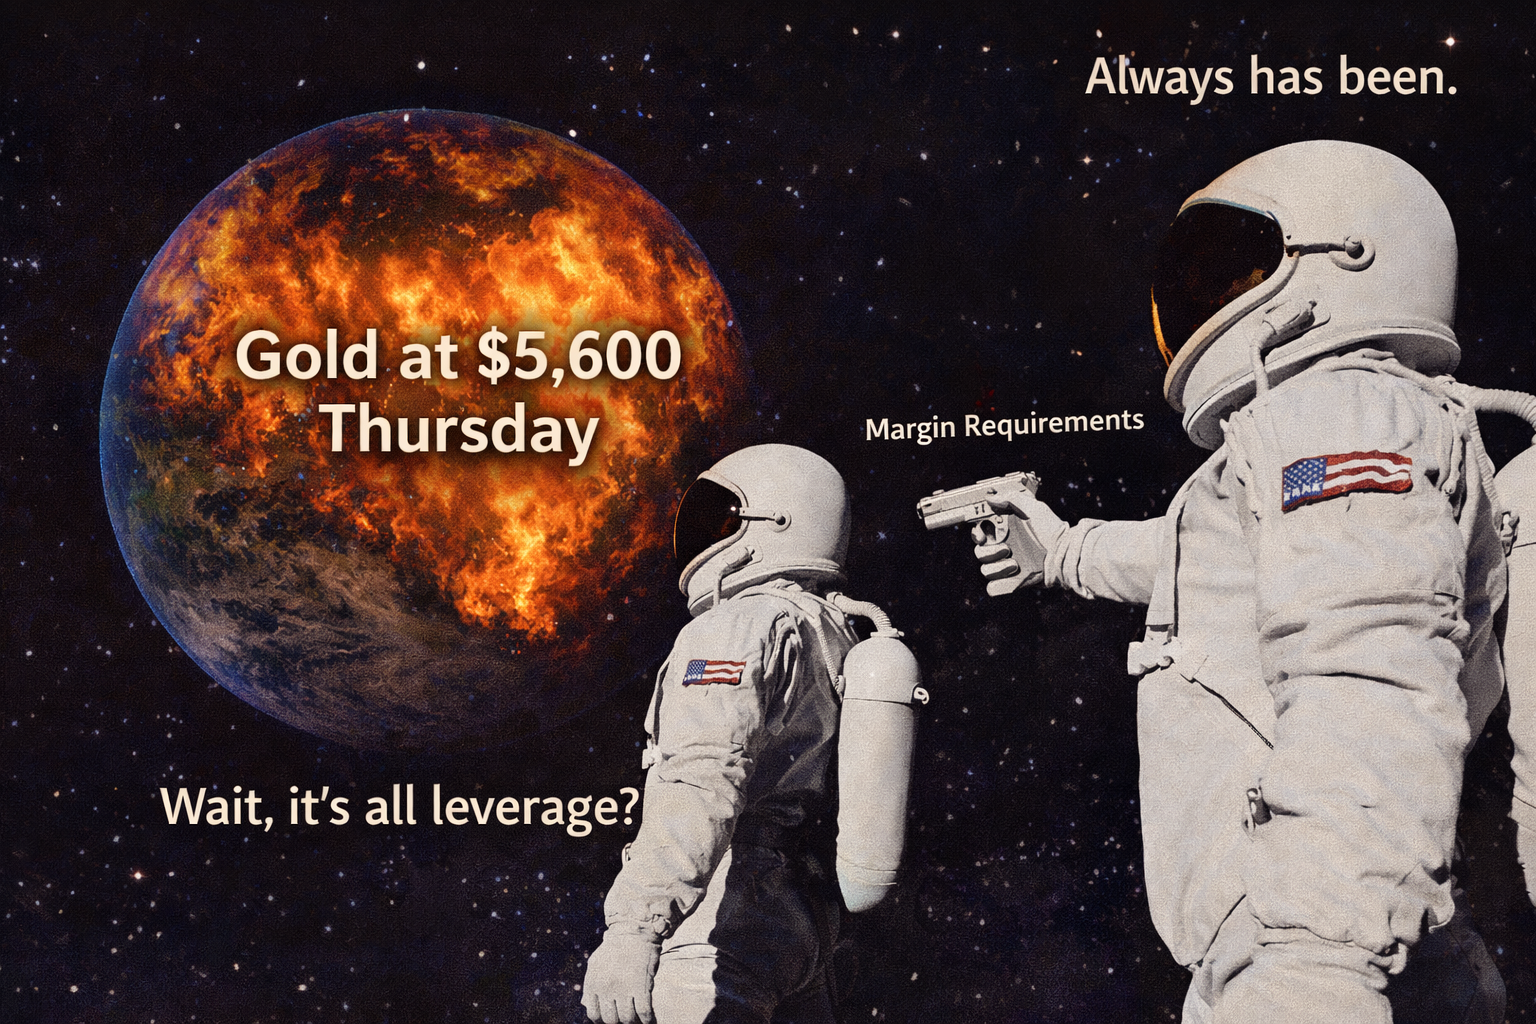
So it’s not quite the bloodbath some feared. But make no mistake – there’s still blood in the streets. Gold’s down nearly 20% from Thursday’s $5,600 peak. Silver just had its worst day since 1980. Bitcoin’s at $77K. The precious metals trade that dominated January just got absolutely demolished.
But here’s the thing: the plan is much the same as last week.
Price was at the upper range boundary. It’s now pushing lower. SPX bear swing remains. RUT bear swing remains. The head and shoulders pattern we’ve been tracking? Still playing out beautifully.
January was so much fun. Last week was really the cherry on top – 16 wins, 1 loss, and a fistful of dollars.
Now let’s see if we can keep that momentum rolling into February.
Scroll down for the systematic breakdown – same range, same setups, different month…
Market Briefing:
Multi-Market Status
SPX: Bearish at Upper Range. Current 6,939.02. Target Range Lows around 6,840 area. The bear swing from last week’s range highs continues. Price pushed off the 7,000 ceiling and is grinding lower. Same setup. Same direction. Same patience.
RUT: Bearish at Upper Range. Current 2,582.90. Target Range Lows around 2,520 area. The head and shoulders pattern is textbook perfect – left shoulder, head at NATH (2,735), right shoulder complete. Neckline broken. Now it’s just about following through to target.
ES Futures: 6,924.50 – down 0.8% premarket. Bounced off overnight lows but still red.
NQ Futures: 25,448.50 – down 1.0% premarket. Tech taking the brunt.
YM Futures: 48,891 – down 0.6% premarket. Relatively better but still bleeding.
RTY Futures: 2,603.0 – small caps getting crushed in risk-off.
Gold: $4,705.80 – DOWN NEARLY 20% FROM THURSDAY’S $5,600 PEAK. The rocket ship crashed back to earth. $7 trillion wipeout. CME raised margin requirements.
Silver: Worst day since 1980. Crashed 15%+ more overnight. All 2026 gains wiped.
VIX: 19.10 – elevated, watching the carnage, not panicking yet.
Bitcoin: $77,531 – broke $80K for first time since April. Down 40% from October peak. $2.5B liquidated in 24 hours. “Black Sunday II.”
The Precious Metals Massacre
Let’s talk about what just happened:
Thursday: Gold at $5,600. All-time highs. “Rocket ship to Mars” we said.
Friday: Gold crashes 10%. Largest single-day drop in years.
Overnight: Gold drops another 5%. Now at $4,617 (chart shows $4,705).
Total damage: Nearly 20% off the highs. $7 trillion in market cap erased. Largest precious metals wipeout since 2013.
What caused it?
- Chinese speculators triggered the initial unwind
- Trump nominated Kevin Warsh for Fed chair (hawkish tilt)
- Dollar surged on expectations of more disciplined Fed
- CME raised margin requirements – forced selling accelerated
Silver had it even worse. Worst single day since 1980. All the 2026 gains? Gone. Wiped out entirely.
This is what happens when a crowded trade unwinds. Everyone rushes for the exit at once.
The Crypto Carnage
Bitcoin didn’t just have a bad weekend. It had “Black Sunday II.”
The numbers:
- Broke below $80,000 for first time since April
- Now trading around $77,000
- Down 40% from October peak
- $2.5B in leveraged longs liquidated in 24 hours
- ETF outflows hit $1.5B weekly
- Standard Chartered warns no new ATH in 2026
Ethereum: Collapsed to $2,200 – down 54% from August high.
Solana: Crashed 9%.
Total crypto market cap: Fell to $2.66 trillion.
The “digital gold” narrative was already struggling whilst actual gold was soaring. Now both are crashing. There’s nowhere to hide.
Same Plan, New Month
Here’s what matters for us:
The range hasn’t changed. SPX was at the upper boundary. It’s pushing lower. RUT was forming a head and shoulders at all-time highs. It’s breaking down.
Last week we caught:
- 16 wins from 17 trades
- 94.1% win rate
- $391 in index points
- A 90% ROC overnight swing
The setups came from understanding where price was in the range. Upper boundary = fade opportunities. Lower boundary = bounce opportunities.
This week:
- SPX bear swing continues – target range lows
- RUT H&S continues – neckline broken, following through
- Premium Poppers ready for opening bell volatility
- Blood in streets often means elevated IV = richer premiums
The chaos creates the opportunity. We just need to stay systematic.
The Week Ahead
Economic Calendar:
| Day | Time | Event | Forecast | Previous |
|---|---|---|---|---|
| Mon 2 Feb | 10:00am | ISM Manufacturing PMI | 48.5 | 47.9 |
| Tue 3 Feb | 10:00am | JOLTS Job Openings | 7.21M | 7.15M |
| Wed 4 Feb | 8:15am | ADP Non-Farm Employment | 48K | 41K |
| Wed 4 Feb | 10:00am | ISM Services PMI | 53.6 | 54.4 |
| Thu 5 Feb | 8:30am | Unemployment Claims | 213K | 209K |
| Fri 6 Feb | 8:30am | Non-Farm Payrolls | 67K | 50K |
| Fri 6 Feb | 8:30am | Unemployment Rate | 4.4% | 4.4% |
| Fri 6 Feb | 10:00am | Consumer Sentiment | 55.4 | 56.4 |
NFP Friday is the main event. But the market might be more focused on the carnage than the calendar this week.
Earnings:
- Monday: Disney (before bell), Palantir (after close)
- Tuesday: AMD, Alphabet
- Wednesday: Alphabet, Uber
- Thursday: Amazon, Eli Lilly
- Plus 100+ other S&P 500 companies
Busy week. But earnings take backseat when everything’s bleeding.
Expert Insights
The Leverage Unwind Pattern
What we witnessed this weekend in precious metals and crypto follows a predictable pattern that repeats across markets:
- Crowded trade builds – Everyone piles into the same position (gold, silver, Bitcoin)
- Leverage accumulates – Speculators use margin to amplify returns
- Catalyst hits – Warsh nomination shifted Fed expectations, dollar surged
- Margin calls trigger – CME raised requirements, forced selling begins
- Cascade accelerates – Selling begets selling, stops get triggered
- Capitulation – 24-hour wipeout of gains built over months
The speed of the unwind reflects the amount of leverage in the system. Gold dropping 20% in three days, silver having its worst day since 1980, Bitcoin liquidating $2.5B in longs – this is what happens when a leveraged trade goes wrong.
For premium sellers, these events create opportunity. Elevated volatility means richer premiums. Fear means faster time decay collection. The key is staying systematic whilst others panic.
[Source: Market structure analysis – leverage unwind mechanics]
In Other News…
Gold Loses $7 Trillion After Weeks of “Safe Haven” Hype
Turns out hiding in shiny things only works until everyone runs for the exit.
Wall Street opened February processing the uncomfortable reality that gold—the thing everyone bought because nothing else made sense—just delivered its largest crash since 2013. The $7 trillion precious metals wipeout now spreads contagion across markets whilst Trump claims he’s “seriously talking” with Iran about de-escalation.
The Safe Haven That Wasn’t
Gold’s $7 trillion evaporation marks the biggest wipeout in over a decade. Newmont crashed 3%+ premarket as miners discovered their hedge against chaos was, in fact, also chaos. Silver joined the carnage. When the thing you bought because everything else was falling starts falling harder, the investment thesis requires urgent revision.
The Warsh Effect
Kevin Warsh’s Fed chair nomination sent yields above 4.27% and the dollar up 1%. Markets now pricing a “more disciplined Fed,” which translates to “fewer rate cuts than you hoped.” Treasury curve steepening whilst credit spreads widen—the classic cocktail nobody ordered.
️ De-Escalation Discount
Oil dropped 3-4% after Trump signalled Iran talks are “seriously” happening. WTI at $63, Brent at $67. When geopolitical risk premium evaporates overnight on diplomatic optimism, either peace is imminent or someone’s being optimistic with the word “seriously.”
☕ Hazel’s Take
Disney reports expecting -11% EPS whilst announcing CEO succession. AMD, Alphabet, Amazon queue behind. January finished positive—S&P +1.2%—but February’s opening suggests that was merely the calm before whatever this is.
—Hazel, FinNuts

Rumour Has It…
The Financial Nuts Newsroom looks like a disaster relief centre…
Percy is staring at the gold chart in disbelief. “It was at fifty-six hundred. Thursday. THURSDAY. Now it’s… what is that, forty-seven hundred? What happened?”
Hazel doesn’t look up from her screens. “Leverage happened. Crowded trade happened. Warsh nomination happened. Same thing that always happens.” She pauses. “The rocket ship ran out of fuel.”
Mac raises his glass – it’s fuller than usual this morning. “Black Sunday II they’re calling it. Bitcoin broke eighty thousand. Two and a half billion liquidated. And we’re supposed to act surprised?” He shakes his head. “Leverage always unwinds eventually.”
Kash is already scanning for Popper setups. “Blood in the streets means elevated IV. Elevated IV means richer premiums. Same plan as last week. Bear swings holding. Let’s go.”
Wallie has his RUT chart up with the head and shoulders pattern highlighted. “Left shoulder. Head. Right shoulder. Neckline broken. This is playing out exactly like we drew it.” He looks almost happy. “Sometimes the patterns actually work.”
The newsroom collectively takes a breath. February just started, and it’s already intense.
This is entirely made-up satire. Probably!
Breaking scoops courtesy of the Financial Nuts Newswire-because who needs sanity?

Fun Fact:
Silver’s Worst Day Since 1980 – Historical Context
Silver’s crash this weekend was its worst single-day percentage decline since March 27, 1980 – when the Hunt Brothers’ attempt to corner the silver market spectacularly collapsed.
In 1980, the Hunt Brothers had accumulated approximately 100 million ounces of silver, driving prices from $6 to nearly $50 per ounce. When regulators changed margin requirements (sound familiar?), the forced selling triggered a 50% crash in days.
This weekend’s pattern echoes that history: a crowded speculative position, regulatory margin changes (CME raised requirements), and a cascade of forced liquidations.
The difference? In 1980, it was two brothers trying to corner a market. In 2026, it was millions of retail speculators across gold, silver, and crypto all discovering simultaneously that leverage works both ways.
[Source: Historical commodities data – Hunt Brothers silver crisis, CME margin requirement changes]
Meme of the Day:
Happy trading,
Phil
Less Brain, More Gain
…and may your trades be smoother than a cashmere codpiece
p.s. There are 3 ways I can help you…
- Option 1: The SPX Income System Book (Just $12)
A complete guide to the system.
Written to be clear, concise, and immediately actionable.
>> Get the Book Here
- Option 2: Full Course + Software Access – 50% off for Regular Readers – Save $998.50
Includes the video walkthroughs, tools for TradeStation & TradingView, and everything I use daily. Plus 7 additional strategies
>> Get DIY Training & Software

- Option 3: Join the Fast Forward Mentorship – 50% off for Regular Readers – Save $3,000
>> Join the Fast Forward Mentorship – trade live, twice a week, with me and the crew. PLUS Monthly on-demand 1-2-1’s
No fluff. Just profits, pulse bars, and patterns that actually work.