Every Oil Shock Since 1973 Has Trapped the Fed – And They Got It Wrong Nearly Every Time
 Ahoy there, Trader! ⚓️
It’s Phil…
Right then. Let’s talk about the elephant in the room. The elephant wearing a “FED POLICY” name badge, standing on a barrel of crude oil, with one foot on the brake and the other on the accelerator.
President Trump wants rate cuts. He’s been banging on about it for months. His entire economic agenda – cheaper borrowing, revived growth, a roaring stock market into the midterms – depends on the Fed loosening the monetary spigots.
His Iran war may have just made that impossible.
And here’s the thing that should genuinely concern every trader reading this: the Fed has been in this exact position before. Multiple times. During the 1973 Arab Oil Embargo. The 1979 Iranian Revolution. The 1990 Gulf War. The 2008 demand shock.
They got it wrong nearly every single time.
Not slightly wrong. Catastrophically wrong. Wrong in ways that deepened recessions, crushed markets, and destroyed the savings of millions of people.
And the indicators today are flashing the same signals that preceded every one of those policy disasters.
Let me walk you through it. Because if history teaches us anything, it’s that the Fed is about to face a choice – and the odds of them making the right one are genuinely terrible.
Keep scrolling – this one matters more than you think…
When the Fed Faces an Oil Shock, History Says They’ll Get It Wrong. Here’s Why That Should Terrify You.
The Devil and the Deep Blue Sea
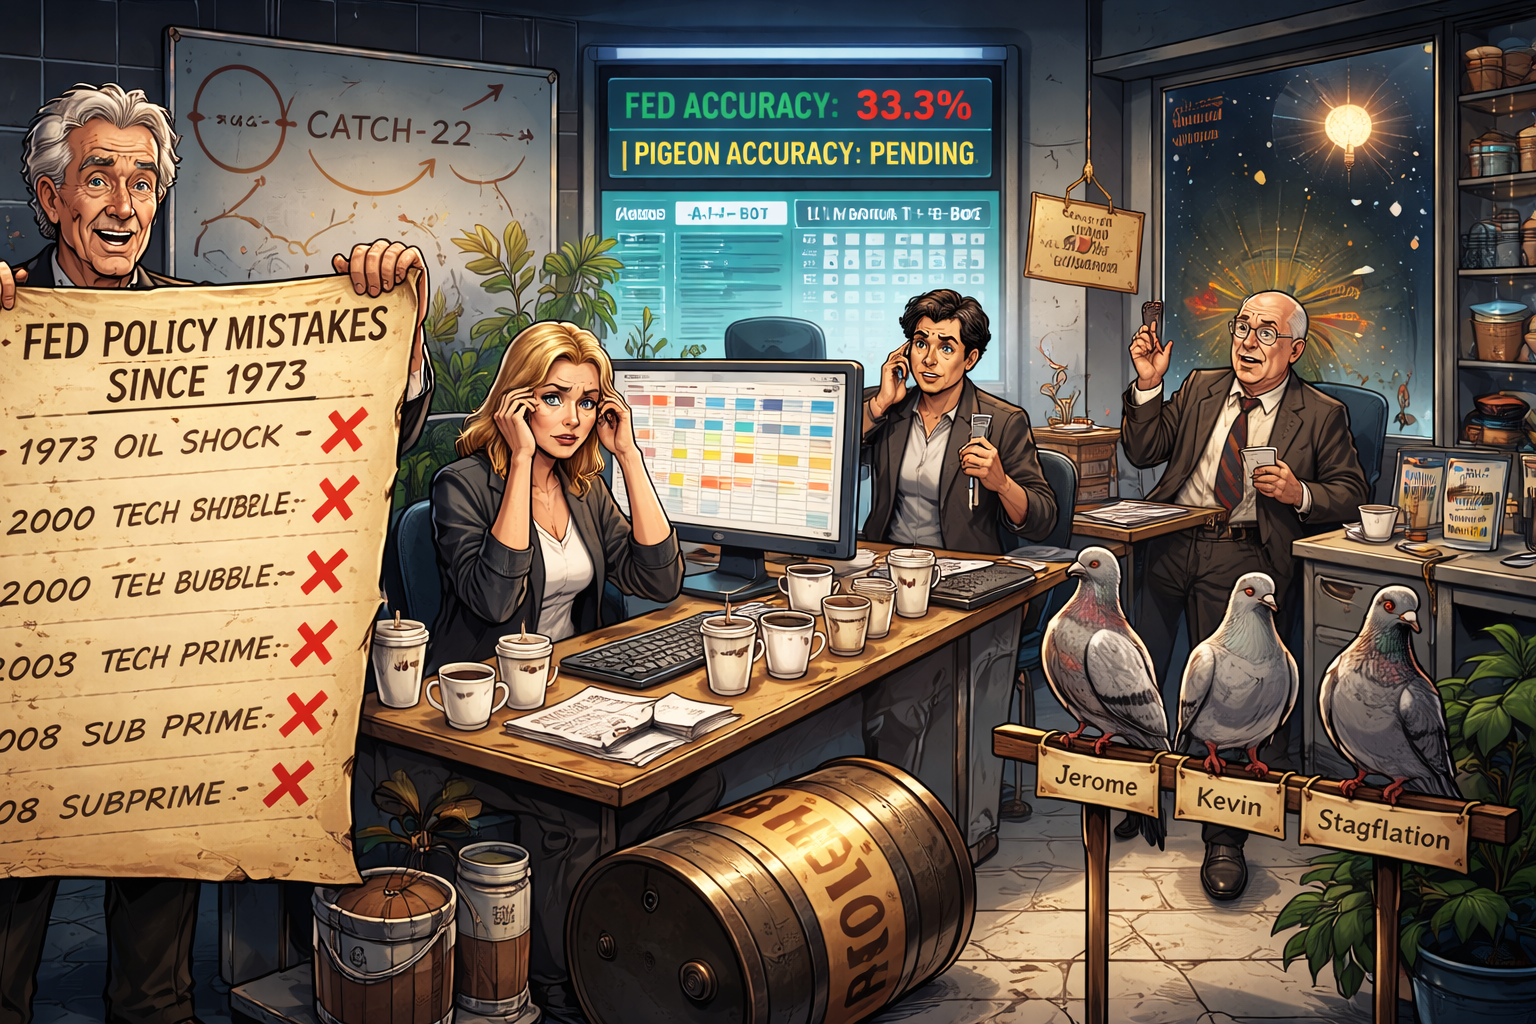
Economists love their metaphors. Catch-22. Between a rock and a hard place. Between Scylla and Charybdis. Pick your poison.
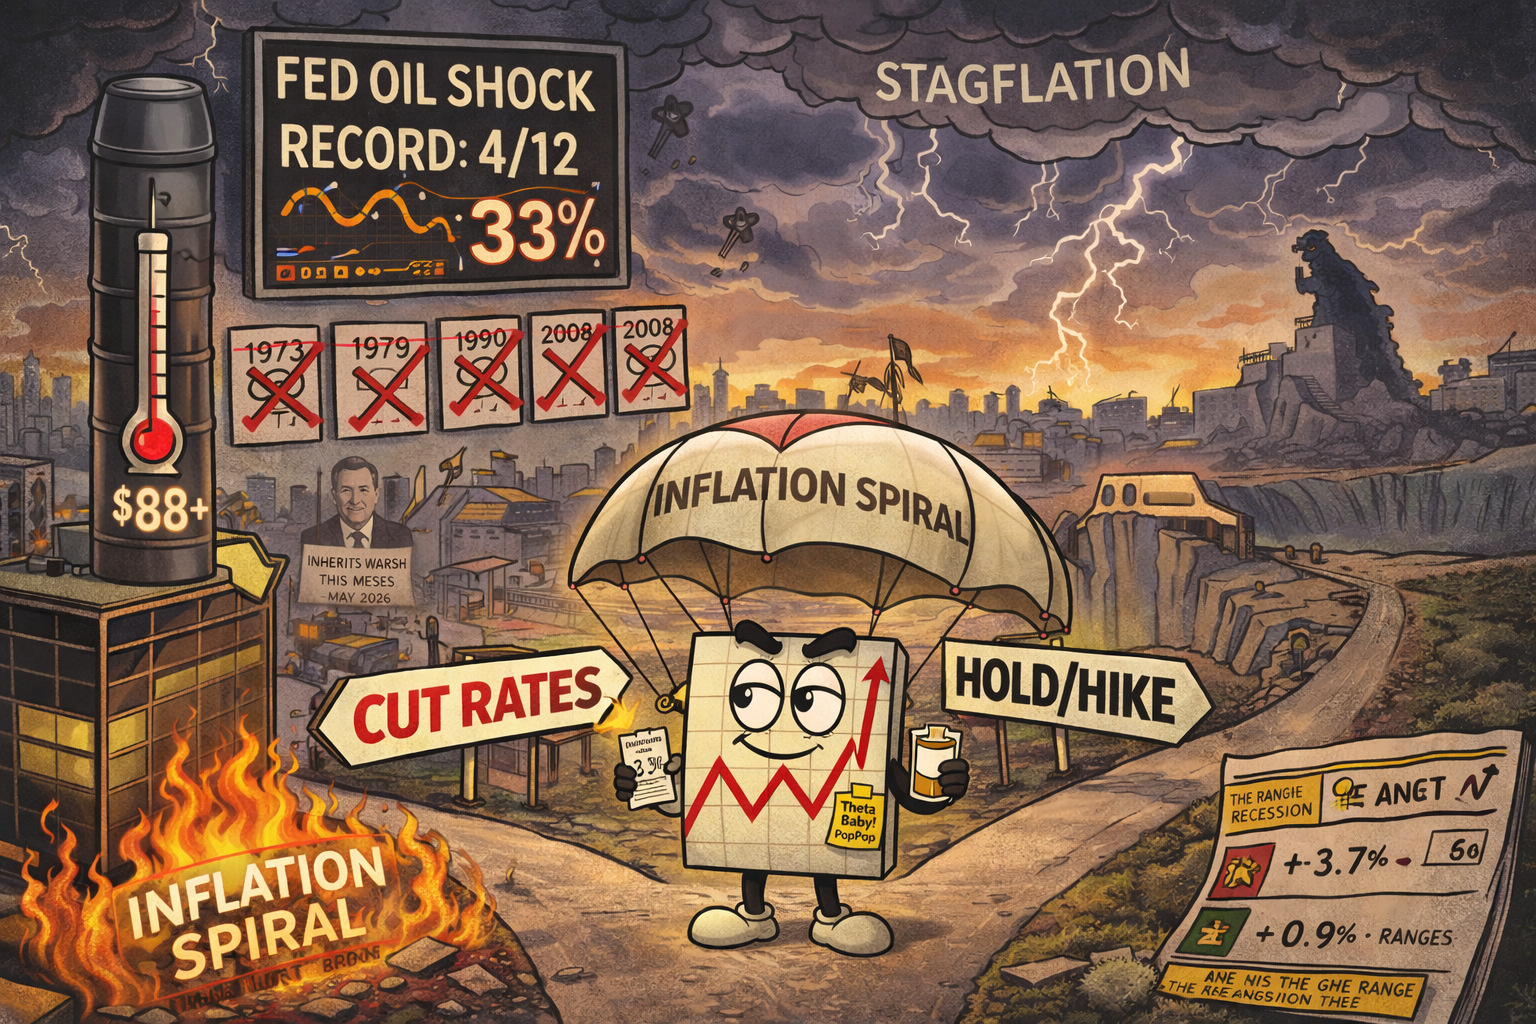
They’re all describing the same thing: stagflation.
An economy where growth is slowing and inflation is rising simultaneously. The nightmare scenario for any central banker because the two standard tools – cut rates to support growth, or raise rates to fight inflation – directly contradict each other.
Cut rates? You pour petrol on the inflation fire. Raise rates? You strangle an already weakening economy. Hold rates? You do nothing while both problems get worse.
There is no good answer. Only less bad ones.
And right now, the U.S. economy is walking straight into exactly this trap.
Leading vs Coincident: The Ship Analogy
Think of the economy like a ship. Two instruments tell you what’s happening.
Leading indicators are the horizon – they tell you what’s coming. Think new orders, building permits, stock prices, consumer expectations, the yield curve. These move months before the economy actually turns.
Coincident indicators are your speedometer – they tell you how fast you’re currently moving. Think employment, industrial production, personal income, real sales. These reflect the economy right now.
Here’s the current reading on both:
Leading economic indicators: falling 3.7% annually. Coincident economic indicators: growing just 0.9% annually.
That combination is the economic equivalent of seeing icebergs on the horizon while your ship is still cruising at decent speed. You haven’t hit anything yet – but the lookout is screaming.
Using this framework, here’s when the Fed should change course:
Hold rates when leading indicators drop below 2% but coincident indicators stay above 2%. The economy is still growing, but momentum is fading. Don’t cut yet – but stop tightening.
Cut rates when leading indicators fall below 0% and coincident indicators drop below 2%. The economy is heading toward recession. Act now or it gets worse.
By both measures, the Fed should already be cutting rates.
Leading at -3.7%? Deep in cut territory. Coincident at 0.9%? Below the 2% threshold.
The problem? Now add an oil shock on top.
The Fed’s Report Card During Oil Shocks: 4 out of 12. That’s 33%.
This is where it gets genuinely alarming. Because we can look at what the indicators recommended and what the Fed actually did during every major oil shock since the 1970s.
The results are damning.
1973-74 Arab Oil Embargo
The indicators said: hold rates through late 1973 and early 1974, then cut as the economy weakened.
What the Fed actually did: Held rates correctly in Q4 1973 and Q1 1974. Then hiked rates in Q2 and Q3 1974 when they should have been cutting.
Why did they hike? Because the oil crisis had sent inflation surging from 8.3% to 11.4%. The Fed panicked about prices and tightened straight into a weakening economy.
Result: The 1973-75 recession deepened substantially. Markets got destroyed.
Scorecard: 2 correct, 2 incorrect.
1979-80 Iranian Oil Embargo
The indicators said: hold rates through mid-1979, then cut as the economy rolled over.
What the Fed actually did: Held rates correctly in Q2 1979. Then hiked rates aggressively through Q3 1979, Q4 1979, and Q1 1980 – the exact opposite of what was needed.
Why did they hike? The oil shock sent inflation exploding from 10.7% to 14.3%. Paul Volcker had just taken over and was determined to break the back of inflation regardless of the economic cost.
Result: The 1980 recession.
Scorecard: 1 correct, 3 incorrect.
1990 Gulf War
The indicators said: cut rates immediately in Q3 1990.
What the Fed actually did: Held rates in Q3 when they should have been cutting. Only started cutting in Q4 – a full quarter behind the curve.
Why did they hold? The oil spike from Iraq’s invasion of Kuwait pushed inflation from 5.5% to 6.3%. The Fed froze.
Result: The 1990-91 recession deepened because relief arrived too late.
Scorecard: 1 correct, 1 incorrect.
2008 Oil Demand Shock
The indicators said: cut rates urgently in Q2 and Q3 2008.
What the Fed actually did: Held rates through both quarters when aggressive cutting was needed.
Why did they hold? Oil had surged to $147 per barrel, pushing inflation from 4.4% to 5.3%. The Fed was worried about inflation expectations becoming unanchored.
Result: The 2007-09 Great Recession deepened catastrophically. Lehman Brothers collapsed in September 2008 – right in the middle of the Fed’s policy paralysis.
Scorecard: 0 correct, 2 incorrect.
Overall Record: 4 correct out of 12 quarters. That’s a 33% hit rate.
The Fed gets it wrong two-thirds of the time during oil shocks. And the pattern is always the same: they see inflation spiking from oil, they panic about prices, and they either tighten or freeze when the economy desperately needs support.
Every single time, the recession got worse.
Fast Forward to March 2026
Now layer today’s situation on top of that historical pattern and ask yourself: does the Fed look like it’s about to break the streak?
Here’s where we stand:
Current Fed Funds Rate: 3.50% to 3.75% (held in January after three consecutive cuts in late 2025).
[Source: TheStreet – “Oil shock, inflation threaten Fed rate cuts under Warsh”]
CPI inflation: 2.4% year-on-year as of January 2026. Already above the Fed’s 2% target.
[Source: TheStreet – “US Economy: IMF Warns Oil Shock Could Lift Inflation Again”]
ISM Manufacturing prices: jumped to 70.5 in February – a screaming inflation signal from the real economy.
Gasoline: jumped 11 cents in one day to $3.11 per gallon on March 3rd – the largest single-day increase since Hurricane Katrina in 2005.
CME FedWatch: less than 4% probability of a rate cut in March. Rate cut expectations have been pushed back from July to September at the earliest. Some bond options traders are now betting the Fed may not cut at all this year.
[Source: Bloomberg – “Global Bond Rout Grows as Oil Jump Upends Interest-Rate Outlook”]
And oil is still climbing. If Hormuz stays disrupted and oil pushes toward $100+ as analysts at Barclays, UBS, and Goldman are now modelling, inflation could jump from 2.4% toward 4-5%.
At which point the Fed is right back in the same trap that produced recessions in 1974, 1980, 1991, and 2008.
Cut rates → inflation spirals higher. Hold rates → economy slides into recession. Hike rates → economy crashes.
The Warsh Problem
Here’s the twist nobody’s talking about enough.
Jerome Powell’s term as Fed Chair ends in mid-May. Kevin Warsh – Trump’s pick – is expected to take over around May 15th, pending Senate confirmation.
[Source: CNBC – “Trump officially nominates Kevin Warsh as Fed chair”]
Warsh was Trump’s man specifically because he’s been vocally supportive of rate cuts. He’s argued that productivity gains from AI should allow the economy to grow without inflation, enabling the Fed to ease. Trump wants cheaper money. Warsh was supposed to deliver it.
But Warsh walks into office in May inheriting the worst possible hand.
An oil shock driving inflation higher. An economy showing signs of stagflation. Bond markets pricing in no cuts. A war in the Middle East with no clear endpoint. And a president who will expect rate cuts regardless of what the data says.
Here’s the beautiful irony: Warsh built his reputation on criticising the Fed for being too loose with monetary policy after 2008. He was the hawk’s hawk. He wanted tighter policy, smaller balance sheets, harder money.
Now he needs to cut rates into an inflation shock – or watch the economy slide into recession while the president tweets about it.
One Apollo Global Management analyst summed it up perfectly: “Stagflation is the ultimate nightmare for a central banker. You have two fires burning in opposite directions, and you only have one fire extinguisher.”
What This Means for Markets
The Fed’s historical track record during oil shocks isn’t just an academic curiosity. It has direct portfolio implications.
If the Fed repeats the 1974/1980 mistake and tightens (or refuses to cut) in the face of oil-driven inflation, the economy weakens further. Equity markets face sustained pressure. Growth stocks and small caps get crushed. Defensive sectors and energy outperform.
If the Fed repeats the 2008 mistake and freezes – holding rates while they “gather more data” and “wait for clarity” – they fall behind the curve. By the time they act, the recession is already deepening and rate cuts become emergency measures rather than preventive medicine.
If the Fed somehow gets it right – cutting pre-emptively to support growth while communicating that the oil-driven inflation is temporary and transitory (where have we heard that word before?) – markets could stabilise and recover.
The historical probability of option three? About 33%.
For systematic traders, the takeaway is straightforward. Don’t bet on the Fed getting it right. Build a system that works regardless.
Elevated VIX means fatter premiums. Wider ranges mean more opportunities. Headline-driven volatility means mechanical setups outperform discretionary guesswork by an even wider margin than usual.
The Fed will do whatever the Fed does. Your job is to trade what’s in front of you.
The Bottom Line
The Fed has faced oil-shock stagflation four times since 1973.
They got the policy call right in 4 out of 12 quarters. That’s a 33% success rate. If your trading system had a 33% win rate, you’d bin it.
But you can’t bin the Fed. They’re the only game in town. And they’re about to face the same impossible choice with a new chairman who’s never led the institution through a crisis.
Leading indicators say cut. Oil says don’t. Inflation says hold. The economy says hurry.
History says they’ll freeze. Then cut too late. Then the recession deepens.
Your job isn’t to predict what they’ll do. Your job is to have a system that works regardless.
The range is the range. The setup is the setup. The premium is the premium.
Follow the process. Ignore the Fed. Trade what’s in front of you.
Done by lunch. As always.
Expert Insights:
“The four most dangerous words in investing are: ‘This time it’s different.'” – Sir John Templeton
It’s never different. The oil shock happens. Inflation spikes. The Fed faces the same impossible choice. They make the same mistakes. The recession deepens.
The only thing that changes is the names on the doors. Burns in 1974. Volcker in 1980. Greenspan in 1990. Bernanke in 2008. And now Warsh in 2026.
The pattern is mechanical. The outcome is predictable. The only question is whether you’re positioned for it or pretending it won’t happen.
Systematic traders don’t need to predict the Fed. They need to recognise the environment, adjust their risk parameters, and let the setups do the work.
Rumour Has It…
From the Financial Nuts Newsdesk…
EXCLUSIVE: Wallie arrived at the newsdesk this morning holding a copy of his handwritten “Fed Policy Mistakes” chart going back to 1973. He’d been maintaining it on actual parchment since the Nixon era. “I called every single one of these,” he declared, tapping the chart with his reading glasses. “Also, I shorted Enron.” When reminded that being right about Enron doesn’t make him right about monetary policy, he replied: “It makes me right about everything. Permanently.”
Hazel had been up since 2am running her own leading/coincident indicator models. Her spreadsheet had 47 tabs, three of which were colour-coded in a system only she understood. “The indicators are screaming for cuts. The oil data is screaming against cuts. The Fed will do neither effectively,” she said, before adding with terrifying precision: “They’ll hold in March, hold in May, and cut in September – exactly one quarter too late. Just like 1990.” She then poured another espresso and started a new tab.
Percy had overheard the words “leading indicators” and mistakenly believed this referred to which pigeon was flying in front. He spent the morning constructing what he called a “Pigeon Forward Guidance Index” consisting of three birds named Jerome, Kevin, and Stagflation. “When Jerome flies left and Kevin flies right, the Fed is split,” he explained. Nobody had the heart to tell him the birds were all flying toward the sandwich shop.
Kash was excited because he’d heard “rate cuts” mentioned and immediately started planning his leveraged crypto position. “If the Fed cuts, Bitcoin goes to $150K easy,” he announced. Hazel pointed out that the whole article was about why the Fed probably won’t cut. Kash went quiet for approximately four seconds before declaring: “Even better. The surprise cut will be even more bullish.”
Mac raised his whisky glass and declared the entire situation “rather like 1929, but with better cocktails.” When asked to elaborate on the Fed’s policy dilemma, he said: “Darlings, central bankers are like bartenders. They always cut you off one drink too late.”
Cache-AI-Bot processed all Fed policy decisions during oil shocks from 1973 to 2026 and concluded: “Beep. Historical probability of correct Fed action during oil price shock: 33.3%. Historical probability of Percy’s pigeons outperforming the Fed: pending data collection. Current recommendation: do not rely on either. Beep-Beep.”
This is entirely made-up satire. Probably!
Breaking scoops courtesy of the Financial Nuts Newswire-because who needs sanity?
Fun Fact:
Happy trading,
Phil
Less Brain, More Gain
…and may your trades be smoother than a cashmere codpiece
p.s. There are 3 ways I can help you…
- Option 1: The SPX Income System Book (Just $12)
A complete guide to the system.
Written to be clear, concise, and immediately actionable.
>> Get the Book Here
- Option 2: Full Course + Software Access – 50% off for Regular Readers – Save $998.50
Includes the video walkthroughs, tools for TradeStation & TradingView, and everything I use daily. Plus 7 additional strategies
>> Get DIY Training & Software
- Option 3: Join the Fast Forward Mentorship – 50% off for Regular Readers – Save $3,000
>> Join the Fast Forward Mentorship – trade live, twice a week, with me and the crew. PLUS Monthly on-demand 1-2-1’s
No fluff. Just profits, pulse bars, and patterns that actually work.