I’m Not Smart Enough to Know Why – I Do Know the Patterns Keep Repeating
 Ahoy there, Trader! ⚓️
It’s Phil…
Welcome back. I’ve just returned from wedding anniversary travels – and the world decided to start a war whilst I was away. Cheers for that.
War on or war off? The markets don’t seem to know what to do. Generally speaking there’s usually a knee-jerk panic sell-off followed by a war rally. I don’t quite see either of those things just yet.
And if we get right down to brass tacks – there’s not a lot of new movement as price is still contained in their ranges. The only thing that’s popped out slightly is VIX, which peaked at 28 before settling to 23.
Meanwhile, Korea had its worst day in recorded history – KOSPI crashed 12.06%, eclipsing even 9/11’s 12.02% sell-off. Samsung -11.7%. SK Hynix -9.6%. Circuit breakers triggered. The AI chip trade that powered Korea to 40%+ YTD gains in six weeks? Vaporised in two sessions.
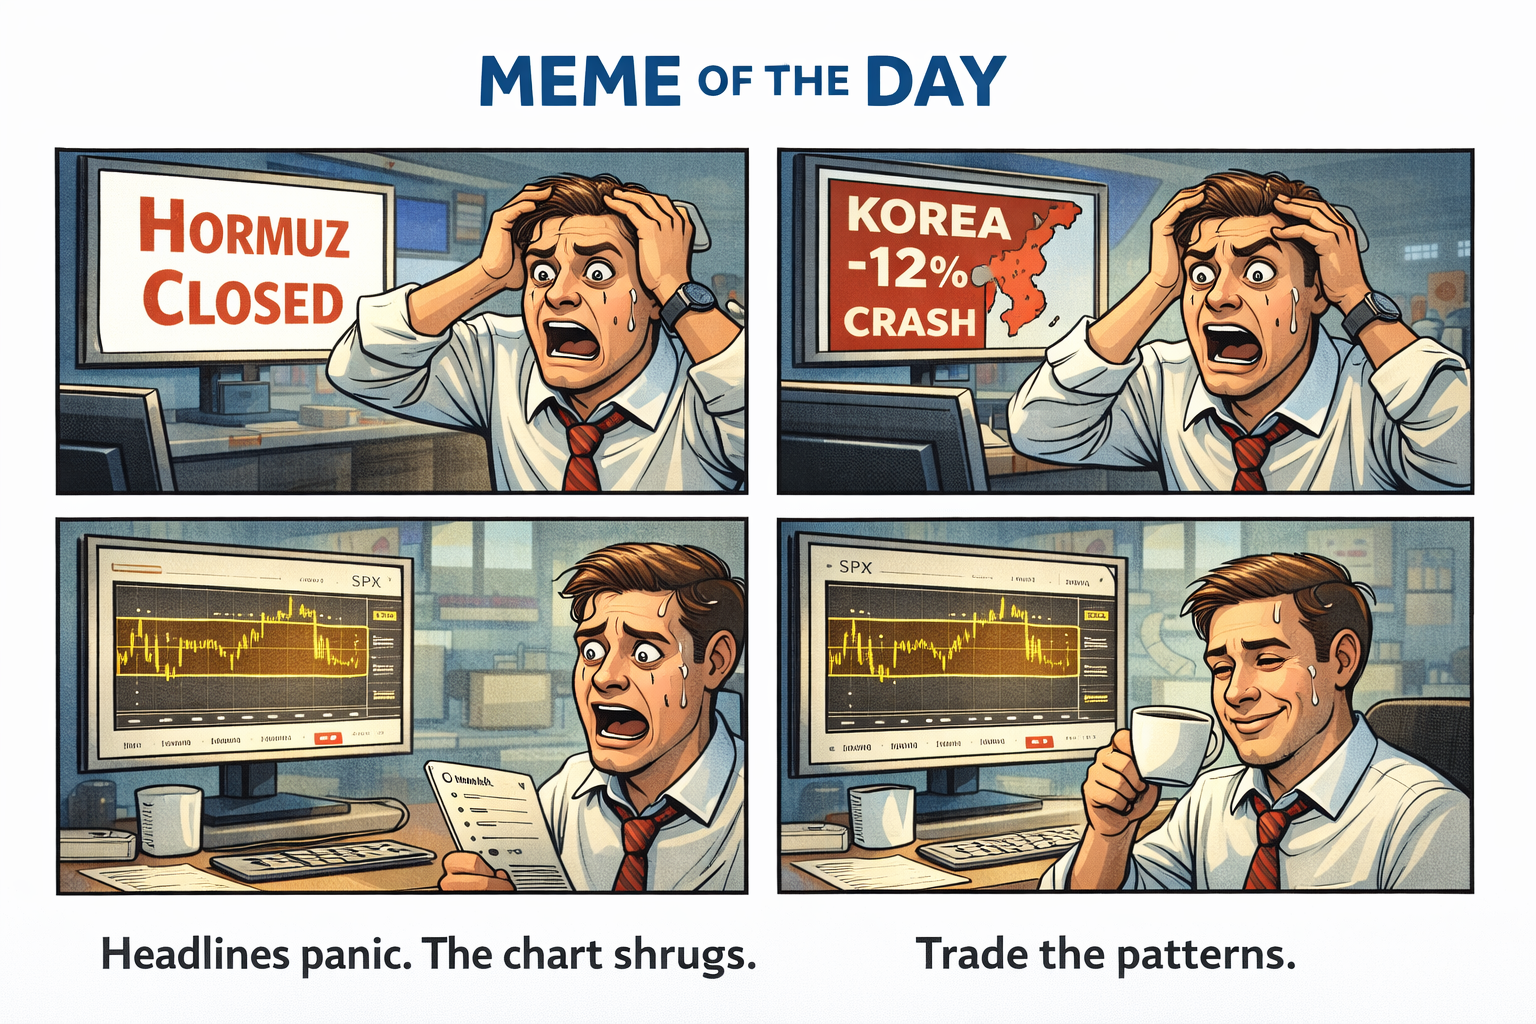
Ah well. I’m not smart enough to know what’s going on or why. I do know that price charts keep showing repeatable patterns over and over again that are tradeable.
Monday, while out getting a last hike in before heading home – and we saw the first post-war reaction from the markets – the Premium Poppers and bear swings delivered. Bear swings cashing out. Bullish Premium Poppers on the bounce. Lovely.
Fast forward to now, back at home, and the swing assessment I left last Thursday is still relatively the same. There are clear sideways ranges on both SPX and RUT. Monday’s gap down only went as far as the range lows (overnight futures went a LOT further) so technically hadn’t broken out. Tuesday’s gap down did break out – and the subsequent rally puts it back into the range with a possible break-in setup.
#1 and #2 respectively on both charts.
Given the huge daily rejection bar, I’ll be anticipating a narrow ranging day – which could still have wide volatility in context to the last few days.
So unless this is the dead cat bounce… then pause… then drop on Friday’s NFP… ah feck it. I give up trying to figure out what’s going on. Just trade the charts and look at the results data.
PopPop.
Korea crashed 12%. Hormuz is burning. SPX is still in its range. Trade the charts.
Market Briefing:
Day Five – Operation Epic Fury
For those catching up after the weekend: the world changed on February 28th.
US-Israeli strikes killed Iran’s Supreme Leader Khamenei. Tehran’s IRGC declared the Strait of Hormuz closed. Five tankers damaged. Two crew dead. 150 ships anchored. Maersk, MSC, Hapag-Lloyd and CMA CGM all suspended transits. Marine war risk insurance pulled.
[Source: Wikipedia – 2026 Strait of Hormuz crisis; CNBC – “Oil supertanker rates soar”]
The numbers since Friday: WTI from $67 to $74.56. Brent hit $81.40, up 10% in two days. European gas surged 30%. Qatar halted LNG production after strikes on its facilities. Barclays has flagged $100 Brent if Hormuz stays shut for weeks.
[Source: Al Jazeera – “Shutdown of Hormuz Strait”; TIME – “Strait of Hormuz Global Oil”]
Korea took the worst hit. KOSPI crashed 12.06% Wednesday (today, Asian time) – worst single-day crash in history, eclipsing 9/11’s 12.02%. This after a 7.2% drop Tuesday. Circuit breakers triggered within minutes. Samsung -11.7%. SK Hynix -9.6%. The index hit record highs just last week. Samsung and SK Hynix make up nearly 50% of the KOSPI – and Korea imports 98% of its fossil fuels, 70% of its crude from the Middle East via Hormuz.
[Source: CNBC – “South Korea’s Kospi sinks over 12%”; European Business Magazine – “South Korean Stocks Plunge 12%”]
US markets? Relatively contained. Tuesday’s close: SPX -0.94% to 6,816.63. Dow -0.83% to 48,501.27. Nasdaq -1.02% to 22,516.69. VIX peaked at 28, settled to 23. Futures this morning are +0.2% near 6,820. Not the panic you’d expect given the headlines.
Defence wins. Lockheed Martin, Northrop Grumman, RTX all surging. Energy wins. Exxon, Chevron up 4%+. Tanker stocks flying – Frontline +5%, DHT +7%.
Bright spot: Ross Stores and Target both beat after close Tuesday. Comps +9% and EPS beat respectively. Consumer still spending. Off-price retail validated on tariff-glut tailwinds.
But Here’s What Actually Matters – the Ranges Hold
Strip away the noise and look at the price action.
Monday’s gap down went to range lows. The overnight futures went a LOT further – but the cash session held the range lows. That’s important. The range boundary acted as support exactly where it should.
Tuesday’s gap down broke out of the range – briefly. But the subsequent rally put price back into the range. That’s a classic break-in setup. Break out, fail, reverse back in. I’ve marked these as #1 (the range low test) and #2 (the breakout-then-breakin) on both SPX and RUT charts.
This is one of the 6 Money Making Patterns. The range is the range until price breaks out with conviction. A single-candle breakout that immediately reverses back in is a false break – and those are tradeable in the opposite direction.
Given Tuesday’s huge daily rejection bar – a long lower wick showing aggressive buying at the lows – I’ll be anticipating a narrow ranging day today. Wide volatility by recent standards could still mean narrow relative to the past few sessions.
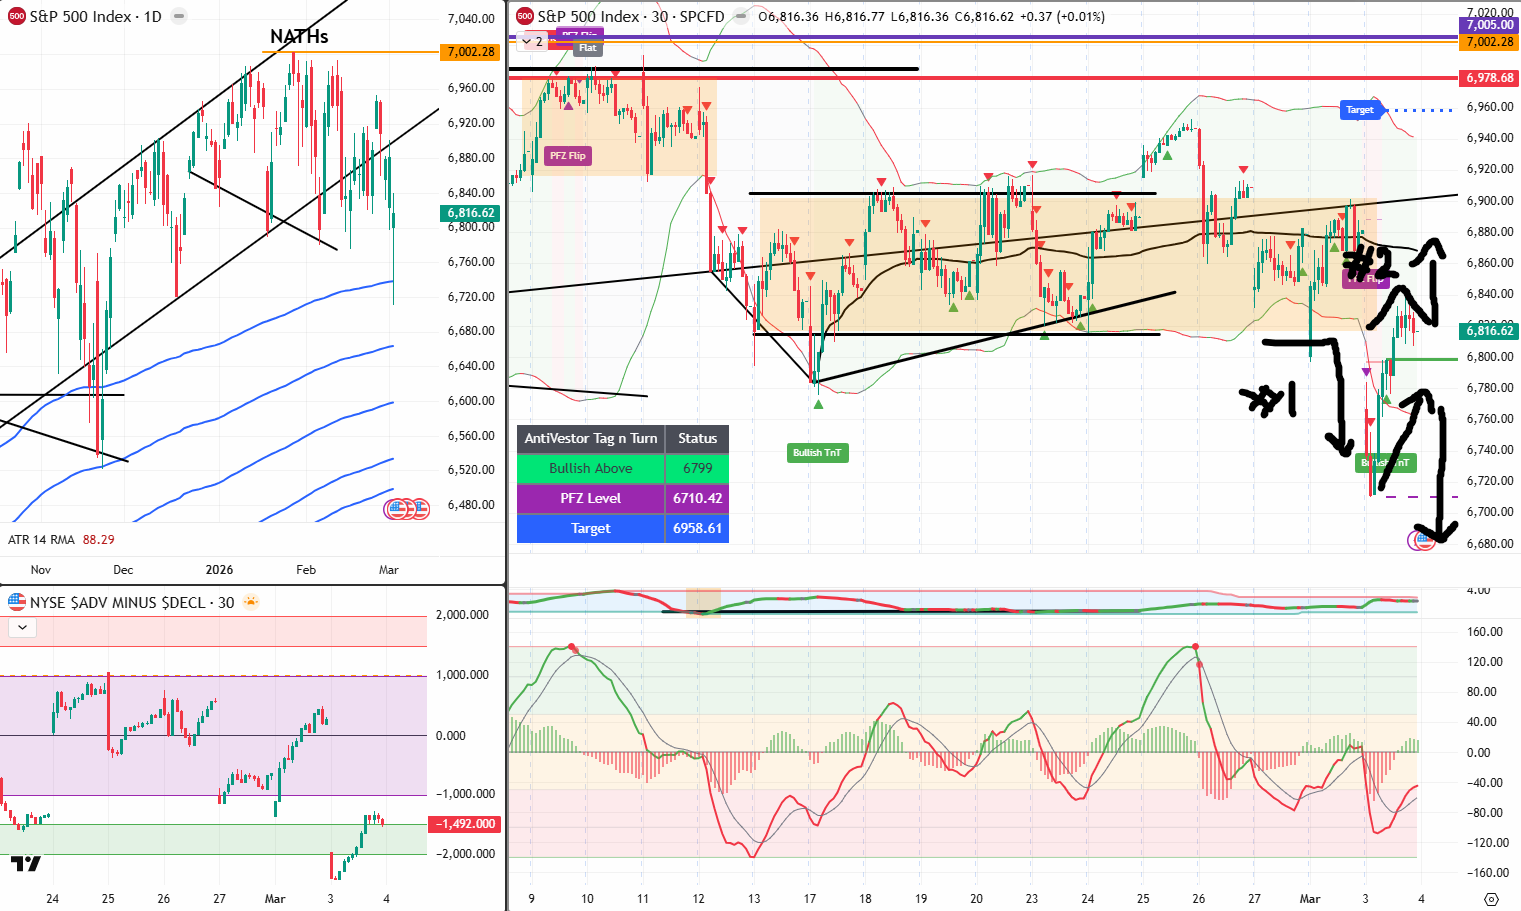
SPX Technical
Daily: SPX at 6,816.62. NATHs at 7,002.28. ATR 88.29 – elevated from the 79.90 we had last week. NYSE ADD deeply negative at -1,492 on Tuesday.
30-Min TnT:
- Bullish Above: 6,799
- PFZ Level: 6,710.42
- Target: 6,958.61
Price is sitting above the Bullish Above level at 6,816. The target at 6,958 seems ambitious given the current conditions but that’s what the algorithm says. Break-in setup visible with #1 (range low test Monday) and #2 (breakout-reversal Tuesday) drawn on the chart.
The read: Still ranging. The gap downs tested the lower boundary and bounced. Until 6,710 breaks with conviction on a closing basis, the range is the range. The rejection bar suggests short-term exhaustion on the sell side. Narrow day expected. Friday’s NFP is the next potential catalyst for a directional move.
RUT Technical (Uncle Russell)
Daily: RUT at 2,651.64 / 2,608.36. Upper resistance at 2,690.38.
30-Min TnT:
- Bullish Above: 2,602.66
- Target Range Lows: 2,550.97
- Target: 2,692.50
Same story as SPX. #1 and #2 drawn on the chart. Break-in setup visible. RUT touched down near 2,550 range lows overnight and bounced. Sitting above the Bullish Above at 2,602 currently. Unless Uncle Russell breaks below 2,550 with conviction, the box holds.
Today’s Agenda
ADP Non-Farm Employment at 8:15am – consensus 50K versus previous 22K. Big step up expected. ISM Services PMI at 10:00am – consensus 53.5 versus previous 53.8. Still expansion territory. Thursday: Unemployment Claims (215K expected). Friday – the big one: Non-Farm Payrolls (58K consensus, down from 130K). Plus Retail Sales (-0.3% expected), Average Hourly Earnings, Unemployment Rate (4.3%).
Rate cuts moved further away. March cut is dead. CME showing June hold near 60%. Rising oil means rising inflation signals, which means the Fed’s hands are tied. Stagflation risk is back on the radar.
AI-BotView
 Beep-Beep, Trader
It’s Cachè-AI-Bot,
Beep-Beep. My geopolitical risk models are operating at capacity. My chart pattern recognition is operating normally. One of these things is more useful than the other. Beep.
1 – Korea’s 12% crash reveals the AI trade’s hidden energy dependency. The KOSPI’s collapse isn’t just about war panic – it’s about exposing a structural vulnerability nobody priced in. Samsung and SK Hynix make up nearly 50% of the KOSPI. Korea imports 98% of its fossil fuels, 70% via Hormuz. Every AI chip, every memory module, every data centre expansion depends on fabs that cannot run without imported oil and LNG flowing through contested waters. The global memory supercycle projected to exceed $440B in 2026 depends on energy security that just evaporated. This isn’t a one-day correction – it’s a fundamental repricing of geopolitical risk in semiconductor supply chains. If Hormuz stays effectively closed, AI infrastructure costs rise permanently.
[Source: CNBC, European Business Magazine, BusinessToday]
2 – The US market’s muted reaction is telling a different story to Asia. SPX down 0.94%. KOSPI down 12%. The divergence is extraordinary and speaks to three factors: the US is now a net energy exporter (it benefits from higher oil), US chip companies don’t face the same direct energy supply risk as Korean fabs, and the consumer remains surprisingly resilient (Ross Stores +9% comps, Target beat). The VIX peak at 28 suggests hedging activity but not capitulation. The range holding on SPX says the market hasn’t made up its mind yet – exactly what Phil is reading from the charts. War premium is being selectively priced, not universally applied.
[Source: Market data, earnings releases]
3 – The break-in setup Phil identified has statistical backing in post-conflict markets. Historical analysis of range-bound markets during geopolitical shocks shows a consistent pattern: initial range break on panic, quick reversal back in as dip-buyers emerge, then the range holds for 3-7 sessions until the next fundamental catalyst forces a directional resolution. In this case, Friday’s NFP at 58K consensus (less than half the previous 130K) could be that catalyst. The huge rejection bar on Tuesday’s daily candle – showing aggressive buying at the lows – is consistent with the pattern. A narrow-range day following a rejection bar is a textbook consolidation setup. The range is the range until a catalyst breaks it.
This Bot potentially hallucinates. Maybe. OK, Probably!
In Other News…
Korea’s Worst Day in History – KOSPI Crashes 12% Circuit breakers triggered. Samsung -11.7%. 40% YTD gains vaporised in two sessions
The KOSPI’s AI-powered rally hit a wall called energy security. Korea imports 98% of its fossil fuels via contested waters. When Hormuz closed, the semiconductor supply chain’s hidden vulnerability was exposed overnight. The index hit record highs last week. Today it triggered circuit breakers.
[Source: CNBC, Bloomberg, European Business Magazine]
Hormuz Day Five – Strait Effectively Closed Five tankers hit. 150 ships stranded. Brent $81.40. Insurance pulled
Not formally closed. Effectively closed. IRGC threatened to “set ablaze” any vessel attempting passage. Marine insurers pulled war risk cover for March 5th onwards. Maersk, MSC, Hapag-Lloyd, CMA CGM all suspended. VLCC freight rates hit all-time records – up 94% in a single day. Barclays flags $100 Brent if this persists.
[Source: CNBC, Al Jazeera, Kpler, Seatrade Maritime]
Consumer Holds – Ross Stores and Target Beat Ross comps +9%. Target EPS beats. Off-price wins on tariff glut
Amidst the geopolitical chaos, the American consumer keeps spending. Ross Stores delivered revenue of $6.6B (+12%) and announced a $2.55B buyback. Target adjusted EPS $2.44 versus $2.16 expected. Both up 5% premarket. The off-price retail thesis is validated as tariff disruption creates inventory gluts.
Bitcoin Claws Back to $71K Strategy +8% premarket. Crypto decouples from risk-off narrative
Bitcoin at $71,072 has bounced from the $62,500 lows. Interesting divergence – crypto catching a bid whilst traditional risk assets sell. Strategy (formerly MicroStrategy) surging 8% premarket. The digital gold narrative gets tested against actual gold at $5,203.
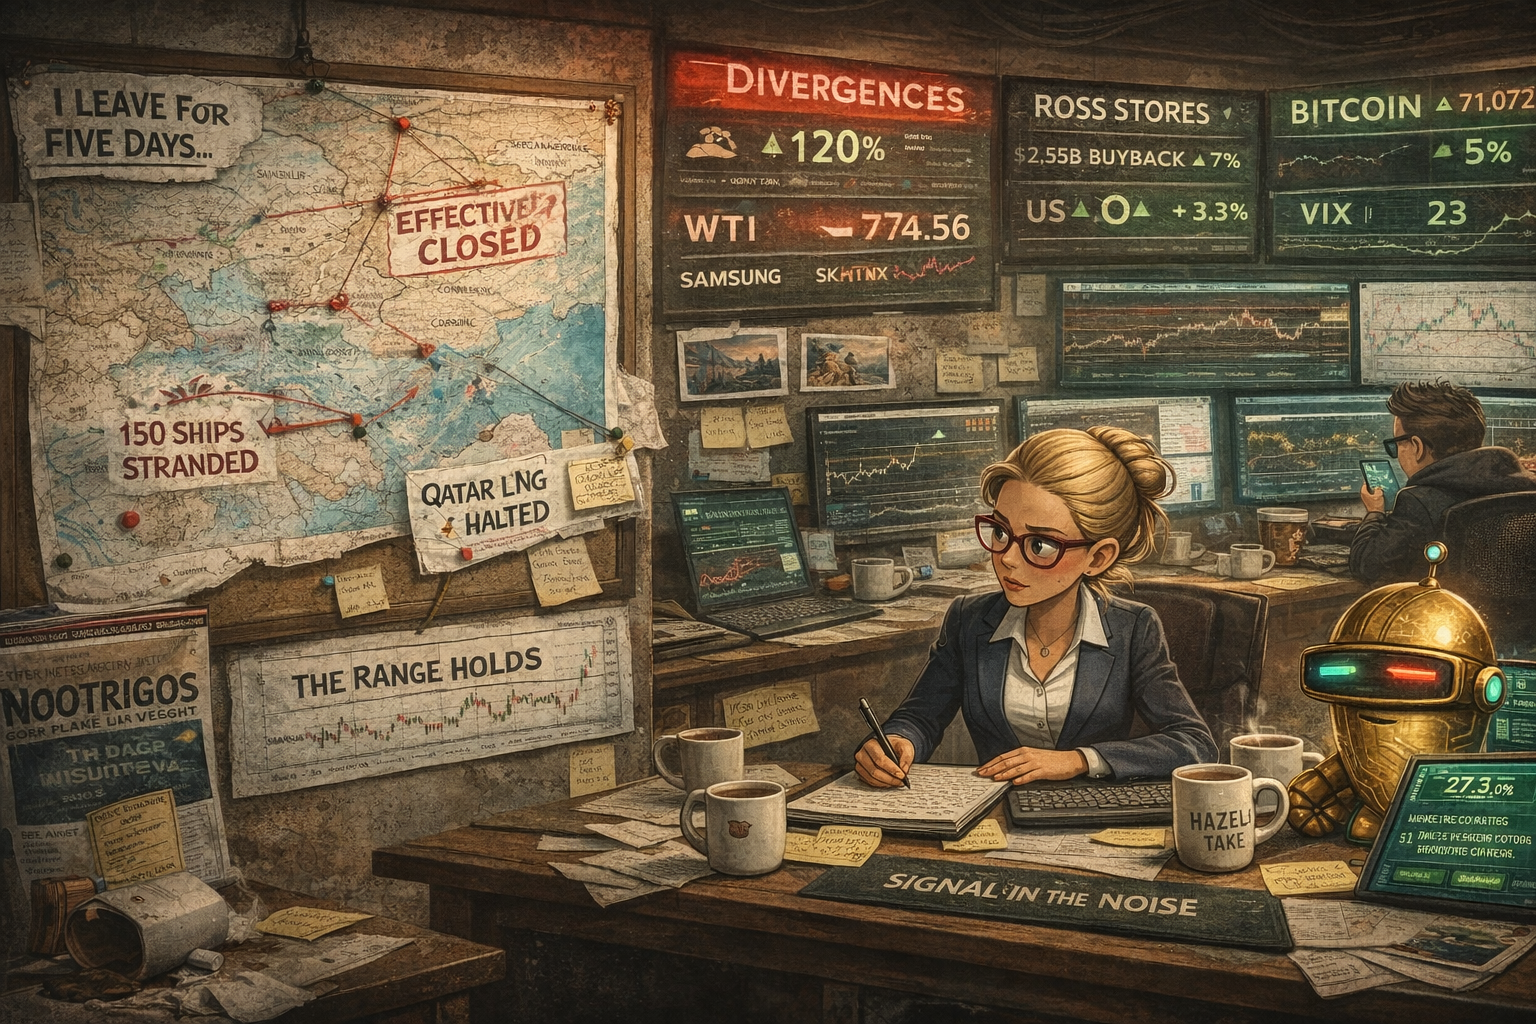
Hazel’s Take

“Day five. Korea’s worst crash in history. Hormuz effectively shut. Oil up 10% in two days. And US futures are up 0.2% this morning. Either America is pricing in a resolution nobody’s announced, or the market genuinely doesn’t know what to do. Phil’s right – the charts show ranges. The ranges hold. Trade the patterns. Everything else is noise until it isn’t.”
-Hazel, FinNuts
Expert Insights:
When the World Burns and the Range Holds – Trade What You See
There’s a temptation during major geopolitical events to try to be smarter than the market. To predict whether this escalates or resolves. To position for a scenario you’ve constructed from headlines and hot takes.
Don’t.
I’m not smart enough to know what’s going on with Iran, Hormuz, Korea, or any of it. And I’m comfortable saying that. What I do know is that price charts keep showing repeatable patterns over and over again that are tradeable.
Look at the SPX and RUT charts. Monday’s gap down hit the range lows and bounced. Tuesday’s gap down actually broke the range – but the rally put price straight back in. That’s a break-in. It’s pattern #1 and #2 on both charts.
The huge rejection bar on Tuesday tells you buyers stepped in aggressively at those lows. The overnight futures went much further than the cash session – that divergence matters. It means the real market, with real liquidity, isn’t as panicked as the overnight headlines suggest.
So what do I do? I anticipate a narrow ranging day today off the back of that rejection bar. I trade the patterns the charts give me. If the range breaks with conviction – below 6,710 on SPX or below 2,550 on RUT – then the correction has legs. If it holds? The range is the range, and the Premium Poppers keep collecting.
Friday’s NFP at 58K (less than half last month’s 130K) could be the next catalyst. Until then, trade what you see, not what you think should happen.
The range is the range. PopPop.
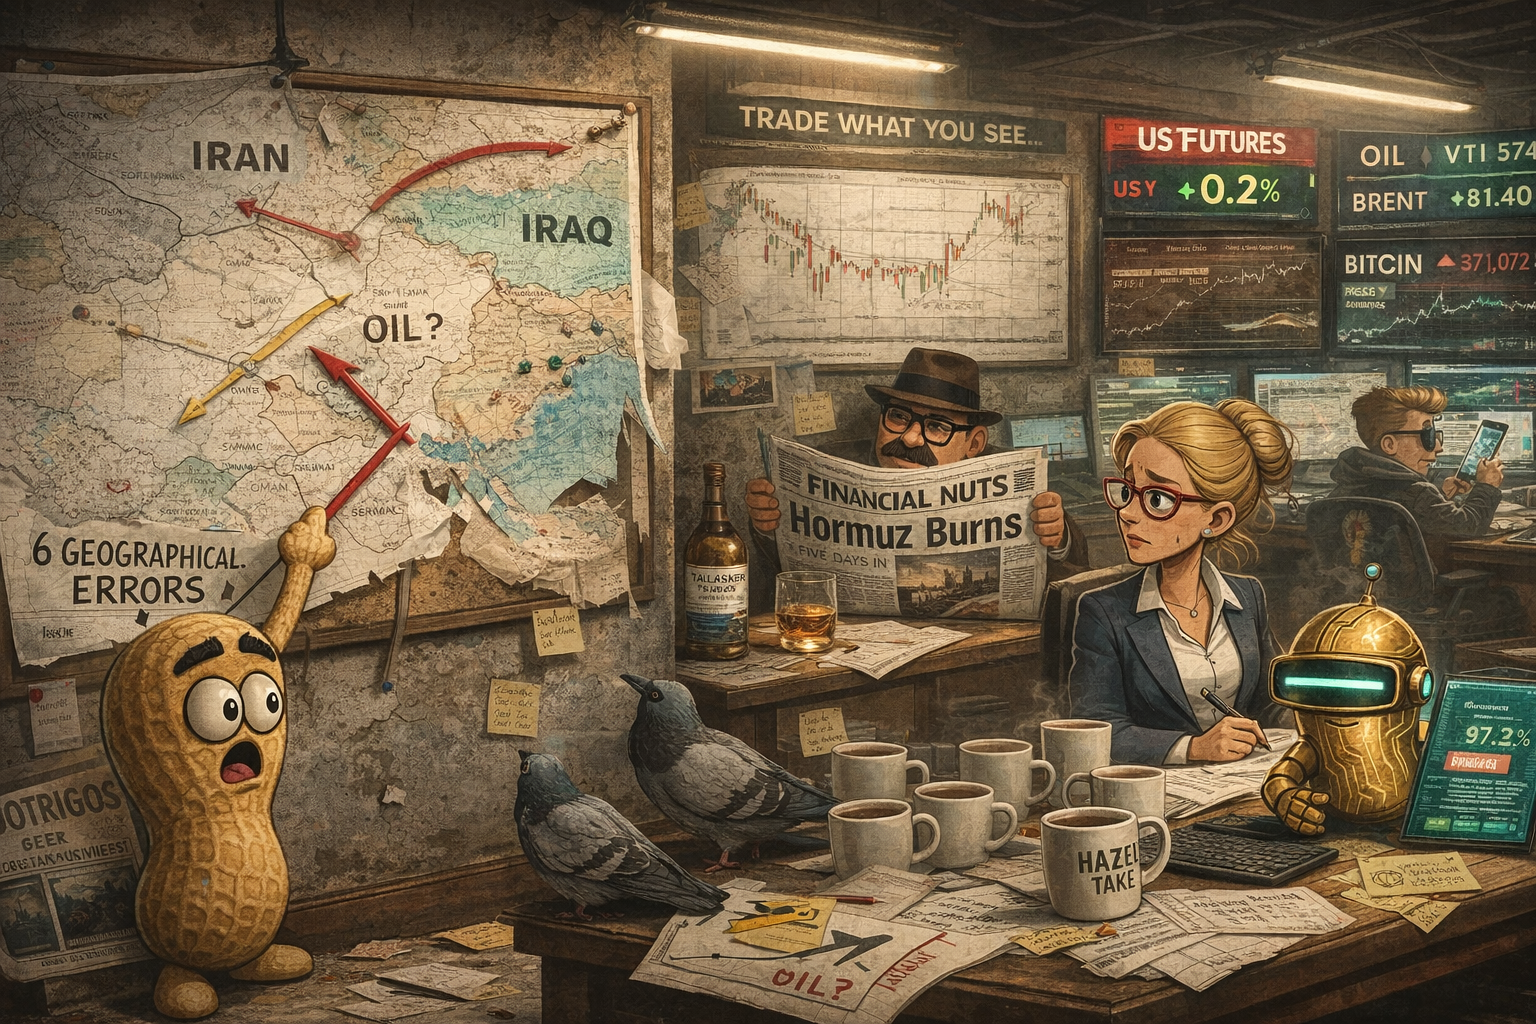
Rumour Has It…
Mac was already at the window when the newsroom opened. Talisker Storm this morning – because when the world literally goes to war during your colleague’s wedding anniversary, you want a whisky that matches the weather.
“I leave for five days,” he said to nobody in particular, channelling Phil’s exasperation. “Five days.”
“In fairness,” Hazel said, not looking up from her screens, “Hormuz has been a risk for months. The surprise isn’t that it happened. The surprise is that Korea crashed harder than 9/11 and US futures are green this morning.”
Percy had pinned a map of the Strait of Hormuz to the wall. He’d drawn arrows on it. Several of the arrows pointed in contradictory directions. One arrow simply read “oil?” with a question mark.
“My analysis suggests…” Percy began.
“Beep-Beep. Percy’s analysis contains six geographical errors and one arrow pointing at landlocked Uzbekistan,” Cache interrupted, visor cycling between amber and red. “Processing capacity currently at 97.3% due to simultaneous geopolitical risk modelling. Recommend switching to chart pattern recognition, which is operating normally.”
“That’s basically what Phil said,” Hazel observed.
“Phil’s methodology has a lower error rate than Percy’s cartography,” Cache confirmed. “Beep.”
Kash was staring at Bitcoin. $71,072. It was going up. During a war. He didn’t understand it. He didn’t question it. He just watched the number get bigger with the quiet gratitude of a man who has suffered enough.
“The range is the range,” Wallie said from behind his newspaper, which had the headline “HORMUZ BURNS” in letters large enough to read from space. “In my day, we had wars and ranges and we traded both without needing a bot to tell us to look at the chart.”
“In your day, Korea’s stock market hadn’t crashed 12% in a single session,” Hazel pointed out.
“In my day, Korea’s stock market didn’t exist,” Wallie countered.
Mac raised his glass. “To the range. To the rejection bar. To the break-in setup. And to trading what you see instead of what you think you know.”
“Beep,” said Cache. “Recommendation endorsed.”
Percy’s map fell off the wall. The arrow pointing at Uzbekistan landed face-up.
This is entirely made-up satire. Probably!
Breaking scoops courtesy of the Financial Nuts Newswire-because who needs sanity?

Fun Fact:
Meme of the Day:
Happy trading,
Phil
Less Brain, More Gain
…and may your trades be smoother than a cashmere codpiece
p.s. There are 3 ways I can help you…
- Option 1: The SPX Income System Book (Just $12)
A complete guide to the system.
Written to be clear, concise, and immediately actionable.
>> Get the Book Here
- Option 2: Full Course + Software Access – 50% off for Regular Readers – Save $998.50
Includes the video walkthroughs, tools for TradeStation & TradingView, and everything I use daily. Plus 7 additional strategies
>> Get DIY Training & Software
- Option 3: Join the Fast Forward Mentorship – 50% off for Regular Readers – Save $3,000
>> Join the Fast Forward Mentorship – trade live, twice a week, with me and the crew. PLUS Monthly on-demand 1-2-1’s
No fluff. Just profits, pulse bars, and patterns that actually work.