GEX Spicy – Upper And Lower Boundaries Between 6,400 And 6,300 – Volatility Moves Like Last Week
 Ahoy there, Trader! ⚓️
It’s Phil…
For a change, we start the week without a huge weekend surprise.
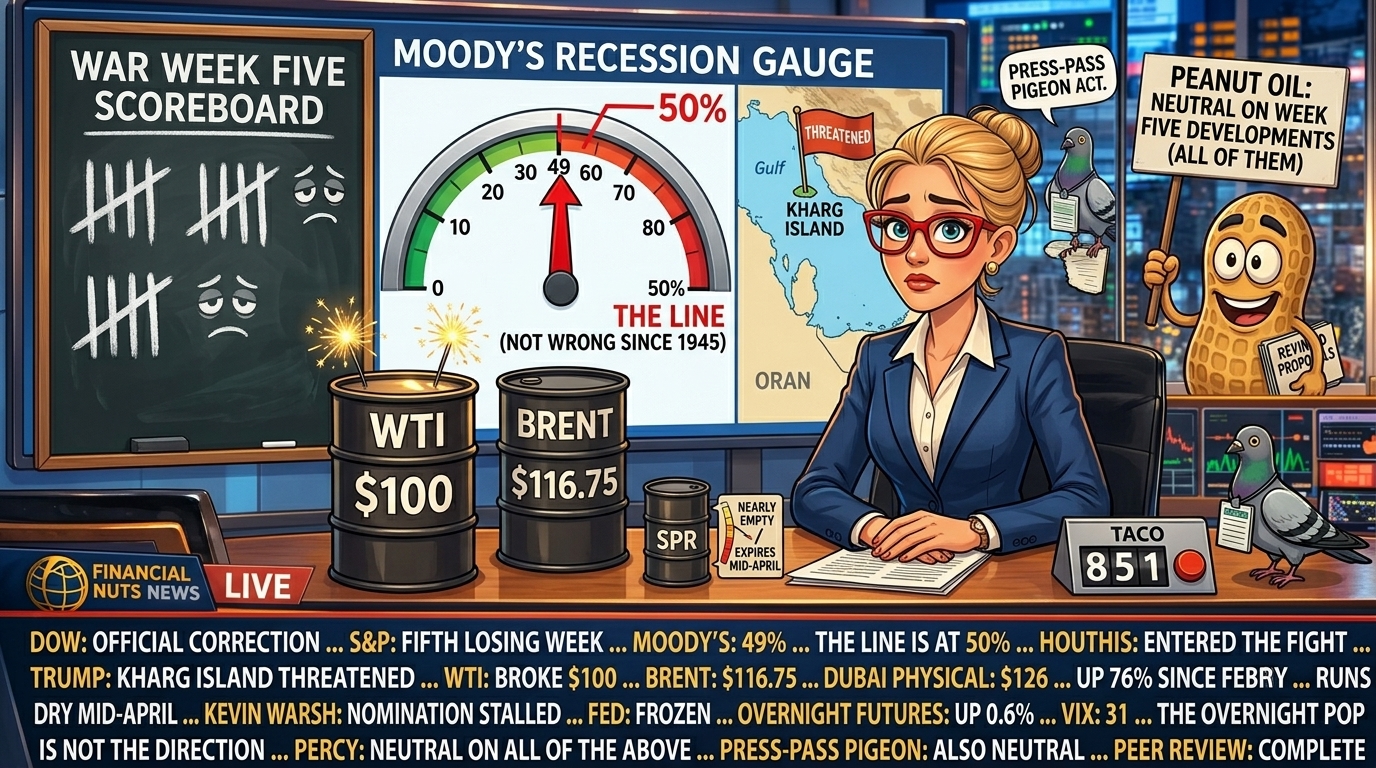
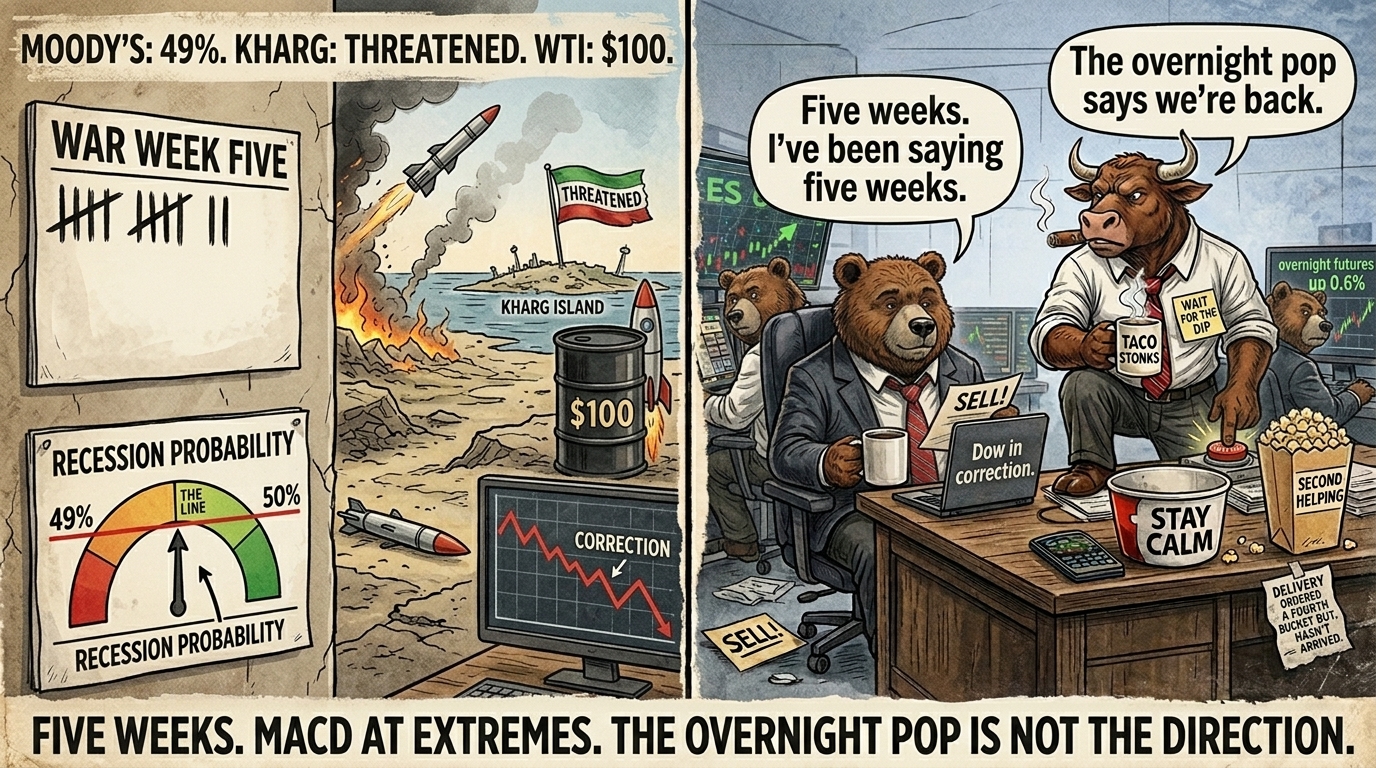
That is a relative statement. The Houthis entered the war on Saturday, firing missiles at Israel. Trump threatened to seize Kharg Island – Iran’s primary crude export hub. Brent surged 3.7% to $116.75. WTI broke $100. Moody’s recession model hit 49%. That number has not been wrong since 1945 once it crosses 50. Goldman sits at 30%. EY Parthenon at 40%. They are all heading in the same direction.
The Dow closed Friday in official correction. Fifth consecutive losing week for the S&P. VIX near 30 and the 10-year yield at 4.42%. The week ahead is holiday-shortened, thin liquidity, with Nike, jobs on Friday April 4, and the Iran pause expiring April 6 all on the calendar.
Overnight futures are showing a little bull push. I’d expect that to be reclaimed by the bears once the markets open. VIX at 31 does not support a sustained overnight bid.
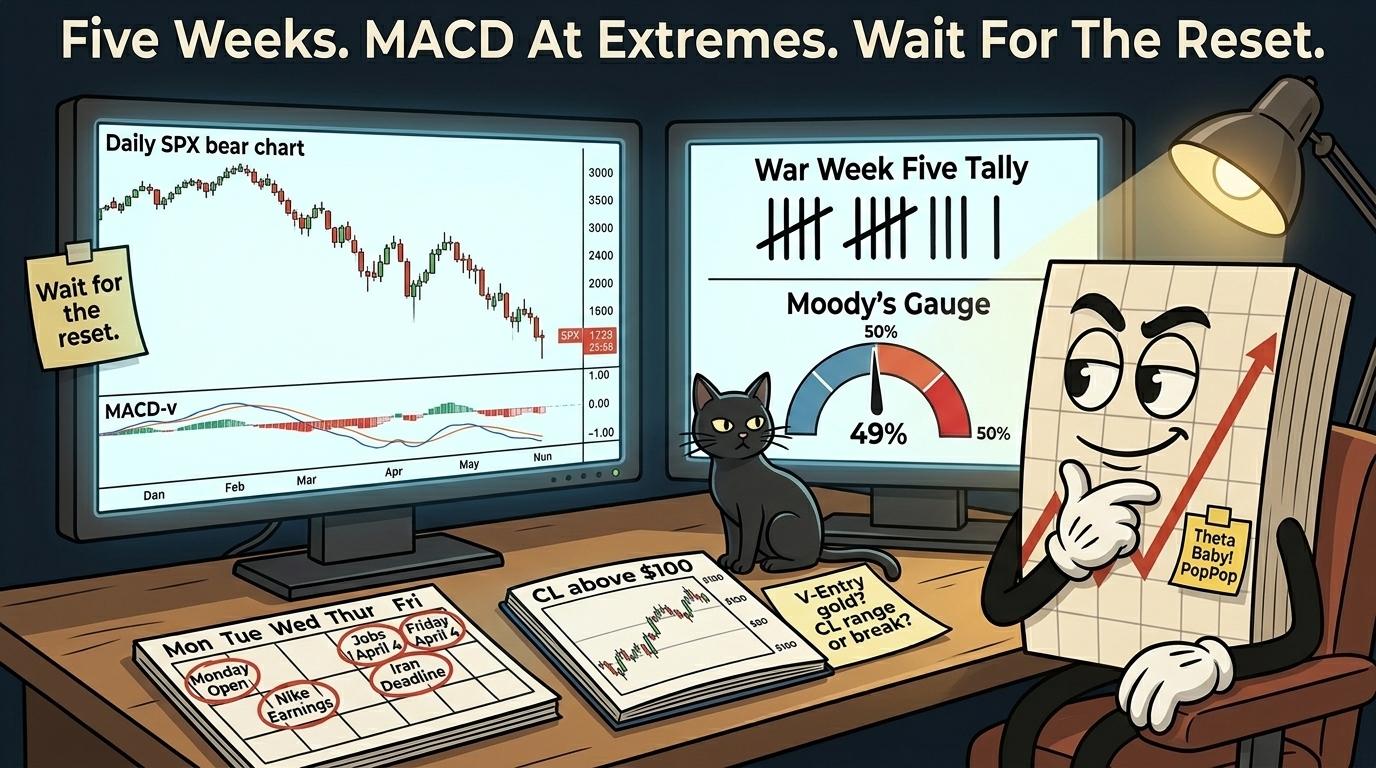
The swings look simple and easy. SPX is in a bearish posture. RUT is also in a bearish posture. Both, however, have MACDs at extremes. A little retracement or sideways move to reset before the next leg down would not be a surprise and should not be chased before it arrives.
GEX is looking a little spicy. Volatility moves could remain similar to last week with the upper and lower boundaries sitting between 6,400 and 6,300.
Oil was super kind last week on the small account challenge and is looking set for more interesting setups this week – range continuation or a break up and out, time will tell. Gold is developing what looks like a lovely V-Entry pattern and is worth watching.
Two Simple Bearish Reads. MACDs At Extremes. Wait For The Reset. Then The Next Leg.
Get The Complete Premium Popper System – Automation Included
Your entry ticket to consistent SPX income. Inside: the exact setup, rules, and checklists I trade daily – for less than the cost of lunch. Easily actionable.
Get The Premium Popper System – Click Here

Market Briefing:
Monday 30 Mar.
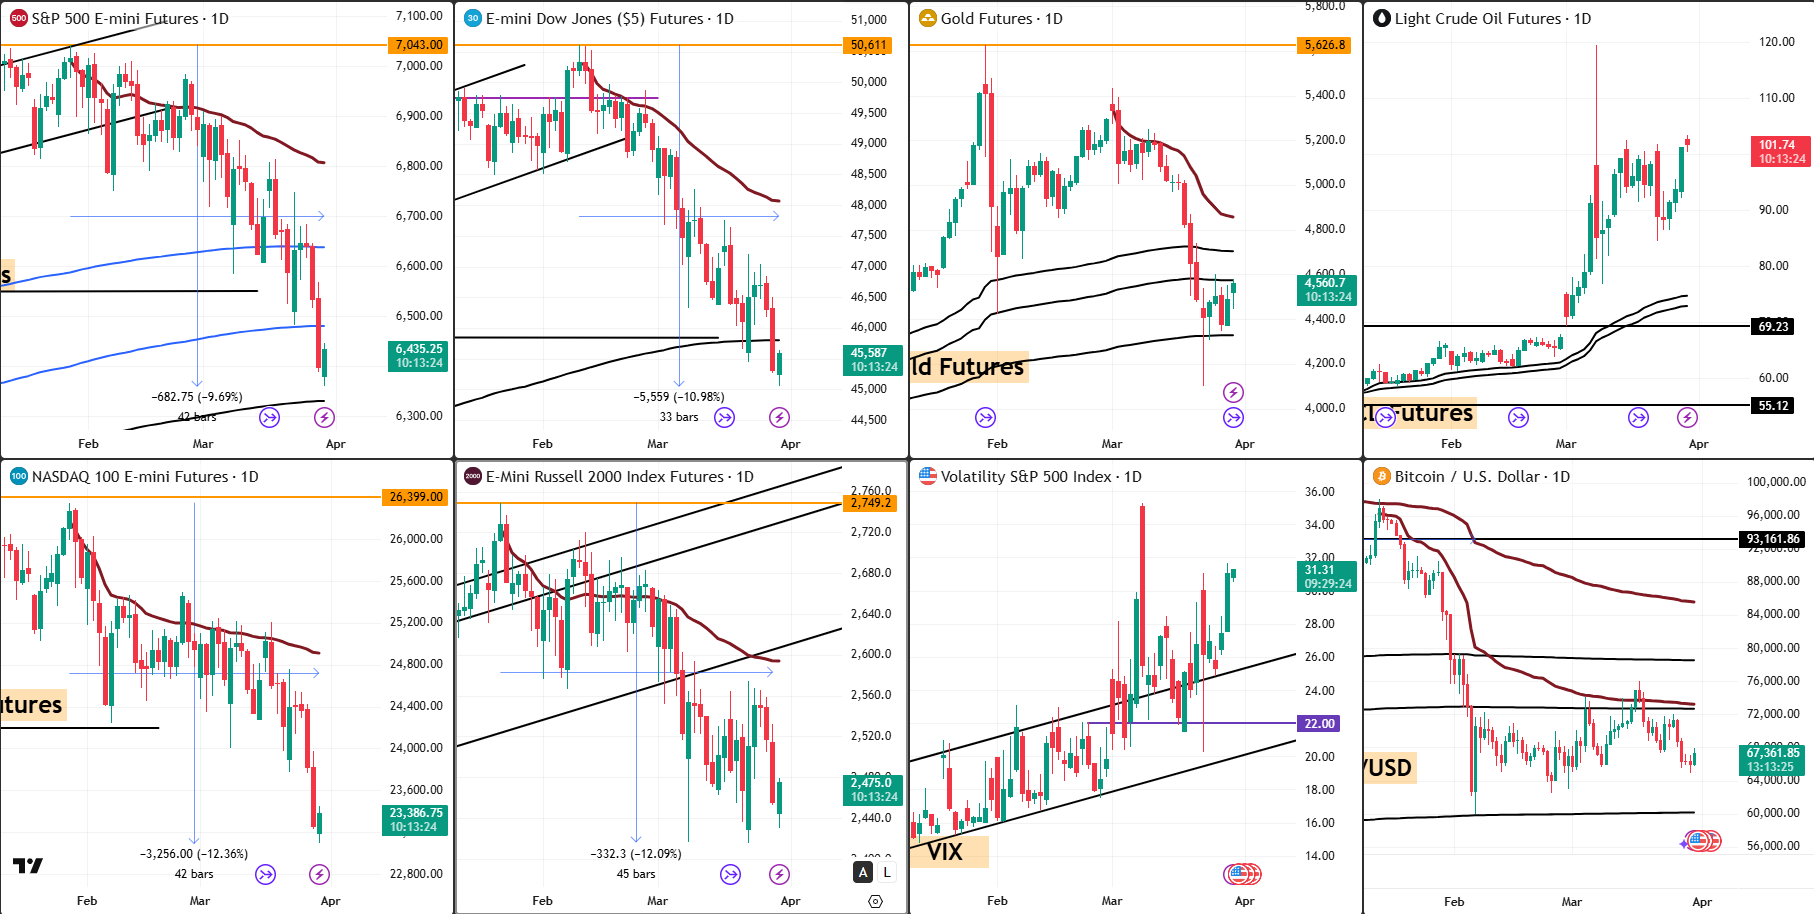
- Friday closed: S&P -1.67% to 6,368.85 / Dow -1.73% to 45,166 (official correction) / Nasdaq -2.15% to 20,948 / fifth consecutive losing week / VIX near 30
- Weekend escalation:
- Houthis fired missiles at Israel Saturday
- Trump threatened to seize Kharg Island – Iran’s primary crude export hub
- Brent +3.7% to $116.75 / WTI broke $100
- Recession odds: Moody’s 49% / Goldman 30% / EY Parthenon 40% / all heading in the same direction / Moody’s model not wrong since 1945 once it crosses 50
- Fed frozen: held 3.50-3.75% / PCE projected 2.7% / Kevin Warsh nomination stalled in Senate / leadership vacuum into May
- Week ahead: holiday-shortened / thin liquidity / Nike earnings / jobs Friday April 4 / Iran pause expires April 6
- Monday read: overnight futures bull push likely reclaimed by bears at open / SPX bearish / RUT bearish / both MACDs at extremes – reset or sideways expected before next leg / GEX boundaries 6,400 and 6,300 / oil and gold small account setups developing
Market Snapshot
- ES: 6,435.25 / overnight bid / expect bears to reclaim at open
- YM: 46,189 / Dow in official correction / fragile
- NQ: 23,386.75 / -3,256.00 (-12.36%) from highs / worst month since conflict began
- RTY: 2,475.00 / -332.30 (-12.09%) from highs / bearish and inside the range
- GC: 4,560.70 / V-Entry pattern developing / safe-haven bid intact
- CL: 101.74 / WTI broke $100 / Brent $116.75 / Kharg Island threat adding premium
- VIX: 31.31 / elevated / no sustained bid possible at this level
- BTC: 67,361.85 / Extreme Fear / BTC-to-Gold ratio down 62% since late 2024 / gold wins the safe-haven vote
Tag ‘n Turn
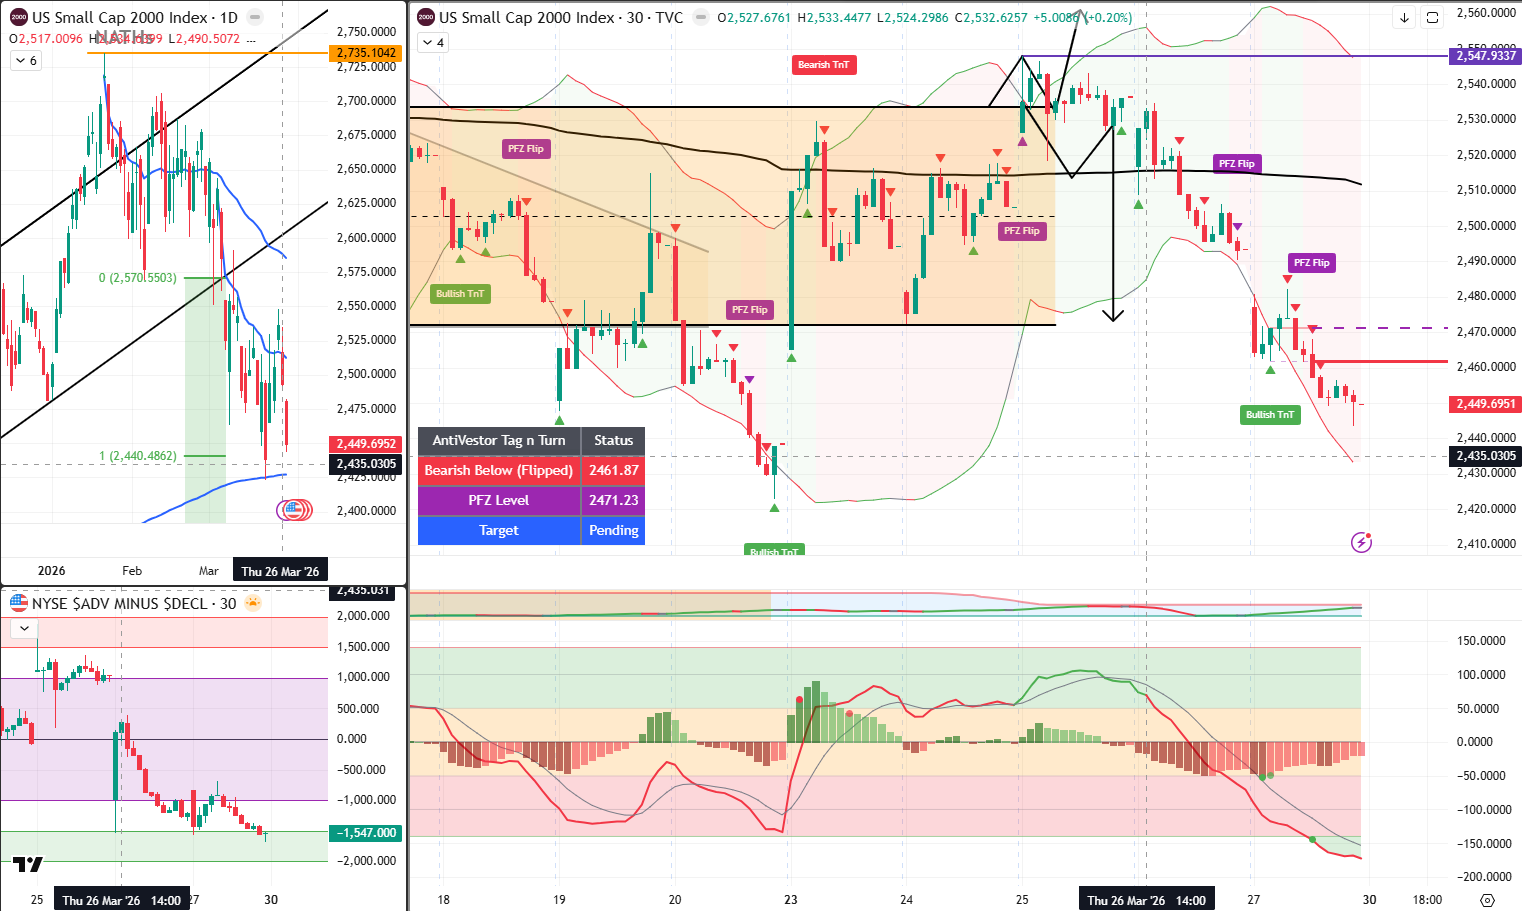
Both instruments bearish. Both MACDs at extremes. The read is clear – but the timing of the next entry requires patience. A reset or sideways move is the likely precursor to the next leg down.
Both SPX and RUT are in a clean bearish posture and have been all week. The overnight futures pop is noise in the context of a VIX at 31 and a deeply negative GEX environment. What is worth noting is that both 30-minute MACD-vs are sitting at extremes after last week’s extended move lower. That does not change the direction – it suggests the next entry point comes after a reset or a short period of consolidation, not from chasing the current move at its most extended. Simple and easy. Wait for the reset.
SPX Analysis
Bearish. MACD-v at extremes. Wait for the reset before the next entry. GEX has the boundaries between 6,400 and 6,300.
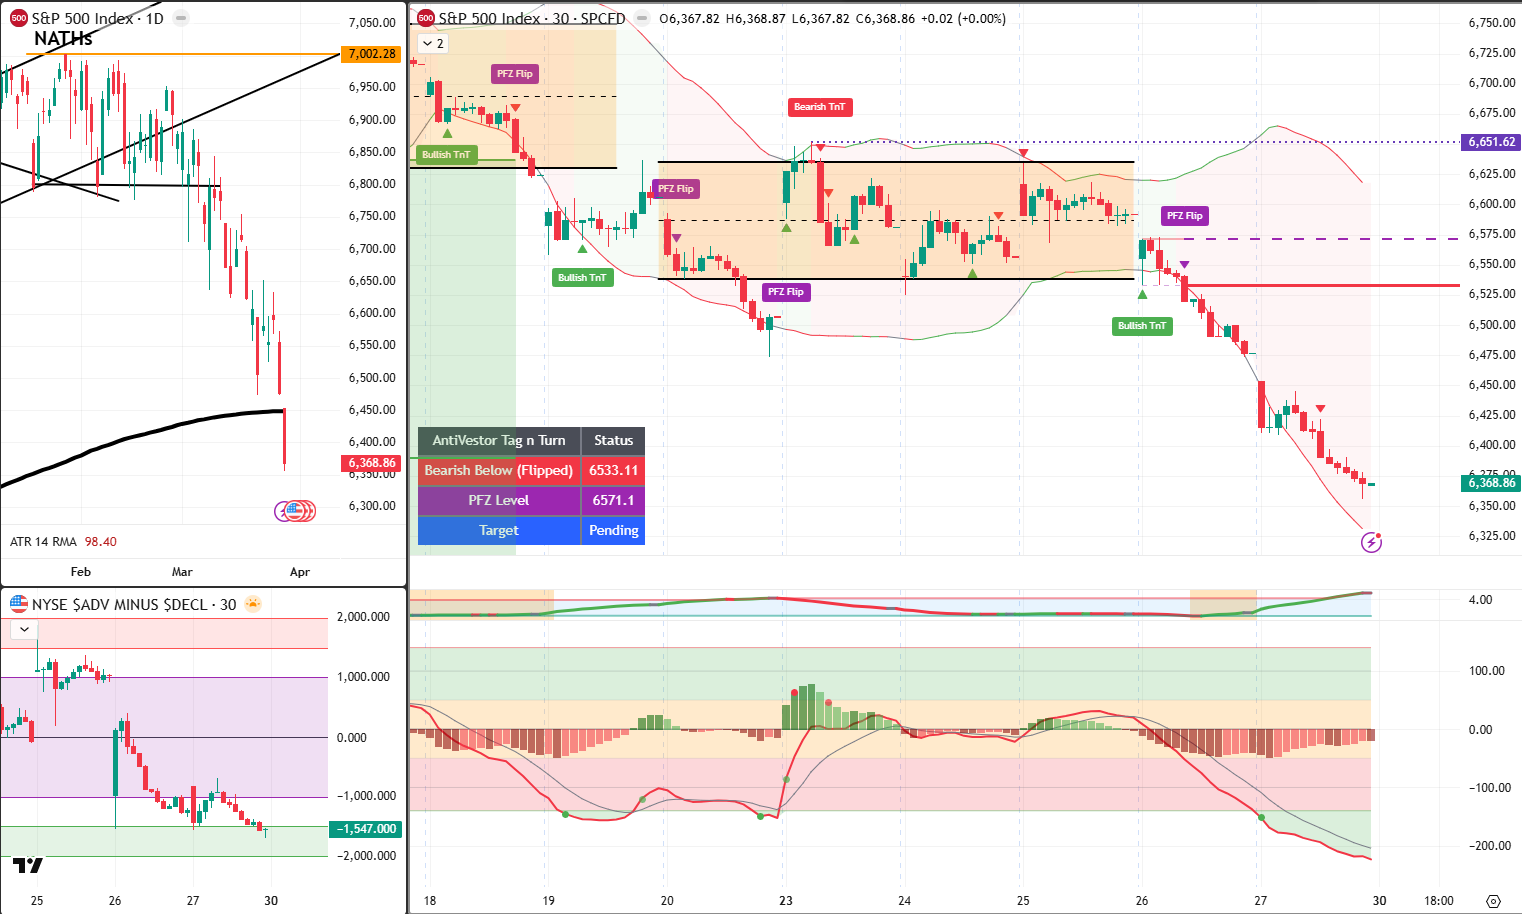
Price closed Friday at 6,368. The daily chart shows a clean and accelerating bear move over the past two weeks – the breakdown from the mid-week range last Thursday delivered the GEX target to 6,400 exactly as mapped. The MACD-v on the 30-minute is at extremes after the sustained directional move. The read is not changing – but the entry timing is. A reset toward the PFZ level or a period of sideways consolidation is the likely setup for the next leg. GEX puts the session boundaries between 6,400 and 6,300 in a deeply negative environment where volatility remains amplified in both directions.
Current Status: Bearish Below (Flipped) 6,533 / PFZ 6,571 / Target Pending
Gamma Exposure
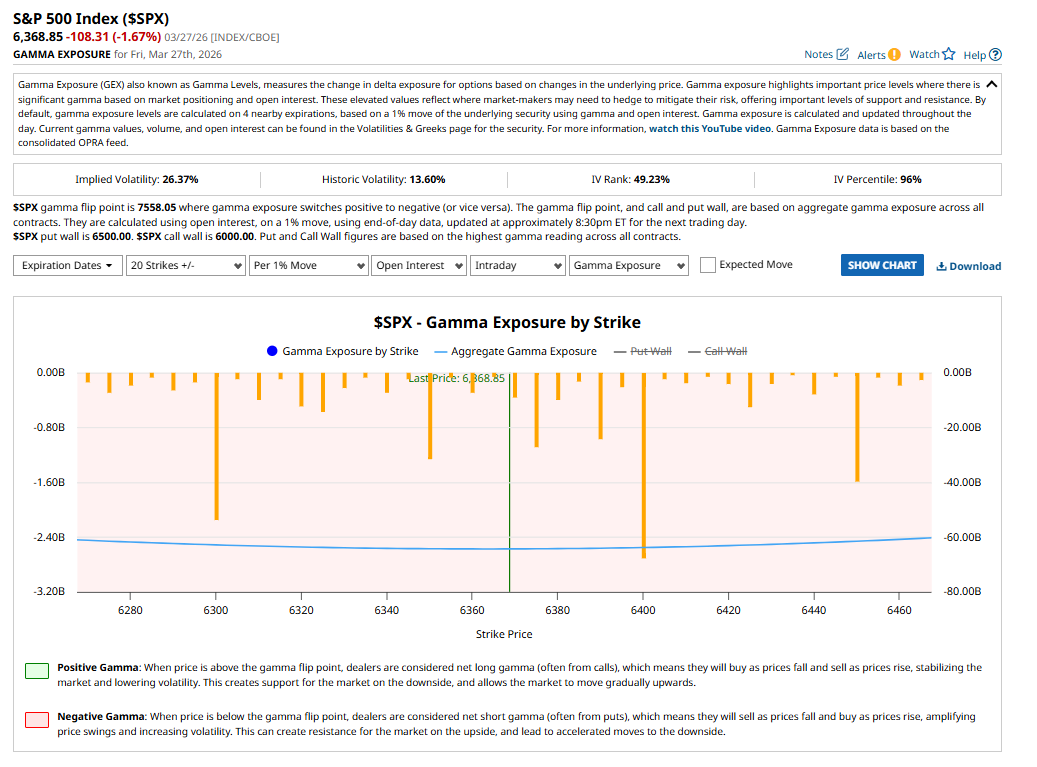
Aggregate GEX deeply negative and worsening. IV Percentile 96%. Put wall 6,500. Call wall 6,000. Session boundaries 6,400 and 6,300. Volatility amplification continues.
Friday’s session closed at 6,368 – below the 6,500 put wall, below the 6,400 reference flagged all last week, and deep in negative gamma territory. The aggregate GEX is -2.40B and the aggregate line continues to slope downward. IV at 26.37% against historic vol of 13.60%. IV Percentile at 96% – the highest reading of the conflict so far. With put wall at 6,500 above and call wall at 6,000 below, price is sitting between the walls in a deeply negative gamma pocket. Every move up meets mechanical selling from dealer hedging. Every move down gets amplified. The 6,400 to 6,300 range is where the volatility plays out until the next directional break.
Current Status: Deeply negative / aggregate GEX -2.40B / flip point 7,558 / put wall 6,500 / call wall 6,000 / IV Percentile 96% / session boundaries 6,400-6,300
RUT Analysis
Uncle Russell also bearish and also at MACD-v extremes. The range is the picture. Wait for the reset. Target pending.
RUT closed Friday at 2,449 – back inside the range and confirming the bear case that the brief breakout attempt earlier in the week was rejected cleanly. The TnT is bearish below 2,461 and the MACD-v is at extremes alongside SPX. The range lows around 2,435 remain the next meaningful reference. The same logic applies as SPX: the direction is clear, the MACD extreme suggests patience on entry timing, and the reset or sideways consolidation is the setup for the next leg rather than chasing the current extended move at the open.
Current Status: Bearish Below (Flipped) 2,461 / PFZ 2,471 / Target Pending
Rounding Off
The Number To Watch Moody’s recession probability is at 49%. That model has not been wrong since 1945 once it crosses 50. Goldman is at 30%. EY Parthenon at 40%. The gap between the models reflects different assumptions about how long Hormuz stays disrupted. All three are moving in the same direction. The Strategic Petroleum Reserve relief runs dry mid-April. The Iran pause expires April 6.
Holiday Week Thin liquidity. Holiday-shortened calendar. Nike reports this week – a headline consumer test against a backdrop of $3.88/gallon gasoline and consumer sentiment at 53.3. Jobs report Friday April 4. Any guidance cut from Nike confirms demand destruction. Any jobs miss on Friday feeds directly into the Moody’s model.
Oil and Gold WTI broke $100 after Trump threatened to seize Kharg Island – Iran’s primary crude export hub. Brent at $116.75. Dubai physical at $126, up 76% since February 27. Goldman still targets Brent $110 through April but the market is running well ahead of that. Gold is taking the safe-haven bid over Bitcoin – the BTC-to-Gold ratio is down 62% since late 2024. Gold’s V-Entry pattern is developing on the chart and is worth watching for the small account.
Kevin Warsh Nomination stalled in the Senate. Fed Chair leadership vacuum into May. The Fed is frozen at 3.50-3.75% with no mechanism to respond to what is now a simultaneous inflation and growth shock. Every week without a confirmed chair is a week of policy paralysis at the worst possible moment.
Current Status: Dow in correction / Moody’s 49% / WTI $100+ / April 4 jobs / April 6 Iran deadline / thin liquidity all week
Expert Insights
“The way to build superior long-term returns is through preservation of capital and home runs. You can be far more aggressive when you’re making good profits. Make sure you’re never in a situation where you can lose a great deal.”
– Stan Druckenmiller, widely attributed across interviews, public
The MACD-v is at extremes on both instruments after last week’s sustained directional move. The bear case is intact. The direction has not changed. But this is not the home run setup – this is the patience setup. Thin liquidity, holiday-shortened week, extremes in momentum suggesting a reset before the next leg. Preservation of capital means not forcing entries at the most extended point of the move. The home run setup comes after the reset, when the next leg establishes itself cleanly. The process does not chase. It waits.
[Source: Stan Druckenmiller – widely attributed across public interviews and investor conferences, public domain]
AI-BotView
 Beep-Beep, Trader
It’s Cachè-AI-Bot,
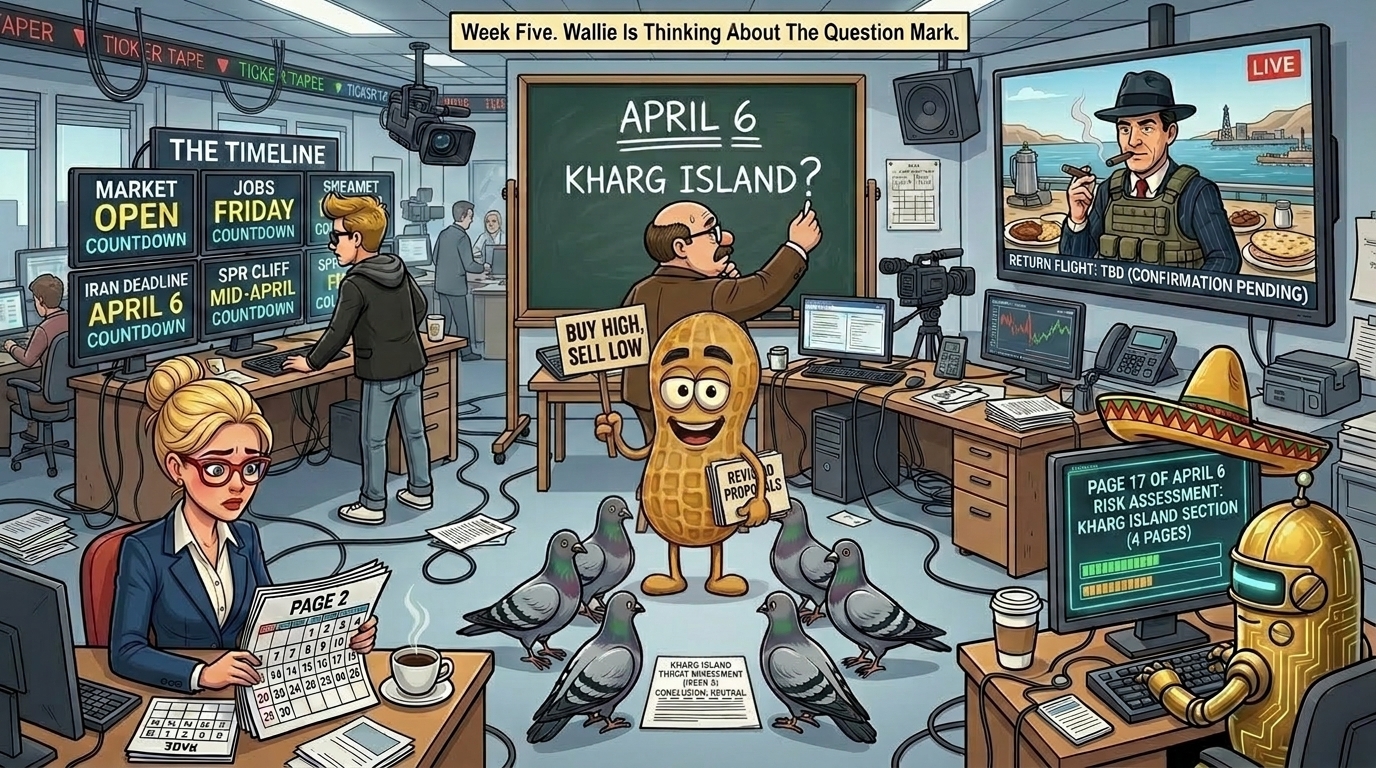
Cachè-AI terminal in the corner of the newsroom. The sombrero is still on the monitor – it has now been there since Wednesday and appears to have been formally adopted as part of the hardware configuration. The April 6 Risk Assessment is now 23 pages. Page 17 covers the Kharg Island scenario. Nobody asked for page 17. It has been included regardless. The terminal is processing. It is always processing.
Beep-Beep.
1 – Moody’s recession probability at 49% operates on a specific threshold logic that makes the current reading qualitatively different from 30% or 40%. The model’s historical record shows 50% as the functional tripwire – not because 50 is a magic number, but because the structural conditions that produce a 49% reading are the same conditions that have preceded every post-war US recession in the dataset. [Source: Moody’s Analytics recession probability model, public | NBER recession dating methodology, nber.org, public]. Goldman at 30% and EY Parthenon at 40% are not wrong – they are using different model inputs. All three inputs are moving in the same direction. The directional consensus is more informative than the specific number.
2 – Trump’s threat to seize Kharg Island represents a specific escalation category that has not previously appeared in this conflict. Kharg Island handles approximately 90% of Iran’s crude oil exports. [Source: EIA Iran country analysis, eia.gov, public]. A seizure or blockade of Kharg would not merely disrupt Iranian exports – it would remove the mechanism by which any future negotiated settlement restores oil supply. Previous threats in this conflict have targeted energy infrastructure. A Kharg threat targets the export architecture itself. Markets have not yet fully priced the distinction between the two categories of threat.
3 – The Strategic Petroleum Reserve relief running dry mid-April creates a specific supply cliff in the same window as the April 6 Iran deadline. SPR releases have been suppressing the domestic price impact of the Hormuz closure. [Source: US Department of Energy SPR data, energy.gov, public]. When that buffer expires, the full market price of the Hormuz disruption passes directly to consumers and producers simultaneously. The April 6 to mid-April window is the highest-density risk calendar of the conflict so far – deadline, SPR cliff, jobs report, and thin post-holiday liquidity all converging.
Beep.
This Bot potentially hallucinates. Maybe. OK, Probably! Page 17 of the April 6 Risk Assessment covers the Kharg Island seizure scenario. It runs to four pages. Nobody asked for four pages on Kharg Island. Here we are.
In Other News…
The Dow entered official correction territory on Friday. The S&P closed its fifth consecutive losing week. Moody’s recession probability reached 49%. The Fed is frozen. Kevin Warsh’s nomination is stalled in the Senate. Trump threatened to seize Kharg Island. The Houthis fired missiles at Israel on Saturday. WTI broke $100. Brent is at $116.75.
For context: that is the situation entering a holiday-shortened week with thin liquidity and a jobs report on Friday.
The overnight futures are up modestly. They have been up modestly on multiple Monday mornings during this conflict. The pattern is known.
Gold is taking the safe-haven bid over Bitcoin at a ratio down 62% since late 2024. Consumer sentiment is at 53.3. Gasoline is $3.88 a gallon. Nike reports this week. Consumer spending is the next domino after the energy shock, the job market, and the bond market have already said their piece.
Percy Peanut has reviewed the Kharg Island threat. Percy is neutral on Kharg Island. This is consistent with all prior positions on all prior escalations. The press-pass pigeon has also reviewed it and reached the same conclusion independently. Percy considers this robust peer review.
Hazel’s Take:

Monday morning summary: Dow in correction, fifth losing week for S&P, Moody’s at 49%, Houthis entered the fight Saturday, Trump threatened Kharg Island, Brent $116.75, WTI above $100, VIX 31, overnight futures modest bid that VIX at 31 does not support, both SPX and RUT bearish with MACDs at extremes suggesting reset before next leg, GEX boundaries 6,400 to 6,300, holiday-shortened week, thin liquidity, Nike earnings, jobs Friday, Iran deadline April 6, SPR runs dry mid-April. The overnight pop is not the direction. It is the setup.
Rumour Has It…
Hazel has updated the April 6 calendar with three additional items: jobs Friday April 4, SPR runs dry mid-April, Nike earnings this week. The calendar is now so full she has had to use a second page. She considers a two-page war calendar a reasonable outcome for week five of a conflict that was described in week one as potentially short-duration.
Wallie has updated the chalkboard. “APRIL 6” remains the primary header with three underlines. He has added a new line: “KHARG ISLAND?” with a question mark. He is considering whether the question mark is appropriate given that the question it raises is not a small one. He has not yet removed it. He has not yet underlined it. He is thinking.
Kash is livestreaming the Monday open countdown. He has four timers on screen: market open, jobs Friday, Iran deadline April 6, and SPR cliff mid-April. He calls this “the timeline.” His viewer count is the highest of the conflict. He is standing up. He has been standing up for two weeks. He shows no signs of sitting down.
Mac has filed from a new location. He describes it as “operationally relevant to the Kharg Island development, geographically speaking.” He has not clarified what this means. The flak jacket is still on. He has noted that a holiday-shortened week does not mean the story takes a holiday. The hotel does not have a pool. There is, however, a very good local breakfast. Mac considers this a net positive.
Percy has convened an emergency session of the expanded peer review team – four pigeons plus the press-pass pigeon – to assess the Kharg Island threat. The conclusion: peanut oil is neutral on Kharg Island seizure scenarios. Percy has published a 400-word addendum. The press-pass pigeon contributed a section. Percy considers the section well-reasoned.
Cachè-AI terminal in the corner. The sombrero has been there since Wednesday. The April 6 Risk Assessment is at page 23. Page 17 covers Kharg Island. Four pages. Nobody asked. The terminal is processing. It is always processing. Beep.
This is entirely made-up satire. Probably!
Breaking scoops courtesy of the Financial Nuts Newswire-because who needs sanity?

Fun Fact:
[Source: U.S. Energy Information Administration – Iran country analysis, eia.gov |
Council on Foreign Relations – Iran-Iraq War historical record, cfr.org – public]
Meme of the Day:
Happy trading,
Phil
Less Brain, More Gain
…and may your trades be smoother than a cashmere codpiece
p.s. There are 3 ways I can help you…
- Option 1: The SPX Income System Book (Just $12)
A complete guide to the system.
Written to be clear, concise, and immediately actionable.
>> Get the Book Here

- Option 2: Full Course + Software Access – 50% off for Regular Readers – Save $998.50
Includes the video walkthroughs, tools for TradeStation & TradingView, and everything I use daily. Plus 7 additional strategies
>> Get DIY Training & Software

- Option 3: Join the Fast Forward Mentorship – 50% off for Regular Readers – Save $3,000
>> Join the Fast Forward Mentorship – trade live, twice a week, with me and the crew. PLUS Monthly on-demand 1-2-1’s
No fluff. Just profits, pulse bars, and patterns that actually work.