Tag ‘n Turn Grinds Theta While Custom Tools Signal Neutral Territory
 Ahoy there, Trader! ⚓️
It’s Phil…
Morning traders – it’s Tuesday, last day of the month, and boredom may well kick in on these indices as the bean counters juggle positions for month-end reporting. The systematic approach handles this admirably by simply continuing to collect theta regardless of market enthusiasm levels.
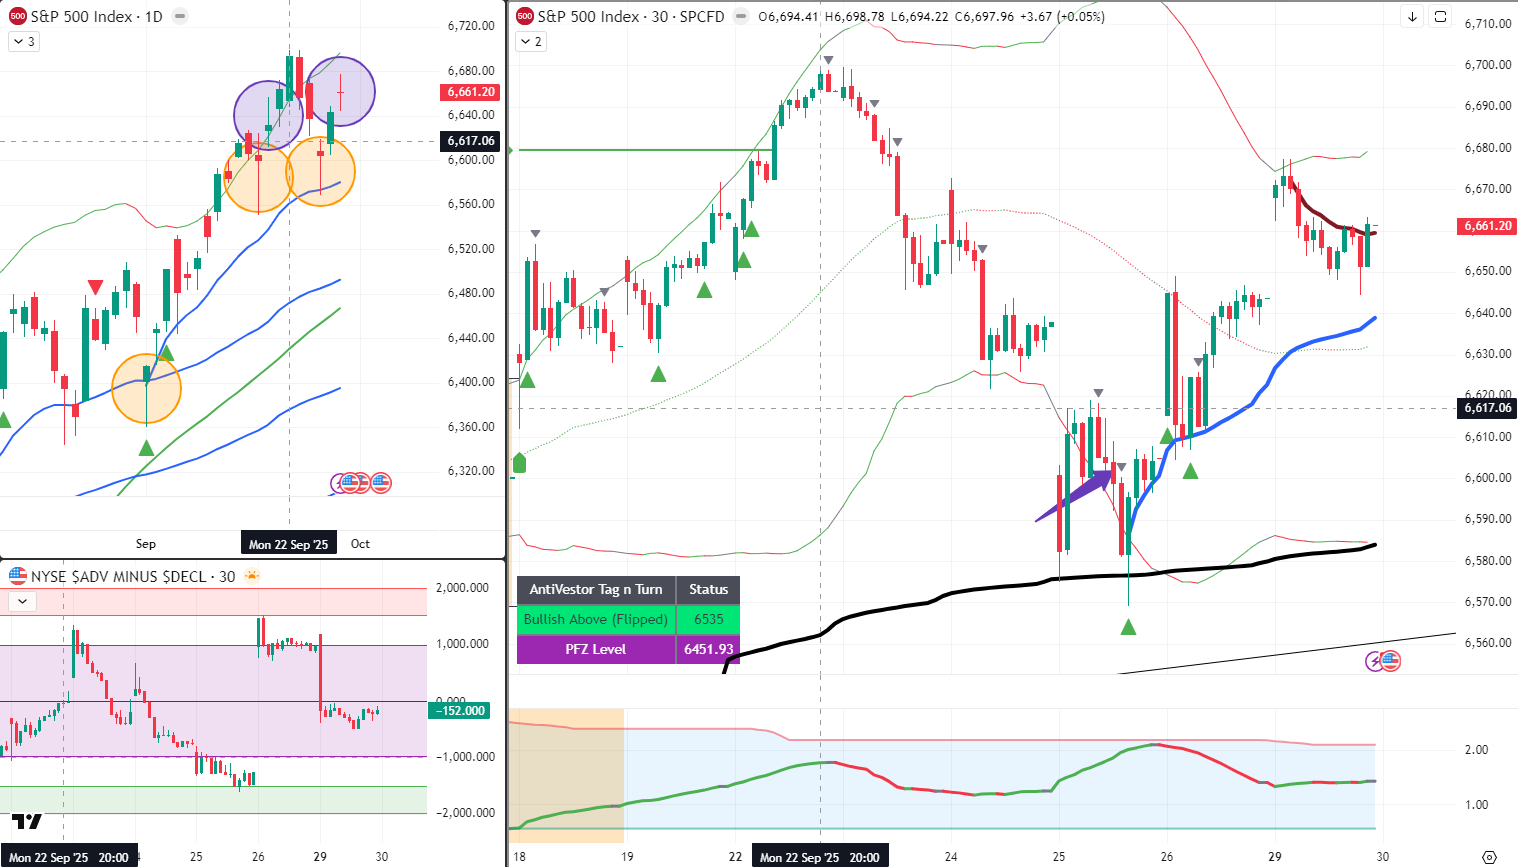
On SPX, history appears to be repeating itself with those orange and blue circles marking similar pattern behaviour. The big question for me: will we see new all-time highs, or is this the short-term top? Given we’re in crash/correction season, I’m favouring a short-term top for now.
That doesn’t mean we can’t see, for example, a December sell-off later – it’s just that these moves commonly appear at certain predictable times of the year, every year. The beauty of systematic trading lies in responding to what actually happens rather than becoming married to seasonal predictions.
Keep scrolling for the crude oil three-win streak…
SPX Market Briefing:
Tuesday’s last day of month positioning creates the sort of indecisive price action that systematic approaches handle brilliantly through patience.
Current Multi-Market Status:
- SPX: Historical pattern repeating, awaiting directional clarity on highs vs top
- Tag ‘n Turn: Upper BB tag complete, awaiting bear pulse bar confirmation
- RUT: More pronounced pattern offering clearer systematic read
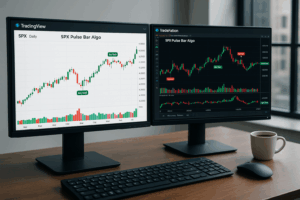
- Futures: ES and RTY pinching between A.VWAP lines suggesting neutral territory
Historical Pattern Recognition:
Looking at SPX’s daily chart (top left), we can see history repeating itself with the orange and blue circled areas. These similar patterns at key junctures raise the essential question: new all-time highs or short-term top?
My bias leans towards short-term top given the crash/correction season timing, but systematic discipline requires waiting for actual confirmation rather than acting on seasonal expectations alone. Custom tools I’m experimenting with also suggest neutral movements for the moment.
Tag ‘n Turn Daily Grind:
The Tag ‘n Turn – our daily theta collection machine – does its thing as always. We’ve tagged the upper Bollinger Band and now simply await the bear pulse bar to confirm directional intent.
Given it’s the last day of the month and this week’s news flow, the neutral positioning isn’t particularly surprising. Most market participants count beans whilst awaiting Friday’s big employment data release.
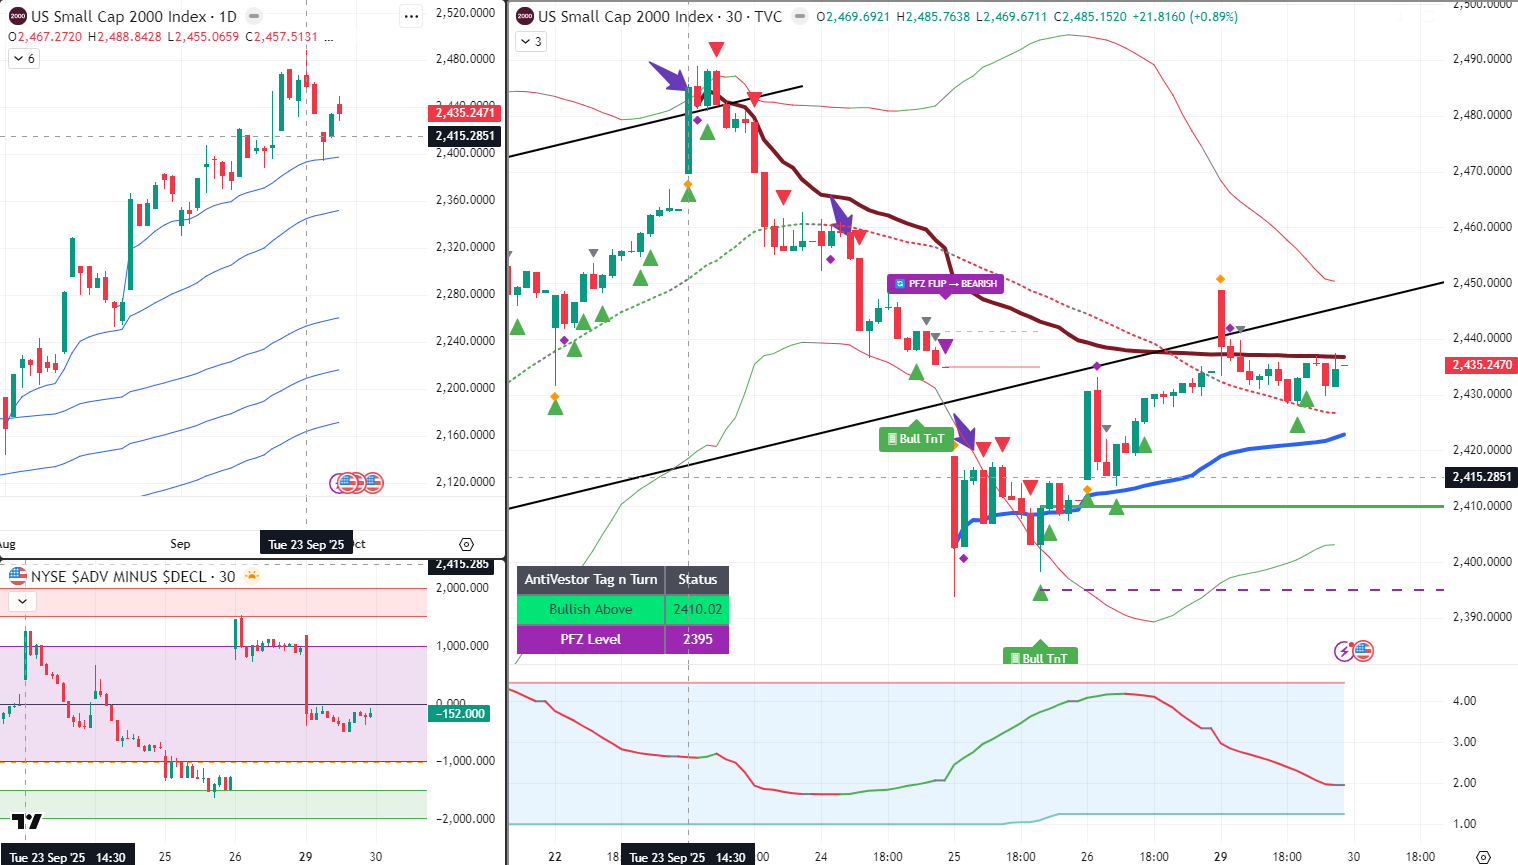
RUT Clarity Advantage:
RUT looks very similar to SPX but more pronounced, offering a considerably easier read for systematic positioning. When two indices show correlation but one provides clearer signals, that’s valuable information for mechanical execution.
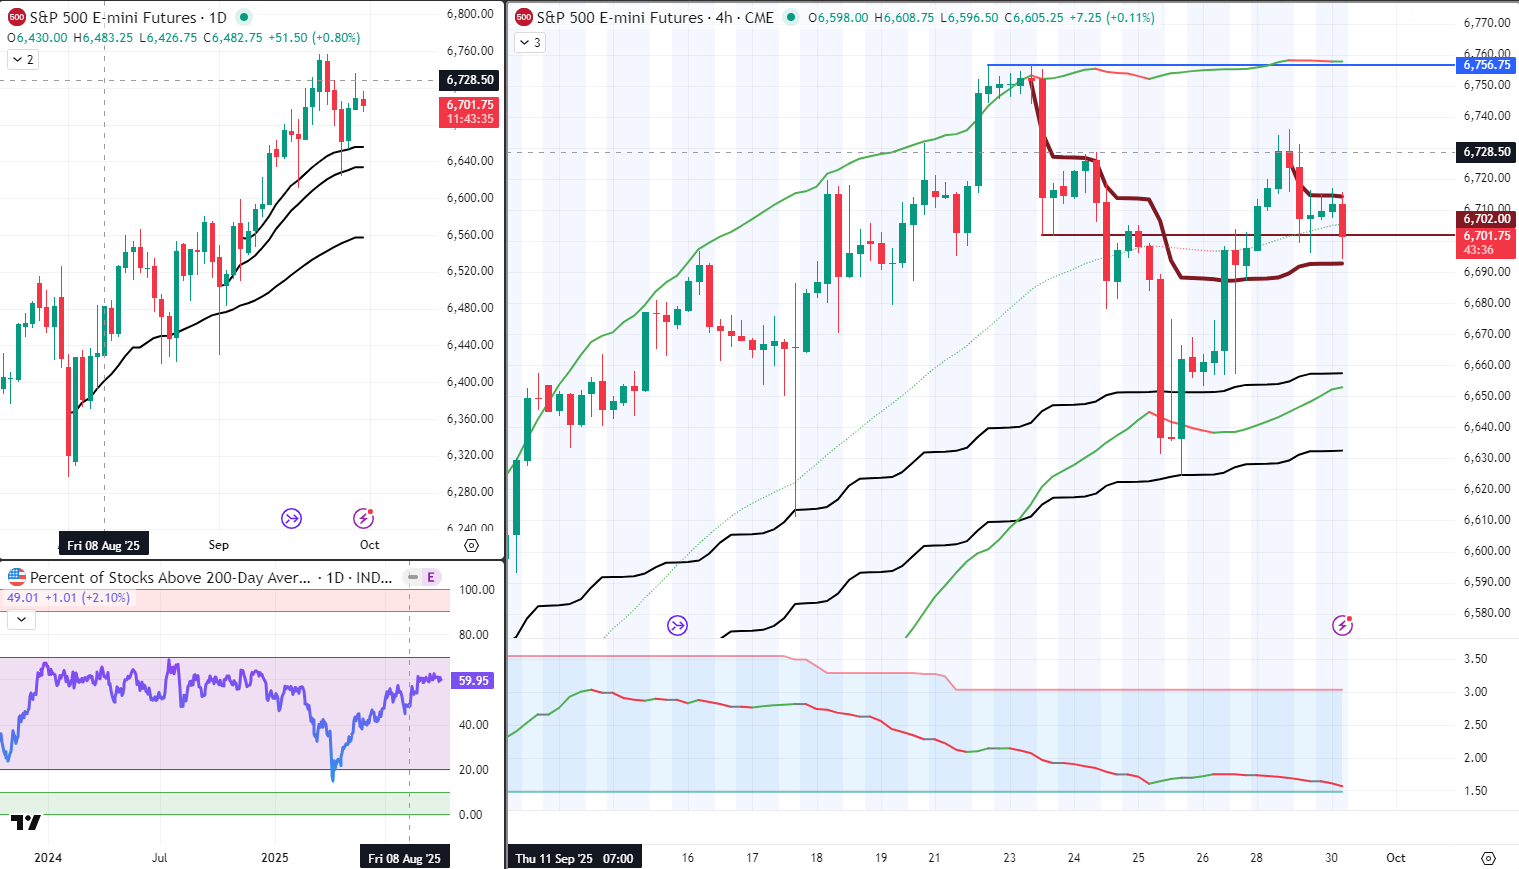
Futures Pinching Analysis:
ES and RTY futures’ bigger picture hasn’t changed dramatically. I’m still leaning bearish here, though RTY’s 4-hour bear A.VWAP line has been reclaimed and we’re clearly “pinching” between the bull and bear A.VWAP boundaries.
Same analysis, different timeframes and instruments, although same underlying market. Bottom line? Meh. Perfectly acceptable systematic response to unclear conditions.
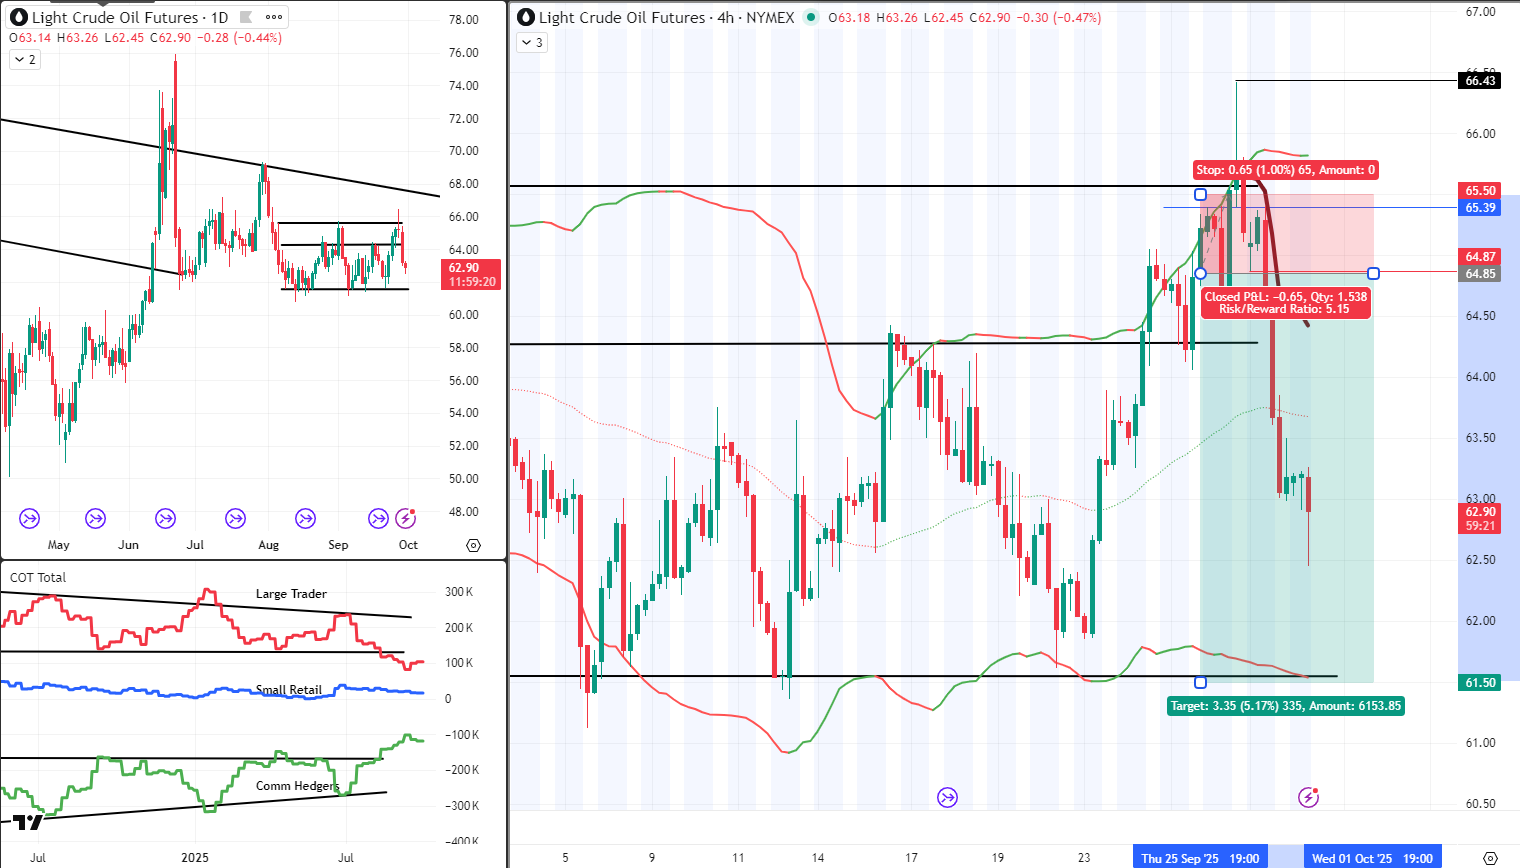
Crude Oil Three-Win Streak:
/CL crude oil futures – you slick sip of Texas tea – delivered pretty much as expected. Bearish on a range reversal producing another pop ‘n drop. I wish they all moved this quickly.
We’re now 3 for 3 since including it in the trading rotation, currently targeting the range lows as standard per the 6 Money Making Patterns. When systematic approaches work this consistently across new instruments, it validates the mechanical framework beautifully.
Bottom Line Summary:
- Swings are swinging
- Theta is dripping
- Poppers are popping (as soon as the opening bell rings)
This Week’s Calendar Context:
Employment data week means Friday’s Non-Farm Payrolls takes centre stage whilst Tuesday-Thursday provide the appetizers. Month-end positioning adds another layer of participant behaviour to navigate through systematic patience.
In Other News…
FinNuts Market Flash
S&P edges higher whilst shutdown theatre entertains
S&P futures climbed modestly to 6,677 like Percy cautiously approaching the office biscuit tin after budget cuts announced. Nasdaq futures ahead 22 points whilst Dow added 40 because apparently even futures markets can’t decide if government dysfunction matters anymore. Overnight range tighter than Mac’s control over premium whisky during fiscal crises at 6,665-6,680. Traders awaiting clarity on government funding before committing capital like sensible humans avoiding political drama.
Sector rotation discovers furniture tariff trauma
Safe-haven bid dominated with materials leading on gold’s record surge whilst utilities held defensive positioning like Wallie during performance review season. Consumer discretionary lagged on Trump’s furniture tariff proclamation hitting RH, Wayfair, Williams-Sonoma because apparently making sofas more expensive solves trade imbalances. Homebuilders showing caution on lumber duty concerns proving even construction companies can read political tea leaves.
Earnings calendar empties before quarterly confession season
Light calendar ahead of Q3 reporting season kickoff next week because corporate executives prefer confessing sins together rather than individually. Focus shifted to October 14 tariff effective date and potential November jobs report delay if BLS operations suspended, proving even employment statistics need government funding. Corporate treasury cryptocurrency buying slowdown reflected institutional hesitation as quarter closed like investors suddenly remembering risk management exists.
Cross-asset divergence reaches philosophical extremes
Gold’s 46% year-to-date surge versus S&P’s 17% gain marked sharpest divergence since 2020 pandemic flight-to-safety because apparently shiny rocks outperform productive companies during uncertainty. Bond-equity correlation breaking down with ten-year yields holding 4.24% despite equity resilience, suggesting fixed income pricing greater shutdown risk than stocks. Cryptocurrency’s overnight strength contradicting equity calm proving digital asset traders navigate fiscal dysfunction differently than traditional investors.
-Hazel
Rumour Has It…
Breaking from the Financial Nuts newsroom: Percy was discovered training his desk pigeons in “Month-End Bean Counting Formation” whilst claiming they had mastered double-entry bookkeeping through advanced cooing coordination.
Hazel updated her crisis management protocols to include “Historical Pattern Repetition Assessment Procedures” alongside emergency plans for “Trading Through Terminal Market Boredom.”
Mac raised his Tuesday morning whisky and declared, “When markets pinch between A.VWAP lines whilst bean counters fiddle with positions, only systematic approaches maintain profitable sanity!”
Kash attempted livestreaming about “DeFi liquidity pinching versus traditional A.VWAP compression during month-end positioning cycles” but got distracted explaining why crude oil was called Texas tea.
Wallie grumbled that in his day, month-end meant proper volatility rather than this “pinching nonsense whilst accountants push papers around pretending it matters!”
This is entirely made-up satire. Probably!
Breaking scoops courtesy of the Financial Nuts Newswire-because who needs sanity?
Fun Fact:
⚡ Flash Crashes: When Markets Have Seizures
Flash crashes see markets drop 5-10% in minutes before recovering just as quickly-like financial epilepsy where billions of dollars vanish and reappear faster than you can refresh your browser!
Flash crashes are what happen when the stock market has a full-scale technological seizure and decides to simulate the apocalypse in fast-forward!
The most famous occurred on May 6, 2010, when the Dow Jones dropped nearly 1,000 points in minutes due to a single $4.1 billion sell order that sent algorithms into a panic-induced feeding frenzy faster than piranhas spotting a wounded tourist.


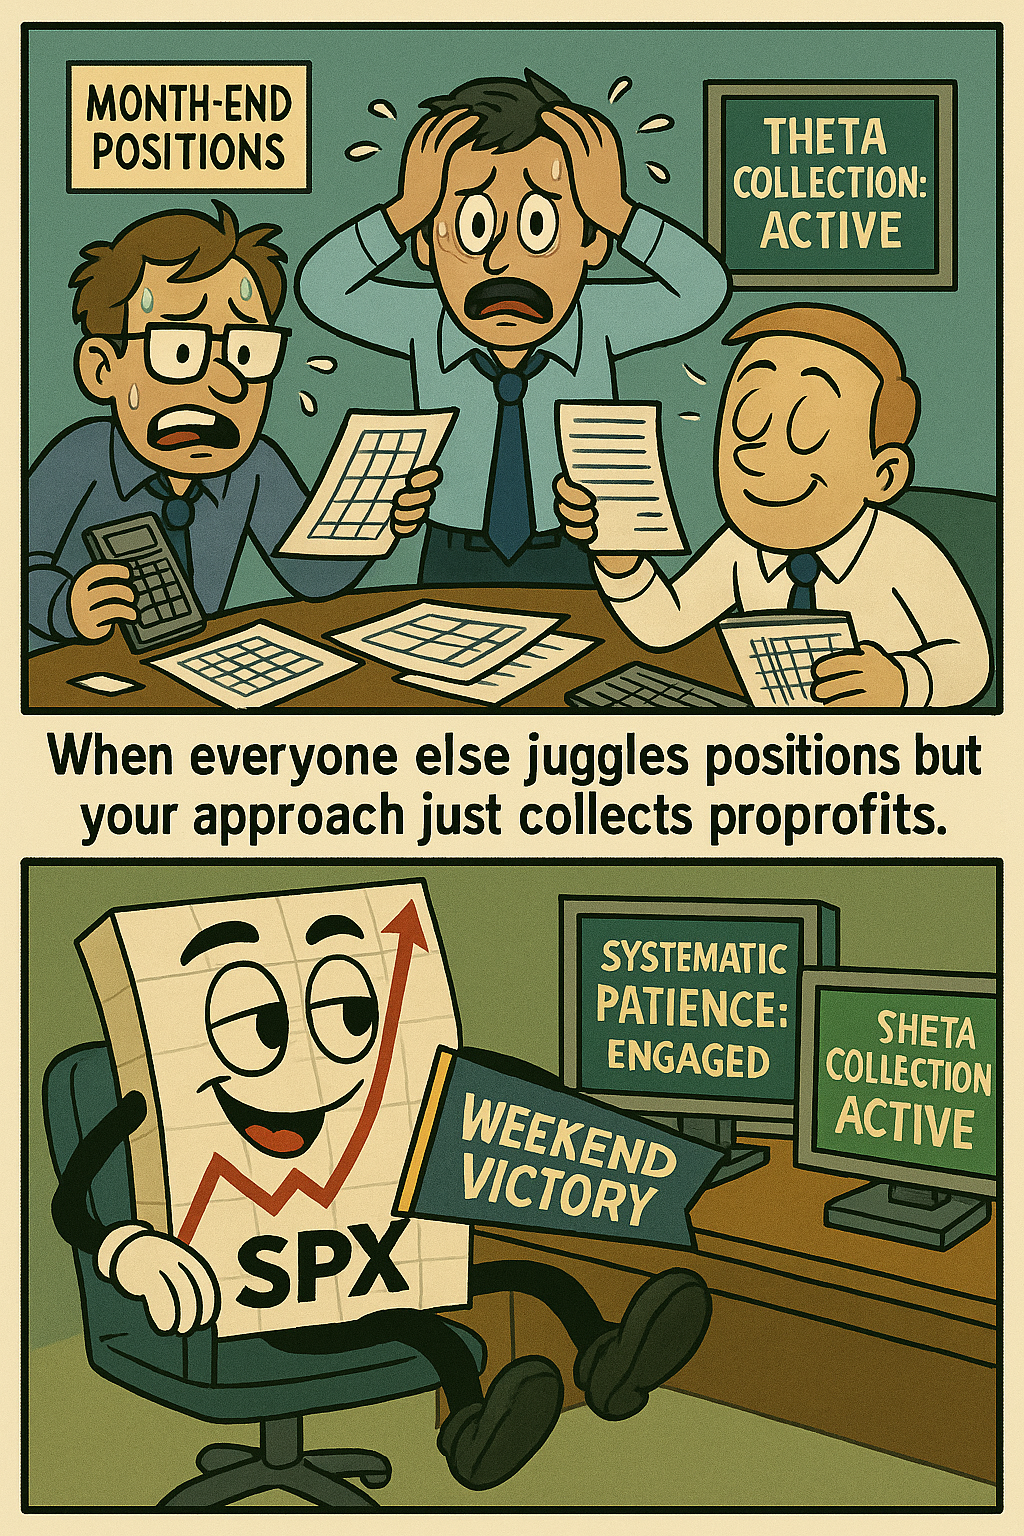
Meme of the Day:
When bean counters juggle month-end positions but your systematic approach just collects theta
Happy trading,
Phil
Less Brain, More Gain
…and may your trades be smoother than a cashmere codpiece
p.s. There are 3 ways I can help you…
- Option 1: The SPX Income System Book (Just $12)
A complete guide to the system.
Written to be clear, concise, and immediately actionable.
>> Get the Book Here
- Option 2: Full Course + Software Access – 50% off for Regular Readers – Save $998.50
Includes the video walkthroughs, tools for TradeStation & TradingView, and everything I use daily. Plus 7 additional strategies
>> Get DIY Training & Software
- Option 3: Join the Fast Forward Mentorship – 50% off for Regular Readers – Save $3,000
>> Join the Fast Forward Mentorship – trade live, twice a week, with me and the crew. PLUS Monthly on-demand 1-2-1’s
No fluff. Just profits, pulse bars, and patterns that actually work.