 Ahoy there Trader! ⚓️
It’s Phil…
SPX has been on a steady climb, teasing us with new all-time highs at the 6100 level. But is it time for a breather?
Historical patterns suggest a pullback toward 6000 could be on the horizon. With bearish signals flashing on shorter timeframes, there’s plenty to unpack and profit from as the price action wibbles and wobbles.

…keep scrolling for more in-depth analysis ⬇️⬇️⬇️
Important Question: Are you ready to trade smarter?
When you’re ready – Dive Deeper Into a Profitable Rules Based Trading System
This Proven 3-Step “10 min/Day” 6-Figure Unconventional Recession Proof SPX Income System Unlocks $500-$5,000+ Days FAST! …
SPX Breakout Analysis:
6100: A Familiar Pattern
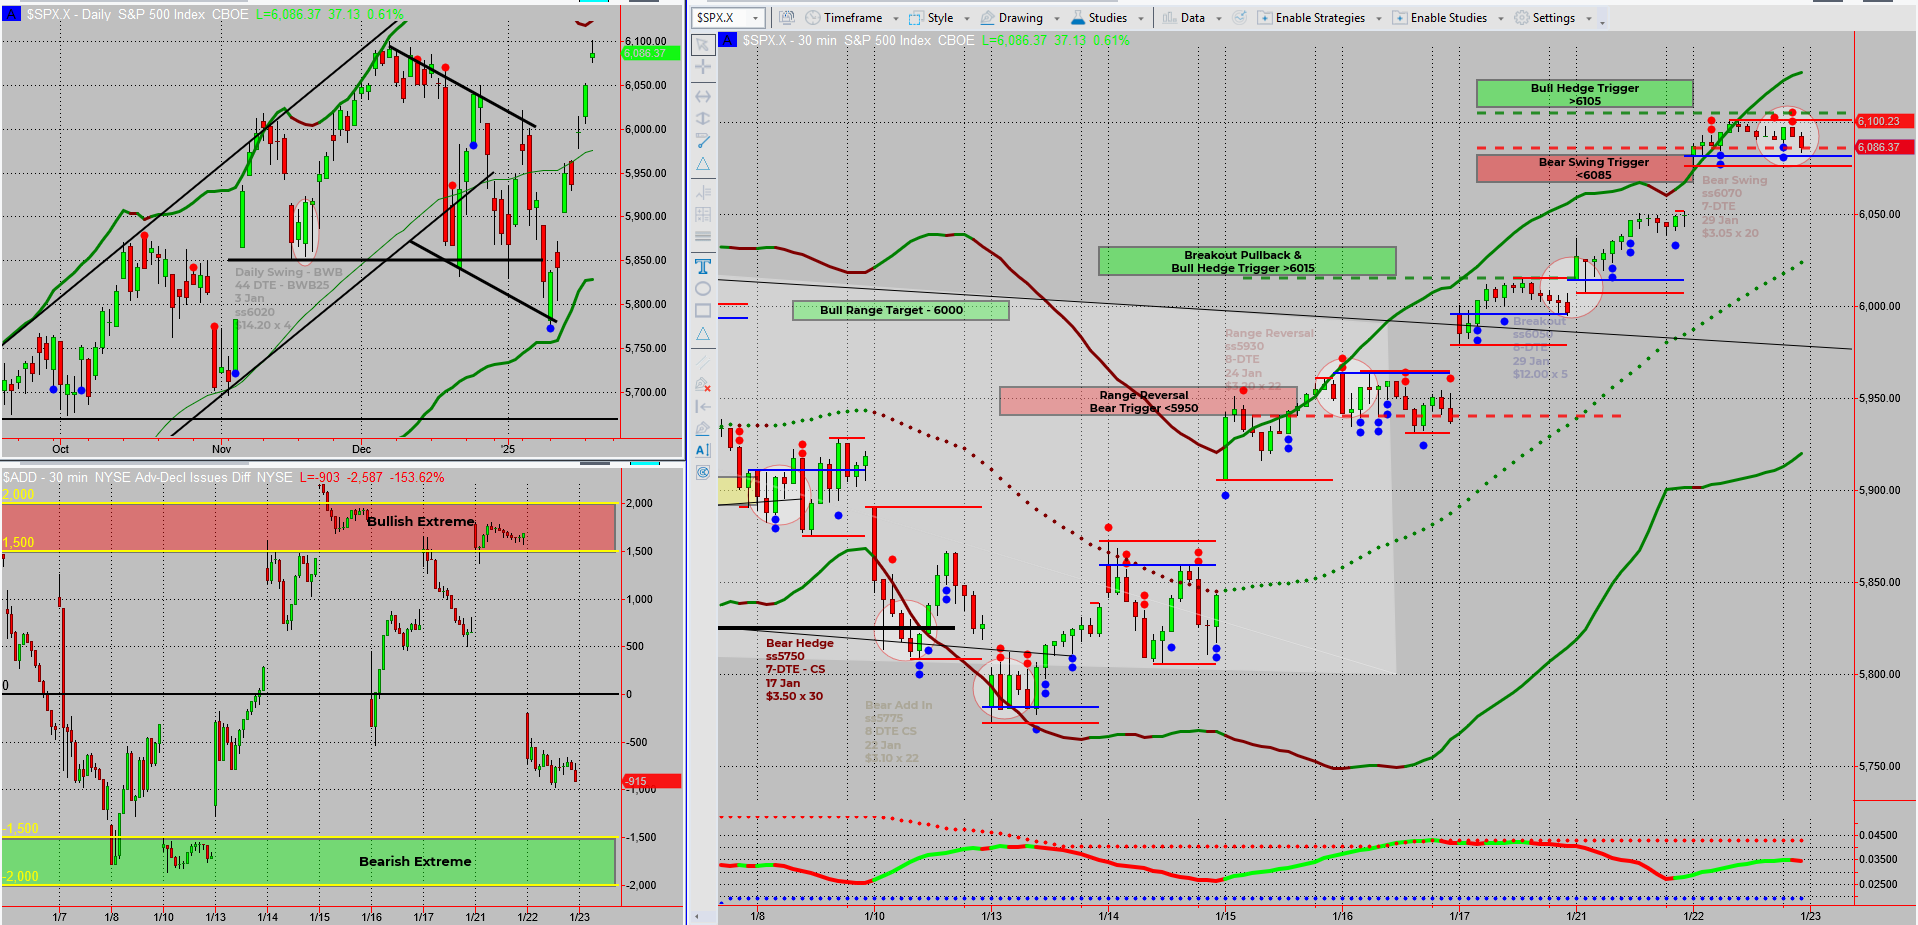
SPX is knocking on the 6100 door, following a well-trodden path of new all-time highs. Over the past 6–8 months, we’ve seen similar scenarios—sharp pushes to fresh highs, followed by retracements toward key psychological levels like 6000. Yesterday’s daily exhaustion bar could signal that this next retracement is just around the corner.
30-Min Chart Signals
Zooming in, our trusty 30-min charts reveal some telling clues:
- Tag ‘n Turn Setup: A new bearish signal emerges, supported by multiple bearish pulse bars.
- Conservative V-Pattern: This pattern hints at bullish exhaustion, adding weight to the idea of a near-term correction.
⚖️ Balancing Bullish and Bearish Biases
While the longer-term trend remains bullish, these shorter-term signals suggest caution. It’s the classic tug-of-war between momentum and exhaustion. As we approach February’s notorious correction season, it’s wise to be nimble and ready for opportunities in either direction.
Profit Along the Wibble-Wobble
With these setups in play, the focus shifts to capturing gains from shorter-term movements:
- Monitor price action around 6100 for signs of resistance or exhaustion.
- Look for retracement opportunities toward 6000 to align with historical patterns.
- Leverage bearish setups like “Tag ‘n Turn” to navigate these shifts profitably.
As always, it’s about staying adaptable and letting the charts do the talking. Whether SPX wobbles, wibbles, or surges, there’s money to be made along the way.
Fun Fact
Did You Know?
In 1999, the Nasdaq gained 85%, fuelled by the dot-com bubble. The following year, it dropped by 39%, marking one of the sharpest reversals in history. This highlights the power of momentum—and the dangers of exhaustion!
The Nasdaq’s meteoric rise in 1999 was driven by speculative fervour, with investors piling into tech stocks regardless of fundamentals. But as soon as reality set in, the market snapped back, erasing trillions in value. This shows why sustainable trends with steady pullbacks are healthier—and why straight-line moves can spell trouble.
Happy trading,
Phil
Less Brain More Gain
…and may your trades be smoother than a cashmere codpiece
